Nile water accounting — how much is water resources and use in the Nile basin?
•
1 recomendación•434 vistas

The document summarizes a water accounting analysis of the Nile River basin. It finds that of the 1745 km3 of annual rainfall in the basin, only 76.6 km3 (4%) is available for diversion due to high evapotranspiration rates. Natural land uses like forests and savannah account for 85% of the basin's water consumption, while irrigated agriculture accounts for just 4% despite occupying a larger area. There is potential to increase water productivity in natural lands through improvements that benefit livestock grazing without increasing river diversions.
Recomendados

Recomendados
Más contenido relacionado
La actualidad más candente
La actualidad más candente (11)
Destacado
Destacado (7)
Similar a Nile water accounting — how much is water resources and use in the Nile basin?
Similar a Nile water accounting — how much is water resources and use in the Nile basin? (20)
Más de ILRI
Más de ILRI (20)
Último
Último (20)
Nile water accounting — how much is water resources and use in the Nile basin?
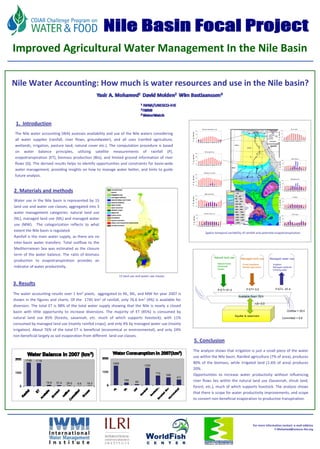
- 1. FU Berlin Improved Agricultural Water Management In the Nile Basin Nile Water Accounting: How much is water resources and use in the Nile basin? 1. Introduction The Nile water accounting (WA) assesses availability and use of the Nile waters considering all water supplies (rainfall, river flows, groundwater), and all uses (rainfed agriculture, wetlands, irrigation, pasture land, natural cover etc.). The computation procedure is based on water balance principles, utilizing satellite measurements of rainfall (P), evapotranspiration (ET), biomass production (Bio), and limited ground information of river flows (Q). The derived results helps to identify opportunities and constraints for basin‐wide water management, providing insights on how to manage water better, and hints to guide future analysis. 2. Materials and methods < 25 25 - 50 50 - 100 Water use in the Nile basin is represented by 15 100 - 200 200-400 land use and water use classes, aggregated into 3 400 - 600 600 - 800 water management categories: natural land use 800 - 1000 1000 - 1200 1200 -1400 (NL), managed land use (ML) and managed water 1400 - 1600 >1600 use (MW). The categorization reflects to what extent the Nile basin is regulated. Spatio‐temporal variability of rainfall and potential evapotranspiration Rainfall is the main water supply, as there are no inter‐basin water transfers. Total outflow to the Mediterranean Sea was estimated as the closure term of the water balance. The ratio of biomass Natural land use Managed land use Managed water use production to evapotranspiration provides an Natural forest Forest plantation Irrigation indicator of water productivity. Savannah Rainfed agricutlure Managed wetlands Desert Drinking water 15 land use and water use classes 3. Results P-ET= 81.4 P-ET= 5.0 P-ET= -57.4 The water accounting results over 1 km2 pixels, aggregated to NL, ML, and MW for year 2007 is Available flow= 76.6 shown in the figures and charts. Of the 1745 km3 of rainfall, only 76.6 km3 (4%) is available for ΔS= 0.0 diversion. The total ET is 98% of the total water supply showing that the Nile is nearly a closed basin with little opportunity to increase diversions. The majority of ET (85%) is consumed by Outflow = 29.0 Aquifer & reservoirs natural land use 85% (forests, savannah, etc. much of which supports livestock); with 11% Committed = 9.8 consumed by managed land use (mainly rainfed crops); and only 4% by managed water use (mainly irrigation). About 76% of the total ET is beneficial (economical or environmental), and only 24% non‐beneficial largely as soil evaporation from different land use classes. 5. Conclusion The analysis shows that irrigation is just a small piece of the water use within the Nile basin. Rainfed agriculture (7% of area), produces 80% of the biomass, while irrigated land (1.6% of area) produces 20%. Opportunities to increase water productivity without influencing river flows lies within the natural land use (Savannah, shrub land, forest, etc.), much of which supports livestock. The analysis shows that there is scope for water productivity improvements, and scope to convert non‐beneficial evaporation to productive transpiration. For more information contact: e‐mail address Y.Mohamed@unesco‐ihe.org