SlideShare una empresa de Scribd logo
1 de 26
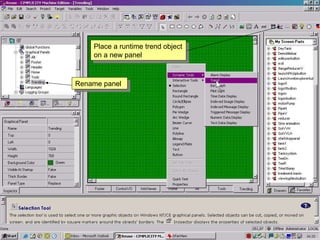
Place a runtime trend object on a new panel Rename panel
Drag and resize to suit
Assign variables to the pens
Fill in axis parameters
Give the trend object some data to display
The data begins to display each time the screen is opened ie: only Realtime data is shown
Create two new logging groups and set up logging strategy
Determine the frequency that data logs to TrendX
To configure large numbers of points undock the variables window
Bring up properties columns
Select the columns list
To tidy up the view, right-click and use the Remove column tab
Select your points by click and drag Just type T or F to make logging enabled TRUE or FALSE
Add the column Logging group settings group
Type any key to bring up the logging groups available
Again we can change as many points on view as we want
We have to download the logging data points and strategy so that we can use TrendX to open the log file
Launch TrendX
Once open we select a database
Browse your folders
My folder is called Reuse
Open the database log file
Each of our logging groups can be expanded  We add points to our charts by simply double clicking
We can create a number of different charts and in a variety of modes The  points displayed show at the bottom and their associated values
With custom modes the chart indicator shows red
With realtime modes the chart indicator shows green We can zoom in and out and select cursor postion to see exact values

Más contenido relacionado

La actualidad más candente

La actualidad más candente (20)

MS Excel
MS ExcelMS Excel
MS Excel
 
22 Excel Basics
22 Excel Basics22 Excel Basics
22 Excel Basics
 
Excel: Freezing Panes
Excel: Freezing PanesExcel: Freezing Panes
Excel: Freezing Panes
 
Microsoft word
Microsoft wordMicrosoft word
Microsoft word
 
Ms excel
Ms excelMs excel
Ms excel
 
flowchart & algorithms
flowchart & algorithmsflowchart & algorithms
flowchart & algorithms
 
Ms excel ppt
Ms excel pptMs excel ppt
Ms excel ppt
 
Excel for beginner
Excel for beginnerExcel for beginner
Excel for beginner
 
Text editor
Text editorText editor
Text editor
 
Charts and graphs in excel
Charts and graphs in excelCharts and graphs in excel
Charts and graphs in excel
 
Data Analysis with MS Excel.pptx
Data Analysis with MS Excel.pptxData Analysis with MS Excel.pptx
Data Analysis with MS Excel.pptx
 
'Spreadsheet'
'Spreadsheet''Spreadsheet'
'Spreadsheet'
 
Ms excel
Ms excelMs excel
Ms excel
 
Spreadsheet-Software
Spreadsheet-SoftwareSpreadsheet-Software
Spreadsheet-Software
 
Training MS Access 2007
Training MS Access 2007Training MS Access 2007
Training MS Access 2007
 
Excel PowerPoint
Excel PowerPointExcel PowerPoint
Excel PowerPoint
 
HTML 5 Tables and Forms
HTML 5 Tables and FormsHTML 5 Tables and Forms
HTML 5 Tables and Forms
 
Datatype in JavaScript
Datatype in JavaScriptDatatype in JavaScript
Datatype in JavaScript
 
Text formatting in ms word ppt
Text formatting in ms word pptText formatting in ms word ppt
Text formatting in ms word ppt
 
What are variables and keywords in c++
What are variables and keywords in c++What are variables and keywords in c++
What are variables and keywords in c++
 

Destacado

Proficy machine edition logging
Proficy machine edition loggingProficy machine edition logging
Proficy machine edition loggingIamtubalcain
 
Proficy machine edition scripting
Proficy machine edition scriptingProficy machine edition scripting
Proficy machine edition scriptingIamtubalcain
 
Batch Processing with Amazon EC2 Container Service
Batch Processing with Amazon EC2 Container ServiceBatch Processing with Amazon EC2 Container Service
Batch Processing with Amazon EC2 Container ServiceAmazon Web Services
 
Java EE 7 Batch processing in the Real World
Java EE 7 Batch processing in the Real WorldJava EE 7 Batch processing in the Real World
Java EE 7 Batch processing in the Real WorldRoberto Cortez
 
Open Source Logging and Monitoring Tools
Open Source Logging and Monitoring ToolsOpen Source Logging and Monitoring Tools
Open Source Logging and Monitoring ToolsPhase2
 
The 5 People in your Organization that grow Legacy Code
The 5 People in your Organization that grow Legacy CodeThe 5 People in your Organization that grow Legacy Code
The 5 People in your Organization that grow Legacy CodeRoberto Cortez
 
Log Mining: Beyond Log Analysis
Log Mining: Beyond Log AnalysisLog Mining: Beyond Log Analysis
Log Mining: Beyond Log AnalysisAnton Chuvakin
 

Destacado (7)

Proficy machine edition logging
Proficy machine edition loggingProficy machine edition logging
Proficy machine edition logging
 
Proficy machine edition scripting
Proficy machine edition scriptingProficy machine edition scripting
Proficy machine edition scripting
 
Batch Processing with Amazon EC2 Container Service
Batch Processing with Amazon EC2 Container ServiceBatch Processing with Amazon EC2 Container Service
Batch Processing with Amazon EC2 Container Service
 
Java EE 7 Batch processing in the Real World
Java EE 7 Batch processing in the Real WorldJava EE 7 Batch processing in the Real World
Java EE 7 Batch processing in the Real World
 
Open Source Logging and Monitoring Tools
Open Source Logging and Monitoring ToolsOpen Source Logging and Monitoring Tools
Open Source Logging and Monitoring Tools
 
The 5 People in your Organization that grow Legacy Code
The 5 People in your Organization that grow Legacy CodeThe 5 People in your Organization that grow Legacy Code
The 5 People in your Organization that grow Legacy Code
 
Log Mining: Beyond Log Analysis
Log Mining: Beyond Log AnalysisLog Mining: Beyond Log Analysis
Log Mining: Beyond Log Analysis
 

Similar a Proficy machine edition trending

Report exchange designer
Report exchange designerReport exchange designer
Report exchange designerBhushan Rajgure
 
ACTG Tableau intro labDownload the TableauLab file and look ov.docx
ACTG   Tableau intro labDownload the TableauLab file and look ov.docxACTG   Tableau intro labDownload the TableauLab file and look ov.docx
ACTG Tableau intro labDownload the TableauLab file and look ov.docxnettletondevon
 
Data camp - Tableau basics cheat sheet.pdf
Data camp - Tableau basics cheat sheet.pdfData camp - Tableau basics cheat sheet.pdf
Data camp - Tableau basics cheat sheet.pdfGhulamMustafa873251
 
Create a PivotTable to analyze worksheet data.pdf
Create a PivotTable to analyze worksheet data.pdfCreate a PivotTable to analyze worksheet data.pdf
Create a PivotTable to analyze worksheet data.pdfAbubakar Bashir
 
Datastream charting getting started
Datastream charting   getting startedDatastream charting   getting started
Datastream charting getting startedIta Kamis
 
How to use a slicer to toggle measures in Power BI
How to use a slicer to toggle measures in Power BIHow to use a slicer to toggle measures in Power BI
How to use a slicer to toggle measures in Power BISelect Distinct Limited
 
Tableau online training || Tableau Server
Tableau online training || Tableau ServerTableau online training || Tableau Server
Tableau online training || Tableau ServerUnited Trainings
 
Tableau online training || Tableau Server
Tableau online training || Tableau ServerTableau online training || Tableau Server
Tableau online training || Tableau ServerUnited Trainings
 
R04 - Basics of Reporting: Report Setup Part 2
R04 - Basics of Reporting: Report Setup Part 2 R04 - Basics of Reporting: Report Setup Part 2
R04 - Basics of Reporting: Report Setup Part 2 Maintenance Connection
 
High score plus guide (3)
High score plus guide (3)High score plus guide (3)
High score plus guide (3)SUTAPA DEB
 
Tableau online training
Tableau online trainingTableau online training
Tableau online trainingsuresh
 
Lesson 16 Working With Charts
Lesson 16   Working With ChartsLesson 16   Working With Charts
Lesson 16 Working With Chartsguevarra_2000
 
CREATING A DATASET FROM EXCEL IN POWER BI REPORT BUILDER
CREATING A DATASET FROM EXCEL IN POWER BI REPORT BUILDERCREATING A DATASET FROM EXCEL IN POWER BI REPORT BUILDER
CREATING A DATASET FROM EXCEL IN POWER BI REPORT BUILDERSagarDuttPhuloria
 
Getting Started with SharePoint Status Indicators - EPC Group
Getting Started with SharePoint Status Indicators - EPC GroupGetting Started with SharePoint Status Indicators - EPC Group
Getting Started with SharePoint Status Indicators - EPC GroupEPC Group
 
Week 2 Project - STAT 3001Student Name Type your name here.docx
Week 2 Project - STAT 3001Student Name Type your name here.docxWeek 2 Project - STAT 3001Student Name Type your name here.docx
Week 2 Project - STAT 3001Student Name Type your name here.docxcockekeshia
 

Similar a Proficy machine edition trending (20)

Report exchange designer
Report exchange designerReport exchange designer
Report exchange designer
 
ACTG Tableau intro labDownload the TableauLab file and look ov.docx
ACTG   Tableau intro labDownload the TableauLab file and look ov.docxACTG   Tableau intro labDownload the TableauLab file and look ov.docx
ACTG Tableau intro labDownload the TableauLab file and look ov.docx
 
Tableau+Cheat+Sheet.pdf
Tableau+Cheat+Sheet.pdfTableau+Cheat+Sheet.pdf
Tableau+Cheat+Sheet.pdf
 
Data camp - Tableau basics cheat sheet.pdf
Data camp - Tableau basics cheat sheet.pdfData camp - Tableau basics cheat sheet.pdf
Data camp - Tableau basics cheat sheet.pdf
 
Create a PivotTable to analyze worksheet data.pdf
Create a PivotTable to analyze worksheet data.pdfCreate a PivotTable to analyze worksheet data.pdf
Create a PivotTable to analyze worksheet data.pdf
 
Datastream charting getting started
Datastream charting   getting startedDatastream charting   getting started
Datastream charting getting started
 
How to use a slicer to toggle measures in Power BI
How to use a slicer to toggle measures in Power BIHow to use a slicer to toggle measures in Power BI
How to use a slicer to toggle measures in Power BI
 
Power BI Tips Switch Measures.pptx
Power BI Tips Switch Measures.pptxPower BI Tips Switch Measures.pptx
Power BI Tips Switch Measures.pptx
 
Tableau.pdf
Tableau.pdfTableau.pdf
Tableau.pdf
 
Tableau online training || Tableau Server
Tableau online training || Tableau ServerTableau online training || Tableau Server
Tableau online training || Tableau Server
 
Tableau online training || Tableau Server
Tableau online training || Tableau ServerTableau online training || Tableau Server
Tableau online training || Tableau Server
 
R04 - Basics of Reporting: Report Setup Part 2
R04 - Basics of Reporting: Report Setup Part 2 R04 - Basics of Reporting: Report Setup Part 2
R04 - Basics of Reporting: Report Setup Part 2
 
Microsoft Excel Tutorial
Microsoft Excel TutorialMicrosoft Excel Tutorial
Microsoft Excel Tutorial
 
High score plus guide (3)
High score plus guide (3)High score plus guide (3)
High score plus guide (3)
 
Tableau online training
Tableau online trainingTableau online training
Tableau online training
 
Print16
Print16Print16
Print16
 
Lesson 16 Working With Charts
Lesson 16   Working With ChartsLesson 16   Working With Charts
Lesson 16 Working With Charts
 
CREATING A DATASET FROM EXCEL IN POWER BI REPORT BUILDER
CREATING A DATASET FROM EXCEL IN POWER BI REPORT BUILDERCREATING A DATASET FROM EXCEL IN POWER BI REPORT BUILDER
CREATING A DATASET FROM EXCEL IN POWER BI REPORT BUILDER
 
Getting Started with SharePoint Status Indicators - EPC Group
Getting Started with SharePoint Status Indicators - EPC GroupGetting Started with SharePoint Status Indicators - EPC Group
Getting Started with SharePoint Status Indicators - EPC Group
 
Week 2 Project - STAT 3001Student Name Type your name here.docx
Week 2 Project - STAT 3001Student Name Type your name here.docxWeek 2 Project - STAT 3001Student Name Type your name here.docx
Week 2 Project - STAT 3001Student Name Type your name here.docx
 

Más de Iamtubalcain

Proficy machine edition environment
Proficy machine edition environmentProficy machine edition environment
Proficy machine edition environmentIamtubalcain
 
Proficy machine edition security PPT
Proficy machine edition security PPTProficy machine edition security PPT
Proficy machine edition security PPTIamtubalcain
 
Proficy machine edition logic pc view ethernet
Proficy machine edition logic pc view ethernetProficy machine edition logic pc view ethernet
Proficy machine edition logic pc view ethernetIamtubalcain
 
Proficy machine edition logic pc view duplication
Proficy machine edition logic pc view duplicationProficy machine edition logic pc view duplication
Proficy machine edition logic pc view duplicationIamtubalcain
 
Proficy machine edition logic pc and view int
Proficy machine edition logic pc and view intProficy machine edition logic pc and view int
Proficy machine edition logic pc and view intIamtubalcain
 
Proficy machine edition logic developer plc
Proficy machine edition logic developer plcProficy machine edition logic developer plc
Proficy machine edition logic developer plcIamtubalcain
 
Proficy machine edition alarms
Proficy machine edition alarmsProficy machine edition alarms
Proficy machine edition alarmsIamtubalcain
 
Instruction set reference [by allen bradley]
Instruction set reference  [by allen bradley]Instruction set reference  [by allen bradley]
Instruction set reference [by allen bradley]Iamtubalcain
 

Más de Iamtubalcain (8)

Proficy machine edition environment
Proficy machine edition environmentProficy machine edition environment
Proficy machine edition environment
 
Proficy machine edition security PPT
Proficy machine edition security PPTProficy machine edition security PPT
Proficy machine edition security PPT
 
Proficy machine edition logic pc view ethernet
Proficy machine edition logic pc view ethernetProficy machine edition logic pc view ethernet
Proficy machine edition logic pc view ethernet
 
Proficy machine edition logic pc view duplication
Proficy machine edition logic pc view duplicationProficy machine edition logic pc view duplication
Proficy machine edition logic pc view duplication
 
Proficy machine edition logic pc and view int
Proficy machine edition logic pc and view intProficy machine edition logic pc and view int
Proficy machine edition logic pc and view int
 
Proficy machine edition logic developer plc
Proficy machine edition logic developer plcProficy machine edition logic developer plc
Proficy machine edition logic developer plc
 
Proficy machine edition alarms
Proficy machine edition alarmsProficy machine edition alarms
Proficy machine edition alarms
 
Instruction set reference [by allen bradley]
Instruction set reference  [by allen bradley]Instruction set reference  [by allen bradley]
Instruction set reference [by allen bradley]
 

Proficy machine edition trending

Notas del editor

  1. We will now place a realtime trend chart on a new panel Select the Trend object icon from the toolbar or right-click and select from drop down menu
  2. Rename the panel and we will need to create a button to navigate to and from it.
  3. Assign variables to the pens on the Trend object
  4. Configure the axis settings
  5. Start your logic to give us some data to display
  6. We can now see the data, this is realtime data but there is no facility for historical analysis or printing the chart data So we need to create a chart that will give us this data and capability. We do this with the highly compacted data base tool TrendX
  7. Firstly create two new logging groups
  8. In the property inspector window assign their logging strategy
  9. As we did with alarms we will now configure our points by undocking the variables window to access large numbers of variables at one time for speed
  10. select the columns properties tab
  11. To add the columns with which we are concerned , select the columns list
  12. Right click on the columns window and use the hide columns tab to get rid of unnecessary columns
  13. Select the start point and drag across all the visible points you want to configure here we enable logging Type T or F for True or False
  14. Now logging is enabled we can assign logging groups for our points
  15. If you type any key, a drop down menu will appear with the logging groups that are available from which to select
  16. Change as many as you want
  17. To enable TrendX to assimilate this data we must download the configuration
  18. Start TrendX
  19. We must now add a database to TrendX
  20. Machine Edition has now created a database log based on our configuration information this is held in the project folder.
  21. Open your folder mine is called Reuse
  22. Open the database log file
  23. Now we can see all of the points that we configured for logging that are available to trend
  24. There are a variety of pre-configured modes that can be availed of, or we can create custom charts
  25. Custom modes are historical and are shown with a red marker
  26. Realtime charts are shown with a green indicator. These charts can be zoomed in to or our from for custom viewing