Saksoft's Q4FY15 PBT up 56.04% y/y; Buy
•
1 recomendación•216 vistas

Firstcall recommend Saksoft after Q4FY15 PBT rises 56.04% y/y to INR73.93m

Recomendados
Recomendados
Más contenido relacionado
La actualidad más candente
La actualidad más candente (20)
Destacado
Destacado (14)
Similar a Saksoft's Q4FY15 PBT up 56.04% y/y; Buy
Similar a Saksoft's Q4FY15 PBT up 56.04% y/y; Buy (20)
Más de IndiaNotes.com
Más de IndiaNotes.com (20)
Último
Último (20)
Saksoft's Q4FY15 PBT up 56.04% y/y; Buy
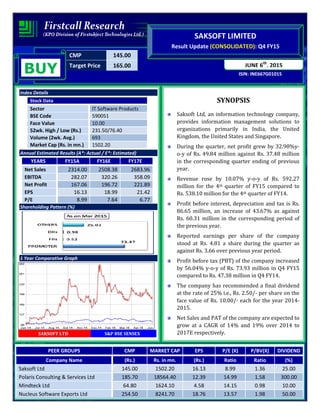
- 1. CMP 145.00 Target Price 165.00 ISIN: INE667G01015 JUNE 6th , 2015 SAKSOFT LIMITED Result Update (CONSOLIDATED): Q4 FY15 BUY Index Details Stock Data Sector IT Software Products BSE Code 590051 Face Value 10.00 52wk. High / Low (Rs.) 231.50/76.40 Volume (2wk. Avg.) 693 Market Cap (Rs. in mn.) 1502.20 Annual Estimated Results (A*: Actual / E*: Estimated) YEARS FY15A FY16E FY17E Net Sales 2314.00 2508.38 2683.96 EBITDA 282.07 320.26 358.09 Net Profit 167.06 196.72 221.89 EPS 16.13 18.99 21.42 P/E 8.99 7.64 6.77 Shareholding Pattern (%) 1 Year Comparative Graph SAKSOFT LTD S&P BSE SENSEX SYNOPSIS Saksoft Ltd, an information technology company, provides information management solutions to organizations primarily in India, the United Kingdom, the United States and Singapore. During the quarter, net profit grew by 32.98%y- o-y of Rs. 49.84 million against Rs. 37.48 million in the corresponding quarter ending of previous year. Revenue rose by 10.07% y-o-y of Rs. 592.27 million for the 4th quarter of FY15 compared to Rs. 538.10 million for the 4th quarter of FY14. Profit before interest, depreciation and tax is Rs. 86.65 million, an increase of 43.67% as against Rs. 60.31 million in the corresponding period of the previous year. Reported earnings per share of the company stood at Rs. 4.81 a share during the quarter as against Rs. 3.66 over previous year period. Profit before tax (PBT) of the company increased by 56.04% y-o-y of Rs. 73.93 million in Q4 FY15 compared to Rs. 47.38 million in Q4 FY14. The company has recommended a final dividend at the rate of 25% i.e., Rs. 2.50/- per share on the face value of Rs. 10.00/- each for the year 2014- 2015. Net Sales and PAT of the company are expected to grow at a CAGR of 14% and 19% over 2014 to 2017E respectively. PEER GROUPS CMP MARKET CAP EPS P/E (X) P/BV(X) DIVIDEND Company Name (Rs.) Rs. in mn. (Rs.) Ratio Ratio (%) Saksoft Ltd 145.00 1502.20 16.13 8.99 1.36 25.00 Polaris Consulting & Services Ltd 185.70 18564.40 12.39 14.99 1.58 300.00 Mindteck Ltd 64.80 1624.10 4.58 14.15 0.98 10.00 Nucleus Software Exports Ltd 254.50 8241.70 18.76 13.57 1.98 50.00
- 2. QUARTERLY HIGHLIGHTS (CONSOLIDATED) Results Updates- Q4 FY15 Saksoft Limited was founded in 1999, an information technology company, provides information management solutions to organizations, reported its financial results for the quarter ended 31st Mar, 2015. The company’s net profit stood at Rs. 49.84 million against Rs. 37.48 million in the corresponding quarter ending of previous year, an increase of 32.98% y-o-y. Revenue for the March quarter rose by 10.07% to Rs. 592.27 million when compared with Rs. 538.10 million for the prior year period. Reported earnings per share of the company stood at Rs. 4.81 a share during the quarter as against Rs. 3.66 over previous year period. Profit before interest, depreciation and tax is Rs. 86.65 million as against Rs. 60.31 million in the corresponding period of the previous year. Break up of Expenditure Months Mar-15 Mar-14 % Change Net Sales 592.27 538.10 10.07 PAT 49.84 37.48 32.98 EPS 4.81 3.66 31.37 EBITDA 86.65 60.31 43.67 Break up of Expenditure (Rs in millions) Q4 FY15 Q4 FY14 Chng % Employee Benefit Expenses 250.07 225.45 11% Dep & Amortization Exp 2.08 4.24 -51% Other Expenses 265.40 253.20 5%
- 3. COMPANY PROFILE Saksoft Limited was founded in 1999 an information technology company provides information management solutions to organizations primarily in India, the United Kingdom, the United States, and Singapore. The company offers various software solutions, including consulting, design, development, re-engineering, systems integration, implementation, and testing services. It provides a range of business consulting and technology services, such as strategic advisory, managed services, business intelligence and enterprise data warehouse, and corporate performance management services, as well as BO migration and report factory, mobile application development, and SAP mobility services. The company offers testing services comprising functional, automated regression, usability and reliability, performance/load, and security testing services, as well as specialized e-commerce testing services; managed services that consist of building custom applications from concept to completion. Its products and solutions include Veri-sens, a business intelligence solution for retail banking and credit cards; Prima, which allows to define loyalty programs at various levels and to tailor the programs to reward loyal customers; Dedupe system to enhance customer data through matching techniques, algorithms, and phonetics; and Acusend that automates and personalizes information generation and distribution in various formats. In addition, the company offers Warehouse Seeker and merchant management solutions, and portfolio performance management services; and services, such as DWH build and implementation, tools migration and re-engineering, data migration, DWH support, application management, data quality, and customer analytic services. It serves banking and insurance, telecom, retail, life sciences, hospitality, travel and leisure, utilities and industries; and public sector and central government.
- 4. FINANCIAL HIGHLIGHT (CONSOLIDATEDT BASIS) (A*- Actual, E* -Estimations & Rs. In Millions) Balance Sheet as at March 31, 2014 -2017E FY-14A FY-15A FY-16E FY-17E SOURCES OF FUNDS Shareholder's Funds Share Capital 102.35 103.60 103.60 103.60 Reserves and Surplus 936.70 1003.34 1123.74 1240.61 1. Sub Total - Net worth 1039.05 1106.94 1227.34 1344.21 2. Minority Interest 0.00 19.12 13.96 15.13 Non Current Liabilities Long term Borrowings 272.96 296.49 317.24 333.11 Long term Provisions 10.03 11.85 13.63 15.26 3. Sub Total - Non Current Liabilities 282.99 308.34 330.87 348.37 Current Liabilities Short term Borrowings 48.29 125.64 173.38 211.53 Trade Payables 251.36 280.01 308.01 332.65 Other Current Liabilities 217.07 247.60 277.31 305.04 Short Term Provisions 62.89 73.51 82.33 90.56 4. Sub Total - Current Liabilities 579.61 726.76 841.04 939.79 Total Liabilities (1+2+3+4) 1901.65 2161.16 2413.21 2647.50 APPLICATION OF FUNDS Non-Current Assets a) Fixed Assets 21.30 19.16 20.69 21.73 b) Deferred tax assets (net) 1076.36 1205.19 1325.71 1438.39 c) Long Term loans and advances 14.37 17.50 20.13 22.54 d) Other non-current assets 9.74 16.31 21.53 26.91 1. Sub Total - Non Current Assets 1121.77 1258.16 1388.06 1509.58 Current Assets Current Investment 13.59 0.00 11.42 14.27 Trade receivables 492.10 544.13 587.66 628.80 Cash and Bank Balances 91.95 152.77 203.68 257.13 Short-terms loans & advances 171.18 168.91 173.30 181.27 Other current assets 11.06 37.19 49.09 56.45 2. Sub Total - Current Assets 779.88 903.00 1025.15 1137.92 Total Assets (1+2) 1901.65 2161.16 2413.21 2647.50
- 5. Annual Profit & Loss Statement for the period of 2014 to 2017E Value(Rs.in.mn) FY14A FY15A FY16E FY17E Description 12m 12m 12m 12m Net Sales 2243.70 2314.00 2508.38 2683.96 Other Income 10.82 21.22 29.28 36.02 Total Income 2254.52 2335.22 2537.66 2719.98 Expenditure -2009.03 -2053.15 -2217.40 -2361.89 Operating Profit 245.49 282.07 320.26 358.09 Interest -39.72 -42.07 -45.44 -49.98 Gross profit 205.77 240.00 274.82 308.12 Depreciation -12.96 -12.96 -13.22 -13.83 Profit Before Tax 192.81 227.04 261.60 294.29 Tax -41.60 -53.30 -64.88 -72.39 Profit After Tax 151.21 173.74 196.72 221.89 Minority Interest 0.00 -6.68 0.00 0.00 Net Profit 151.21 167.06 196.72 221.89 Equity capital 102.35 103.60 103.60 103.60 Reserves 936.70 1003.34 1123.74 1240.61 Face value 10.00 10.00 10.00 10.00 EPS 14.77 16.13 18.99 21.42 Quarterly Profit & Loss Statement for the period of 30th Sept, 2014 to 30th June, 2015E Value(Rs.in.mn) 30-Sep-14 31-Dec-14 31-Mar-15 30-Jun-15E Description 3m 3m 3m 3m Net sales 582.10 570.54 592.27 611.22 Other income 5.22 4.42 9.85 7.68 Total Income 587.32 574.96 602.12 618.91 Expenditure -521.06 -500.69 -515.47 -540.32 Operating profit 66.26 74.27 86.65 78.58 Interest -10.52 -12.72 -10.64 -9.36 Gross profit 55.74 61.55 76.01 69.22 Depreciation -3.39 -3.16 -2.08 -2.46 Profit Before Tax 52.35 58.39 73.93 66.76 Tax -14.99 -12.54 -17.41 -15.55 Profit After Tax 37.36 45.85 56.52 51.20 Minority Interest 0.00 0.00 -6.68 0.00 Net Profit 37.36 45.85 49.84 51.20 Equity capital 103.30 103.60 103.60 103.60 Face value 10.00 10.00 10.00 10.00 EPS 3.62 4.43 4.81 4.94
- 6. Ratio Analysis Particulars FY14A FY15A FY16E FY17E EPS (Rs.) 14.77 16.13 18.99 21.42 EBITDA Margin (%) 10.94% 12.19% 12.77% 13.34% PBT Margin (%) 8.59% 9.81% 10.43% 10.96% PAT Margin (%) 6.74% 7.51% 7.84% 8.27% P/E Ratio (x) 9.81 8.99 7.64 6.77 ROE (%) 14.55% 15.70% 16.03% 16.51% ROCE (%) 19.00% 19.29% 19.41% 19.69% Debt Equity Ratio 0.31 0.38 0.40 0.41 EV/EBITDA (x) 6.92 6.28 5.55 4.96 Book Value (Rs.) 101.52 106.85 118.47 129.75 P/BV 1.43 1.36 1.22 1.12 Charts
- 7. OUTLOOK AND CONCLUSION At the current market price of Rs. 145.00 the stock P/E ratio is at 7.64 x FY16E and 6.77 x FY17E respectively. Earnings per share (EPS) of the company for the earnings for FY16E and FY17E are seen at Rs. 18.99 and Rs. 21.42 respectively. Net Sales and PAT of the company are expected to grow at a CAGR of 14% and 19% over 2014 to 2017E respectively. On the basis of EV/EBITDA, the stock trades at 5.55 x for FY16E and 4.96 x for FY17E. Price to Book Value of the stock is expected to be at 1.22 x and 1.12 x respectively for FY16E and FY17E. We recommend ‘BUY’ in this particular scrip with a target price of Rs. 165.00 for Medium to Long term investment. INDUSTRY OVERVIEW India is the world's largest sourcing destination for the information technology (IT) industry, accounting for approximately 52 per cent of the US$ 124-130 billion market. The industry employs about 10 million Indians and continues to contribute significantly to the social and economic transformation in the country. The Indian IT and ITeS industry is divided into four major segments – IT services, business process management (BPM), software products and engineering services, and hardware. The IT-BPM sector in India grew at a compound annual growth rate (CAGR) of 25 per cent over 2000-2013, which is 3-4 times higher than the global IT-BPM spend, and is estimated to expand at a CAGR of 9.5 per cent to US$ 300 billion by 2020. India has emerged as the fastest growing market for Dell globally and the third largest market in terms of revenue after the US and China, reported by Managing Director, Dell India. Market Size India, the fourth largest base for young businesses in the world and home to 3,000 tech start-ups, is set to increase its base to 11,500 tech start-ups by 2020, as per a report by Nasscom and Zinnov Management Consulting Pvt Ltd. India’s internet economy is expected to touch Rs 10 trillion (US$ 161.26 billion) by 2018, accounting for 5 per cent of the country’s gross domestic product (GDP), according to a report by the Boston Consulting Group (BCG) and Internet and Mobile Association of India (IAMAI). In December 2014, India’s internet user base reached 300 million, the third largest in the world, while the number of social media users and smartphones grew to 100 million.
- 8. Investments Indian IT's core competencies and strengths have placed it on the international canvas, attracting investments from major countries. The computer software and hardware sector in India attracted cumulative foreign direct investment (FDI) inflows worth US$ 13,788.56 million between April 2000 and December 2014, according to data released by the Department of Industrial Policy and Promotion (DIPP). Most large technology companies may have so far focused primarily on bigger enterprises, but a report from market research firm Zinnov highlighted that the small and medium businesses will present a lucrative opportunity worth US$ 11.6 billion in 2015 and US$ 25.8 billion in 2020. Moreover, India has nearly 51 million such businesses of which 12 million have a high degree of technology influence and are looking to adopt newer IT products, as per the report. Some of the major investments in the Indian IT and ITeS sector are as follows: • Wipro has won a US$ 400 million, multi-year IT infrastructure management contract from Swiss engineering giant ABB, making it the largest deal for the technology company. • Tech Mahindra has signed a definitive agreement to acquire Geneva-based SOFGEN Holdings. The acquisition is expected to strengthen Tech Mahindra’s presence in the banking segment. • Tata Consultancy Services (TCS) plans to set up offshore development centres in India for Japanese clients in a bid to boost the company's margin in the market. • Reliance is building a 650,000 square feet (sq ft) data centre in India—its 10th data centre in the country— with a combined capacity of about 1 million sq ft and an overall investment of US$ 200 million. • Intel Corp plans to invest about US$ 62 million in 16 technology companies, working on wearable, data analytics and the Internet of Things (IoT), in 2015 through its investment arm Intel Capital. The Indian IoT industry is expected be worth US$ 15 billion and to connect 28 billion devices to the internet by 2020. • Keiretsu Forum, a global angel investor network, has forayed into India by opening a chapter in Chennai. With this, the Silicon Valley-based network will have 34 chapters across three continents. Government Initiatives The adoption of key technologies across sectors spurred by the 'Digital India Initiative' could help boost India's gross domestic product (GDP) by US$ 550 billion to US$ 1 trillion by 2025, as per research firm McKinsey. Some of the major initiatives taken by the government to promote IT and ITeS sector in India are as follows:
- 9. India and the United States (US) have agreed to jointly explore opportunities for collaboration on implementing India's ambitious Rs 1.13 trillion (US$ 18.22 billion) ‘Digital India Initiative’. The two sides also agreed to hold the US-India Information and Communication Technology (ICT) Working Group in India later this year. India and Japan held a Joint Working Group conference for Comprehensive Cooperation Framework for ICT. India also offered Japan to manufacture ICT equipment in India. The Government of Telangana began construction of a technology incubator in Hyderabad—dubbed T-Hub— to reposition the city as a technology destination. The state government is initially investing Rs 35 crore (US$ 5.64 million) to set up a 60,000 sq ft space, labelled the largest start-up incubator in the county, at the campus of International Institute of Information Technology-Hyderabad (IIIT-H). Once completed, the project is proposed to be the world’s biggest start-up incubator housing 1,000 start-ups. Bengaluru has received US$ 2.6 billion in venture capital (VC) investments in 2014, making it the fifth largest recipient globally during the year, an indication of the growing vibrancy of its startup ecosystem. Among countries, India received the third highest VC funding worth US$ 4.6 billion. Road Ahead Internet should be a basic human right, say 87 per cent of internet users in India, compared with 83 per cent globally, according to a report by Centre for International Governance Innovation (CIGI). India continues to be the topmost offshoring destination for IT companies followed by China and Malaysia in second and third position, respectively. Emerging technologies present an entire new gamut of opportunities for IT firms in India. Social, mobility, analytics and cloud (SMAC) collectively provide a US$ 1 trillion opportunity. Cloud represents the largest opportunity under SMAC, increasing at a CAGR of approximately 30 per cent to around US$ 650-700 billion by 2020. Social media is the second most lucrative segment for IT firms, offering a US$ 250 billion market opportunity by 2020. Disclaimer: This document is prepared by our research analysts and it does not constitute an offer or solicitation for the purchase or sale of any financial instrument or as an official confirmation of any transaction. The information contained herein is from publicly available data or other sources believed to be reliable but we do not represent that it is accurate or complete and it should not be relied on as such. Firstcall Research or any of its affiliates shall not be in any way responsible for any loss or damage that may arise to any person from any inadvertent error in the information contained in this report. Firstcall Research and/ or its affiliates and/or employees will not be liable for the recipients’ investment decision based on this document.
- 10. Firstcall India Equity Research: Email – info@firstobjectindia.com C.V.S.L.Kameswari Pharma & Diversified U. Janaki Rao Capital Goods B. Anil Kumar Auto, IT & FMCG M. Vinayak Rao Diversified G. Amarender Diversified Firstcall Research Provides Industry Research on all the Sectors and Equity Research on Major Companies forming part of Listed and Unlisted Segments For Further Details Contact: Tel.: 022-2527 2510/2527 6077 / 25276089 Telefax: 022-25276089 040-20000235 /20000233 E-mail: info@firstobjectindia.com www.firstcallresearch.com