Weekly momentum stock pick: Sell BHEL - HDFC Sec
•
1 recomendación•257 vistas

Attached weekly timeframe chart of this capital goods major BHEL is signaling a weak technical setup, as the stock price is currently moving down in the bearish sequence of lower tops and bottoms. Sell between Rs205-Rs209.

Recomendados
Recomendados
Más contenido relacionado
Más de IndiaNotes.com
Más de IndiaNotes.com (20)
Último
Último (20)
Weekly momentum stock pick: Sell BHEL - HDFC Sec
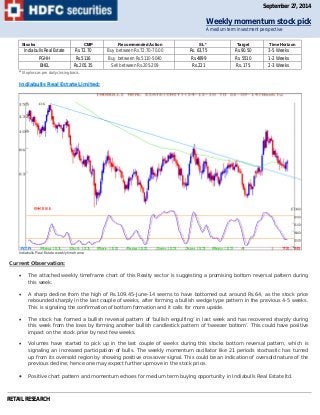
- 1. September 27, 2014 Stocks CMP Recommended Action SL* Target Time Horizon Indiabulls Real Estate Rs.72.70 Buy between Rs.72.70-70.00 Rs. 63.75 Rs.90.50 3-5 Weeks PGHH Rs.5116 Buy between Rs.5110-5040 Rs.4899 Rs. 5510 1-2 Weeks BHEL Rs.205.35 Sell between Rs.205-209 Rs.221 Rs. 175 2-3 Weeks * Stoploss as per daily closing basis. Indiabulls Real Estate Limited: Indiabulls Real Estate weekly timeframe Current Observation: The attached weekly timeframe chart of this Realty sector is suggesting a promising bottom reversal pattern during this week. A sharp decline from the high of Rs.109.45-June-14 seems to have bottomed out around Rs.64, as the stock price rebounded sharply in the last couple of weeks, after forming a bullish wedge type pattern in the previous 4-5 weeks. This is signaling the confirmation of bottom formation and it calls for more upside. The stock has formed a bullish reversal pattern of ‘bullish engulfing’ in last week and has recovered sharply during this week from the lows by forming another bullish candlestick pattern of ‘tweezer bottom’. This could have positive impact on the stock price by next few weeks. Volumes have started to pick up in the last couple of weeks during this stocks bottom reversal pattern, which is signaling an increased participation of bulls. The weekly momentum oscillator like 21 periods stochastic has turned up from its oversold region by showing positive crossover signal. This could be an indication of oversold nature of the previous decline; hence one may expect further upmove in the stock price. Positive chart pattern and momentum echoes for medium term buying opportunity in Indiabulls Real Estate ltd. RETAIL RESEARCH Weekly momentum stock pick A medium term investment perspective
- 2. Procter & Gamble Hygiene and Health Care Limited (PGHH): PGHH weekly timeframe Current Observation: We observe an excellent upmove in PGHH (Procter & Gamble Hygiene and Health Care Limited-PGHH) as per weekly timeframe chart, as the stock prices have moved up in the bullish sequence of higher tops and bottoms. This suggests strength of an uptrend as per Dow’s theory. The uptrend of PGHH of the last 5-6 months consists of large bullish real bodies during its upmove and smaller bearish bodies during the corrections. This is a demonstration of strength of bulls to take prices to new highs. After shifting into correction in the last 3-4 weeks, the stock prices have reacted sharply this week forming a possible bottom reversal pattern around Rs.4820 levels. Weekly momentum oscillator like RSI has dipped near to the key upper levels of 60 and has turned up subsequently signaling that the upside momentum is gaining strength. Overall chart pattern is suggesting one to go for fresh buying opportunity in PGHH as per levels mentioned in the table. RETAIL RESEARCH
- 3. Bharat Heavy Electricals Limited (BHEL): BHEL weekly timeframe Current Observation: Attached weekly timeframe chart of this capital goods major BHEL is signaling a weak technical setup, as the stock price is currently moving down in the bearish sequence of lower tops and bottoms. This week saw the stock price break below the cluster of supports of ascending trend line (brown line, which is connected from the bottom of Rs.100-later part of Aug 13) around Rs.223 and valuation support of around Rs.210 (blue horizontal line). This is going to have a negative impact on the price trend and any bounce back from here could be short lived (it signals sell on rallies). Another crucial intermediate support of 40 week EMA-green curvy line (equal to 200day EMA) has been broken down marginally during this week around Rs.210 levels (this moving average has offered decent moves post its strong supports and resistances over the last 2-3 years). Weekly momentum oscillator like MACD indicator is currently showing negative signal (MACD line is moving below its signal line) around the upper region indicating that the downside momentum is gathering strength. Negative technical chart setup with break of cluster support is signaling for fresh selling opportunity in BHEL. RETAIL RESEARCH
- 4. RETAIL RESEARCH Analyst: Nagaraj Shetti RETAIL RESEARCH Tel: (022) 3075 3400 Fax: (022) 2496 5066 Corporate Office HDFC securities Limited, I Think Techno Campus, Building - B, "Alpha", Office Floor 8, Near Kanjurmarg Station, Opp. Crompton Greaves, Kanjurmarg (East), Mumbai 400 042 Phone: (022) 3075 3400 Fax: (022) 2496 5066 Website: www.hdfcsec.com Email: hdfcsecretailresearch@hdfcsec.com Disclaimer: This document has been prepared by HDFC Securities Limited and is meant for sole use by the recipient and not for circulation. This document is not to be reported or copied or made available to others. It should not be considered to be taken as an offer to sell or a solicitation to buy any security. The information contained herein is from sources believed reliable. We do not represent that it is accurate or complete and it should not be relied upon as such. We may have from time to time positions or options on, and buy and sell securities referred to herein. We may from time to time solicit from, or perform investment banking, or other services for, any company mentioned in this document. This report is intended for non-Institutional Clients