Más contenido relacionado Similar a SBI & ICICI Comparative Study on FPA.pdf (20) 1. Pooja Sharma al. International Journal of Research Aspects of Engineering and Management
ISSN: 2348-6627, Vol. 1, Issue 1, FEB 2014, pp. 20-24
© 2014 IJRAEM All Rights Reserved 20
Financial Performance of ICICI Bank and SBI bank:
A Comparative Analysis
Pooja Sharma1
, Hemlata2
1,2
Assistant Professor, Dept of MBA, E-max Group of Institutions Ambala
Abstract— The banking sector mirrors the larger economy – its linkages to all sectors make it a proxy for what is
happening in the economy as a whole. Efficient functioning of banking sector is required for the growth of overall
economy. Banking plays a silent, yet crucial role in our day-to-day lives. The banks work as financial intermediaries,
pooling savings and channelizing them into investment, helps in economic development of a country. The banking
system of India is featured by a large network of bank branches, serving much kind of financial needs of the people.
ICICI Bank has a network of 3350 branches and 10486 ATM’s in India, and has a presence in 19 countries. ICICI
bank is one of the Big Four banks of India, along with State Bank of India, Punjab National Bank and Canara Bank.
The State Bank of India, popularly known as SBI is one of the leading banks in India. The State Bank Group, with
over 16,000 branches provides a wide range of banking products through its vast network of branches in India and
overseas, including products aimed at Non-Resident Indians (NRIs). Headquarter of SBI is at Mumbai. SBI has 14
Local Head Offices and 57 Zonal Offices that are located at important cities throughout the country. In the present
study, an attempt has been made to evaluate and compare the financial performance of SBI and ICICI Bank by
comparing various ratios like Return on Equity, Cash Deposit Ratio and Credit Deposit Ratio. The data is taken from
financial reports of both the banks for last five years ranging from 2008-09 to 2013-13. The results depicts that ICICI
bank is performing better than SBI bank as it is able to generate more loans from its deposits to the customers.
Keywords—ICICI Bank, SBI Bank, Financial Performance
I. INTRODUCTION
The banking sector mirrors the larger economy – its linkages
to all sectors make it a proxy for what is happening in the
economy as a whole. Efficient functioning of banking sector
is required for the growth of overall economy. Banking plays
a silent, yet crucial role in our day-to-day lives. The banks
work as financial intermediaries, pooling savings and
channelizing them into investment, helps in economic
development of a country. A banking system also referred as
a system provided by the bank which offers cash
management services for customers, reporting the
transactions of their accounts and portfolios, throughout the
day. The banking system in India should not only be hassle
free but it should be able to meet the new challenges posed
by the technology and any other external factors. For the past
three decades, India’s banking system has several
outstanding achievements to its credit. The banks are the
main participants of the financial system in India. The
banking sector offers several facilities and opportunities to
their customers. All the banks safeguard the money and
valuables and provide loans, credit, and payments services,
such as checking accounts, money orders, and cashier’s
cheques. The banks also offer investment and insurance
products. As a variety of models for cooperation and
integration among finance industries have emerged, some of
the traditional distinctions between banks, insurance
companies, and securities firms have diminished. In spite of
these changes, banks continue to maintain and perform their
primary role- accepting deposits and lending funds from
these deposits. The efficient working of banking system
leads to survival of any country. The banking system of
India is featured by a large network of bank branches,
serving many kinds of financial needs of the people.
II. ICICI BANK PROFILE:
ICICI Bank is an Indian multinational bank and financial
services company headquartered in Mumbai. Based on 2013
information, it is second largest bank in India by assets and
third largest by market capitalisation. It offers a wide range
of banking products and financial services to corporate and
retail customers through a variety of delivery channels and
through its specialised subsidiaries in the areas of investment
banking, life and non life insurance, venture capital and asset
management. The Bank has a network of 3,350 branches and
10,486 ATM’s in India, and has a presence in 19 countries.
ICICI Bank is one of the Big Four banks of India, along
with State Bank of India, Punjab National Bank and Canara
Bank.
ICICI Bank was established by the Industrial Credit and
Investment Corporation of India, an Indian financial
institution, as a wholly owned subsidiary in 1954. The parent
company was formed in 1955 as a joint venture of the World
Bank, India’s public sector banks and public sector insurance
companies to provide project financing to India industry.
The bank was initially known as Industrial Credit and
Investment Corporation of India Bank, before it’s changed
its name to the abbreviated ICICI Bank. The parent company
was later merged with the bank. ICICI Bank launched
internet banking operations in 1998. In 2000, ICICI Bank
became the first Indian bank to list on the New York Stock
Exchange with its five million American depository shares
issue generating a demand book 13 times the offer size.
III. SBI BANK PROFILE:
The State Bank of India, popularly known as SBI is one of
the leading banks in India. The State Bank Group, with over
16,000 branches provides a wide range of banking products
2. Pooja Sharma al. International Journal of Research Aspects of Engineering and Management
ISSN: 2348-6627, Vol. 1, Issue 1, FEB 2014, pp. 20-24
© 2014 IJRAEM All Rights Reserved 21
through its vast network of branches in India and overseas,
including products aimed at Non-Resident Indians (NRIs).
Headquarter of SBI is at Mumbai. SBI has 14 Local Head
Offices and 57 Zonal Offices that are located at important
cities throughout the country. It also has around 130
branches out of the country. The State Bank of India was
constituted on 1st July 1955, pursuant to the State Bank of
India Act, 1955 (the "SBI Act") for the purpose of creating a
state-partnered and state-sponsored bank integrating the
former Imperial Bank of India. In 1959, the State Bank of
India (Subsidiary Banks) Act was passed, enabling the Bank
to take over eight former state associated banks as its
subsidiaries.
IV. OBJECTIVE OF THE STUDY
To compare the financial performance of SBI and ICICI
Bank.
V. RESEARCH METHODOLOGY
Financial analysis is mainly done to compare the growth,
profitability and financial soundness of the respective bank
by diagnosing the information contained in the financial
statements. Financial analysis is done to identify the
financial strengths and weaknesses of the two banks by
properly establishing relationship between the items of
Balance Sheet and Profit & Loss Account. It helps in better
understanding of banks financial position, growth and
performance by analyzing the financial statements with
various tools and evaluating the relationship between various
elements of financial statements.
Sample Size
In the present study, an attempt has been made to evaluate
and compare the financial performance of SBI and ICICI
Bank.
Data collection
The study is based on secondary data that has been collected
from annual reports of the respective banks. The study
covers the period of 5 years i.e. from year 2008-09 to year
2012-13.
Data analysis
Ratio Analysis was applied to analyze and compare the
trends in banking business and financial performance.
Various ratios used are:
1. Credit Deposit Ratio
2. Operating Expenses / Total Funds
3. Net Profit / Total funds
4. Cash Deposit Ratio
5. Return On Equity
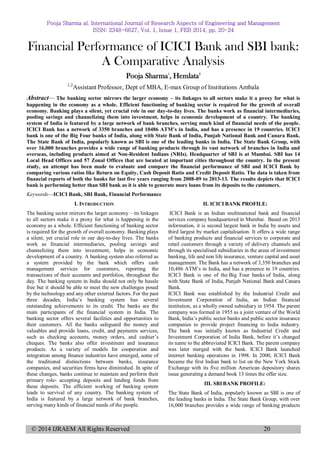
CREDIT DEPOSIT RATIO: - Credit-Deposit Ratio is the
proportion of loan-assets created by a bank from the deposits
received. Credits are the loans and advances granted by the
bank. In other words it is the amount lent by the bank to a
person or an organization which is recovered later on.
Interest is charged from the borrower. Deposit is the amount
accepted by bank from the savers and interest if paid to
them.
Table 1.1
(In %)
Year SBI ICICI
2008-09 74.97 95.93
2009-10 75.96 95.04
2010-11 79.9 92.97
2011-12 82.14 97.71
2012-13 85.17 99.25
Fig 1.1
Table 1.1 depicts that over the course of five financial
periods of study the Credit Deposit Ration in ICICI was
higher (99.25%) than in SBI (85.17%) in 2012-13. In both
SBI and ICICI the credit deposit ratio was highest in 2012-
13. This shows that ICICI bank has created more loan assets
from its deposits as compared to SBI.
OPERATING FUNDS TO TOTAL FUNDS: A measure
of what it costs an investment company to operate funds. An
expense ratio is determined through an annual calculation,
where funds operating expenses are divided by the average
dollar value of its assets under management. Marketing
expenses are taken out of funds’ assets and lower the return
to a fund’s investors.
Table 1.2
(In %)
3. Pooja Sharma al. International Journal of Research Aspects of Engineering and Management
ISSN: 2348-6627, Vol. 1, Issue 1, FEB 2014, pp. 20-24
© 2014 IJRAEM All Rights Reserved 22
Fig 1.2
The table 1.2 reveals that the ratio of operating funds to total
funds of ICICI was varied from 1.94 per cent to 1.76percent.
It was at 1.58 percent in 2009-10, lowest among five years
again it increased to1.72 percent in 2010-11. But the
operating funds ratio in case of SBI has increased over the
five years. It was at its lowest in 2008-09(1.86%), after that
it has shown almost increment in operating funds.
NET PROFIT TO TOTAL FUNDS: A ratio that measures
a company’s ability to generate profits from its funds. The
ratio is considered an indicator of how effectively a company
is using its assets to generate earnings before contractual
obligations must be paid.
Table 1.3
(In %)
Year SBI ICICI
2008-09 1.08 0.96
2009-10 0.91 1.08
2010-11 0.73 1.34
2011-12 0.91 1.44
2012-13 0.97 1.62
Fig 1.3
The table reveals that the ratio of net profits to total funds of
ICICI was varied from 0.96 per cent to 1.62 percent. It
increased to1.62 percent from 0.96 percent in 2008-09. But
the net profit in case of SBI has decreased to 0.73 percent in
2010-11 from 1.08 percent in 2008-09; it further increases to
0.97 percent in 2012-13. However, the net profit margin was
higher in ICICI (1.62%) as compared to SBI (0.97%) during
the period of study. Thus, the ICICI has shown
comparatively lower operational expenses than SBI.
CASH DEPOSIT RATIO: The amount of money a bank
should have available as a percentage of the total amount of
money its customers have paid into the bank. This amount is
calculated so that customers can be sure that they will be
able to take their money out of the bank if they want to.
(In %)
Table 1.4
Year SBI ICICI
2008-09 8.37 10.14
2009-10 7.56 10.72
2010-11 8.96 11.32
2011-12 7.51 8.6
2012-13 5.34 7.21
Year SBI ICICI
2008-09 1.86 1.94
2009-10 2.01 1.58
2010-11 2.02 1.72
2011-12 2.03 1.75
2012-13 2.02 1.76
4. Pooja Sharma al. International Journal of Research Aspects of Engineering and Management
ISSN: 2348-6627, Vol. 1, Issue 1, FEB 2014, pp. 20-24
© 2014 IJRAEM All Rights Reserved 23
Fig 1.4
The table 1.4 depicts that the Cash Deposit Ratio in ICICI
and SBI was highest in 2010-11. In both SBI & ICICI the
cash deposit ratio has decreased in period 2011-13. It is an
indicator to customers whether they will be able to get back
their cash whenever required or not.
RETURN ON EQUITY: The ability of the firm's
management to realize an adequate return on the capital
invested by the owners of the firm. Tendency is to look
increasingly to this ratio as a final criterion of profitability.
Table 1.5
(In %)
Year SBI ICICI
2008-09 17.05 7.83
2009-10 14.8 7.96
2010-11 12.62 9.65
2011-12 15.72 11.2
2012-13 15.43 13.1
Fig 1.5
The table 1.5 depicts that return on equity in SBI bank has
decreased to 12.62% in year 2010-11 from 17.05% in 2008-
09 while in ICICI bank ROE has continuously increased in
last five years ranges from 7.83% to 13.1%. In SBI bank
ROE shows a growth sign in the years 2011-13 but its
slower in comparison to ICICI bank’s ROE. Hence it depicts
that ICICI bank has been successful in generating returns on
the shareholders’ capital more than SBI bank.
VI. FINDINGS AND CONCLUSIONS
Results reveal that over the course of five financial periods
of the study the Credit Deposit Ratio in ICICI was higher
(99.25%) than in SBI (85.17%) in 2012-13. This shows that
ICICI Bank has created more loan assets from its deposits as
compared to SBI. It is also revealed that the ratio of
operating funds to the total funds of ICICI was varied from
1.94 percent to 1.76 percent. It was 1.58 percent in 2009-10;
lowest among five years again it increased to 1.72 percent in
2010-11. But the operating funds ratio in case of SBI has
increased over the five years. It was at its lowest in 2008-09
(1.86%), after that it has shown almost increment in
operating funds. The ratio of net profits to total funds of
ICICI was varied from 0.96 percent to 1.62 percent. It
increased to 1.62 percent from 0.96 percent in 2008-09. But
the net profit in case of SBI has decreased to 0.73 percent in
2010-11 from 1.08 percent in 2008-09; it further increases to
0.97 percent in 2012-13. However, the net profit margin was
higher in ICICI (1.62%) as compared to SBI (0.97%) during
the period of study. Thus, the ICICI has shown
comparatively lower operational expenses than SBI. The
Cash Deposit Ratio in ICICI and SBI was highest in 2010-
11. In both SBI & ICICI the cash deposit ratio has decreased
in period 2011-13. Return on Equity in SBI bank has
decreased to 12.62% in year 2010-11 from 17.05% in 2008-
09 while in ICICI bank ROE has continuously increased in
last five years ranges from 7.83% to 13.1%. In SBI bank
ROE shows a growth sign in the years 2011-13 but it’s
slower in comparison to ICICI bank’s ROE. Hence it depicts
that ICICI bank has been successful in generating returns on
the shareholders’ capital more than SBI bank. Hence, on the
basis of the above study or analysis ICICI bank is
performing well in comparison to SBI.
VII. LIMITATIONS OF THE STUDY
Due to constraints of time and resources, the study is likely
to suffer from certain limitations. Some of these are
mentioned here under so that the findings of the study may
be understood in a proper prospective.
The limitations of the study are:
The study is based on the secondary data and the
limitation of using secondary data may affect the
results.
The secondary data was taken from the annual
reports of SBI and ICICI Bank. It may be possible
that the data shown in the annual reports may be
window dressed which does not show the actual
position of banks.
5. Pooja Sharma al. International Journal of Research Aspects of Engineering and Management
ISSN: 2348-6627, Vol. 1, Issue 1, FEB 2014, pp. 20-24
© 2014 IJRAEM All Rights Reserved 24
REFERENCES:-
[1]. Development Research Group Study, No. 22,
Department of Economic Analysis and Policy,
Reserve Bank of India, Mumbai September 20,
2000.
[2]. Financial year report of ICICI Bank 2008-09 to
2012-13.
[3]. Financial year report of SBI 2008-09 to 2012-13.
[4]. Gaylord A Freeman, ― The Problem of Adequate
bank Capital‖, quoted by Howard D. Crosse in his
book on Management Policies for Commercial
Banks, pp. 158.
[5]. http://www.capitaline.com/user/framepage.asp?id=
1 (Sept, 2013)
[6]. http://www.moneycontrol.com/stocks/company_inf
o/print_main.php (Sept, 2013)
[7]. ICICI Bank bulletin publication 2013
[8]. Maheshwari&Maheshwari, Banking Law and
Practices, Himalaya Publishing Pvt Ltd, Allahabad,
pp.152.
[9]. RBI statistical table relating to banks 2012-13
[10]. SBI bulletin publication 2013.