Javier Garcia - Verdugo Sanchez - Six Sigma Training - W4 Taguchi Robust Designs
•
3 recomendaciones•1,521 vistas

Javier Garcia - Verdugo Sanchez Six Sigma Training. Week 4. Taguchi Robust Designs.

Recomendados
Recomendados
Más contenido relacionado
La actualidad más candente
La actualidad más candente (20)
Destacado
Destacado (13)
Similar a Javier Garcia - Verdugo Sanchez - Six Sigma Training - W4 Taguchi Robust Designs
Similar a Javier Garcia - Verdugo Sanchez - Six Sigma Training - W4 Taguchi Robust Designs (20)
Más de J. García - Verdugo
Más de J. García - Verdugo (20)
Último
Último (20)
Javier Garcia - Verdugo Sanchez - Six Sigma Training - W4 Taguchi Robust Designs
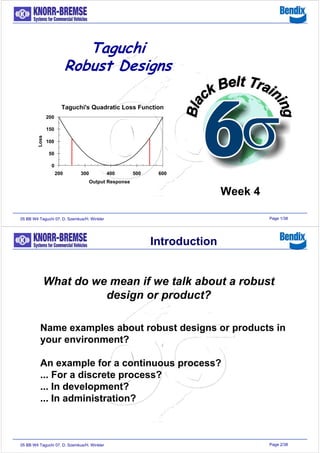
- 1. Page 1/3805 BB W4 Taguchi 07, D. Szemkus/H. Winkler Taguchi Robust Designs Taguchi's Quadratic Loss Function 0 50 100 150 200 200 300 400 500 600 Output Response Loss Week 4 Page 2/3805 BB W4 Taguchi 07, D. Szemkus/H. Winkler What do we mean if we talk about a robust design or product? Name examples about robust designs or products in your environment? An example for a continuous process? ... For a discrete process? ... In development? ... In administration? Introduction
- 2. Page 3/3805 BB W4 Taguchi 07, D. Szemkus/H. Winkler Goals of the Module • Understanding of the principle of robust designs within product and process development • Understanding of the Taguchi method - application of a DOE to investigate robustness • Creation and analysis of experiments to investigate factors which have the most influence on a product / process design or variation • Evaluation of interactions in order to make a process robust Page 4/3805 BB W4 Taguchi 07, D. Szemkus/H. Winkler Early 1980 Prof. Genechi Taguchi applied the statistical design of experiment: − to design products or processes which are robust against noise factors like raw materials, employees, environment… − to minimize variation around a target value The key is the reduction of the variation Taguchi Method
- 3. Page 5/3805 BB W4 Taguchi 07, D. Szemkus/H. Winkler The Concept of the Loss Function - Taguchi Quality can be presented as a deviation form target value or the nominal value due to the following equation: L(y) = k(y-T)2 Taguchi's Quadratic Loss Function 0 50 100 150 200 200 300 400 500 600 Output Response Loss Page 6/3805 BB W4 Taguchi 07, D. Szemkus/H. Winkler Name an example of such a loss function in your area! Why increases the manufacturing costs in your example at a deviation form the target or a nominal value? The Concept of the Loss Function - Taguchi
- 4. Page 7/3805 BB W4 Taguchi 07, D. Szemkus/H. Winkler Taguchi Philosophy Products shall be robust against variation due to external causes In order to achieve robustness we can apply the DOE technique as a product development tool Processes „ON-TARGET“ are more important than the fulfillment of specification limits Page 8/3805 BB W4 Taguchi 07, D. Szemkus/H. Winkler Taguchi Concept • System Design – Research and development does define the settings for a process / product • Parameter Design – The accurate settings of the process / product parameter (nominal-value) will be defined • Tolerance Design – The acceptable variation range for process / product parameter (nominal-value) will be defined • Controllable Parameter (controllable variables, Inner Array) and uncontrollable parameter (noise variables, Outer Array) will be defined
- 5. Page 9/3805 BB W4 Taguchi 07, D. Szemkus/H. Winkler Parameter Design We differentiate between four controllable parameter / factors Factors which influences the mean and the standard deviation Factors which influences the mean only Factors which influences the standard deviation only Factor which influences neither the mean and/or the standard deviation Page 10/3805 BB W4 Taguchi 07, D. Szemkus/H. Winkler Factors which Influences the Mean and σ 600500400300200 40000 30000 20000 10000 0 Factor Response Why is the variation at a higher factor level of the output lower than at a low factor level? Do we expect the same effect if we have a linear relation?
- 6. Page 11/3805 BB W4 Taguchi 07, D. Szemkus/H. Winkler Factors which Influences the Mean Only 600500400300200 Factor Response What is variation of the outputs in relation to the factor level in this case? Page 12/3805 BB W4 Taguchi 07, D. Szemkus/H. Winkler We look for an interaction of a factor (e.g. product type) with the noise variable of the customer application. Which product type is more robust against changes of the noise variable? 600500400300200 Noise variable Response Product Type 1 Product Type 2 Factors which Influences the σ Only
- 7. Page 13/3805 BB W4 Taguchi 07, D. Szemkus/H. Winkler Factors which Influences the σ Only 600500400300200 Noise variables Response changeable factors Page 14/3805 BB W4 Taguchi 07, D. Szemkus/H. Winkler We Use the Interaction 600500400300200 Setting of variable A to a minimal variation Variation due to variable B We look for an interaction of a controllable variable (e.g. temperature) with a noise variable (e.g. impurity of the raw material) of our process.
- 8. Page 15/3805 BB W4 Taguchi 07, D. Szemkus/H. Winkler Taguchi uses the concept of the Inner / Outer Arrays to investigate the effects of the controllable variables (inner array variables) on the output of the process in dependency of the uncontrolled noise variables (outer array variables). The uncontrolled variables or noise variables can be related to the customer process, the supplier process (raw material conditions) or subsequent steps in our own processes. What could be Taguchi’s reasons to develop this kind of concept? What advantages but also disadvantages has this approach? The concept of Inner and Outer Arrays Page 16/3805 BB W4 Taguchi 07, D. Szemkus/H. Winkler Taguchi Design in Minitab Stat >DOE >Taguchi >Create Taguchi Design … Stat >DOE >Taguchi >Create Taguchi Design … Start with the definition of the controllable factors.
- 9. Page 17/3805 BB W4 Taguchi 07, D. Szemkus/H. Winkler Taguchi Design in Minitab Comparison of a factorial and a Taguchi design With 3 factors and 2 levels, the Taguchi design is slightly different than the standard design. The orthogonal character sustains. Same experiments with a changed order. A factorial design can be extended with the Taguchi idea. A B C StdOrder Taguchi Order -1 -1 -1 1 1 1 -1 -1 2 5 -1 1 -1 3 3 1 1 -1 4 7 -1 -1 1 5 2 1 -1 1 6 6 -1 1 1 7 4 1 1 1 8 8 2k factorial Design A B C Taguchi Order StdOrder 1 1 1 1 1 1 1 2 5 2 1 2 1 3 3 1 2 2 7 4 2 1 1 2 5 2 1 2 6 6 2 2 1 4 7 2 2 2 8 8 Taguchi Design Page 18/3805 BB W4 Taguchi 07, D. Szemkus/H. Winkler A B C 1 1 1 1 2 2 1 3 3 2 1 2 2 2 3 2 3 1 3 1 3 3 2 1 3 3 2 Taguchi Design in Minitab A B C 1 1 1 1 1 1 1 1 1 1 2 2 1 2 2 1 2 2 1 3 3 1 3 3 1 3 3 2 1 2 2 1 2 2 1 2 2 2 3 2 2 3 2 2 3 2 3 1 2 3 1 2 3 1 3 1 3 3 1 3 3 1 3 3 2 1 3 2 1 3 2 1 3 3 2 3 3 2 3 3 2 Taguchi designs with 3 factors and 3 level results in 9 or 27 experiments With 9 runs the design has an fractional factorial character, with 27 runs it corresponds to a full factorial design.
- 10. Page 19/3805 BB W4 Taguchi 07, D. Szemkus/H. Winkler 1 1 2 2 A 1 2 1 2 B A B C Y 1 Y 2 Y 3 Y 4 1 1 1 1 1 2 2 2 1 2 2 2 1 2 1 1 2 2 2 1 1 2 1 2 Inner Array Outer Array The concept of Inner and Outer Arrays In this example we will run the experiments under 4 predefined condition. The inner and the outer array have a full factorial character. The inner and as well the outer array can be included in a fractional factorial design. The noise factors have to be added manually. In the easiest way the runs will be just repeated. You will receive more information if the noise factors will be investigated over their adjustment range. Page 20/3805 BB W4 Taguchi 07, D. Szemkus/H. Winkler ⎟ ⎟ ⎟ ⎠ ⎞ ⎜ ⎜ ⎜ ⎝ ⎛ Σ∗−= n YSN 2 1 log10 ⎟ ⎟ ⎠ ⎞ ⎜ ⎜ ⎝ ⎛ Σ∗−= n Y SN 2 log10 Signal to Noise Ratio In the evaluation of a Taguchi design the variation receives a special emphasis due to the calculation of the Signal to Noise Ratio . ⎟ ⎟ ⎠ ⎞ ⎜ ⎜ ⎝ ⎛ ∗= 2 2 log10 s Y SN Nominal is best Target the response and you want to base the S/N ratio on means and standard deviations. For advanced factorial designs you can calculate the SN ration manually and therefore useful for others design as well. The calculation of the Signal to Noise Ratio Larger is better Maximize the response Smaller is better Minimize the response
- 11. Page 21/3805 BB W4 Taguchi 07, D. Szemkus/H. Winkler Example: Ceramic furnace Problem: Differences in the size after baking process of ceramic Datei: Ceramic Taguchi.mtw The design includes 7 factors with 2 levels. The noise factor is the position in the furnace. The ceramic size has been measured at 5 position after the treatment. A B C D E F G P 1 P 2 P 3 P 4 P 5 old A 1 0 1200 43 0 168,30 167,20 166,43 165,00 164,45 old A 1 4 1300 53 5 169,95 168,63 166,98 165,44 164,56 old B 5 0 1200 53 5 172,15 167,31 165,33 163,35 158,73 old B 5 4 1300 43 0 166,65 165,88 165,66 165,22 164,67 new A 5 0 1300 43 5 167,42 166,43 166,21 165,66 165,00 new A 5 4 1200 53 0 168,41 166,98 166,98 166,54 165,66 new B 1 0 1300 53 0 166,65 165,88 165,00 164,34 164,01 new B 1 4 1200 43 5 167,09 166,54 165,44 165,22 164,56 Level 1 Level 2 A Material A old new B Quality Additive B A B C Portion % Additive B 5 1 D Recl.-Portion %. 0 4 E Filling Quantity kg 1300 1200 F Portion % Material C 43 53 G Portion % Material D 0 5 Factor Page 22/3805 BB W4 Taguchi 07, D. Szemkus/H. Winkler Stat >DOE >Taguchi >Analyze Taguchi Design … Stat >DOE >Taguchi >Analyze Taguchi Design … Example: Ceramic furnace Terms Analysis Graphs
- 12. Page 23/3805 BB W4 Taguchi 07, D. Szemkus/H. Winkler The mean differences are rated in the Session Window. There are almost no differences of SN Ratio for the factors B and C. The factor B is most capable to shift the mean. Taguchi Analysis: P 1; P 2; P 3; P 4; P 5 versus A; B; C; D; E; F; G Response Table for Signal to Noise Ratios Nominal is best (10*Log(Ybar**2/s**2)) Level A B C D E F G 1 38,87 41,95 41,44 39,96 39,90 44,23 43,89 2 44,39 41,31 41,82 43,30 43,36 39,03 39,37 Delta 5,52 0,64 0,37 3,34 3,46 5,20 4,52 Rank 1 6 7 5 4 2 3 Response Table for Means Level A B C D E F G 1 166,1 166,6 166,1 165,7 166,1 166,0 166,0 2 166,0 165,5 166,0 166,4 166,0 166,1 166,1 Delta 0,1 1,1 0,1 0,6 0,1 0,2 0,1 Rank 5 1 6,5 2 6,5 3 4 Example: Ceramic furnace Page 24/3805 BB W4 Taguchi 07, D. Szemkus/H. Winkler SN Ratio: Maximization it means variation reduction MeanofMeans neualt 166,5 166,0 165,5 BA 51 40 166,5 166,0 165,5 13001200 5343 50 166,5 166,0 165,5 A B C D E F G Main Effects Plot (data means) for Means MeanofSNratios neualt 44 42 40 BA 51 40 44 42 40 13001200 5343 50 44 42 40 A B C D E F G Main Effects Plot (data means) for SN ratios Signal-to-noise: Nominal is best (10*Log(Ybar**2/s**2)) Example: Ceramic furnace
- 13. Page 25/3805 BB W4 Taguchi 07, D. Szemkus/H. Winkler MeanofMeans neualt 166,5 166,0 165,5 BA 51 40 166,5 166,0 165,5 13001200 5343 50 166,5 166,0 165,5 A B C D E F G Main Effects Plot (data means) for Means MeanofStandardDeviations neualt 2,0 1,5 1,0 BA 51 40 2,0 1,5 1,0 13001200 5343 50 2,0 1,5 1,0 A B C D E F G Main Effects Plot (data means) for Standard Deviations SN Ratio: Maximization it means variation reduction Example: Ceramic furnace Page 26/3805 BB W4 Taguchi 07, D. Szemkus/H. Winkler Example: Cake Study • Goal: A cake with a good taste • Output: Taste scale (the higher the better) • Controllable inputs ( Inner Array): – Flour (low, recommended, high) – Butter (low, recommended, high) – Eggs (low, recommended, high) • Uncontrollable inputs ( Outer Array): – Backing temp (Low, recommended, high) – Backing time (Low, recommended, high)
- 14. Page 27/3805 BB W4 Taguchi 07, D. Szemkus/H. Winkler Example: Cake Study 0 -1 1 -1 1 Temp 0 -1 -1 1 1 time Flour Butter Egg T0 t0 T-1 t-1 T+1 t-1 T-1 t+1 T+1 t+1 0 0 0 6,7 3,4 5,4 4,1 3,8 -1 -1 -1 3,1 1,1 5,7 6,4 1,3 1 -1 -1 3,2 3,8 4,9 4,3 1,3 -1 1 -1 5,3 3,7 5,1 6,7 2,9 1 1 -1 4,1 4,5 6,4 5,8 5,2 -1 -1 1 5,9 4,2 6,8 6,5 3,5 1 -1 1 6,9 5 6 5,9 5,7 -1 1 1 3 3,1 6,3 6,4 3 1 1 1 4,5 3,9 5,5 5 5,4 Kontrollierbare Faktoren Inner Array Störfaktoren (Noise) Outer Array CAKE.MTWCAKE.MTW Page 28/3805 BB W4 Taguchi 07, D. Szemkus/H. Winkler Example: Cake Study 0 -1 1 -1 1 Temp 0 -1 -1 1 1 time Flour Butter Egg T0 t0 T-1 t-1 T+1 t-1 T-1 t+1 T+1 t+1 0 0 0 6,7 3,4 5,4 4,1 3,8 -1 -1 -1 3,1 1,1 5,7 6,4 1,3 1 -1 -1 3,2 3,8 4,9 4,3 1,3 -1 1 -1 5,3 3,7 5,1 6,7 2,9 1 1 -1 4,1 4,5 6,4 5,8 5,2 -1 -1 1 5,9 4,2 6,8 6,5 3,5 1 -1 1 6,9 5 6 5,9 5,7 -1 1 1 3 3,1 6,3 6,4 3 1 1 1 4,5 3,9 5,5 5 5,4 Kontrollierbare Faktoren Inner Array Störfaktoren (Noise) Outer Array CAKE.MTWCAKE.MTW Stat >DOE >Factorial >Define factorial design … Stat >DOE >Factorial >Define factorial design …
- 15. Page 29/3805 BB W4 Taguchi 07, D. Szemkus/H. Winkler 10-1 5,0 4,8 4,6 4,4 4,2 10-1 10-1 5,0 4,8 4,6 4,4 4,2 Flour Mean Butter Egg Corner Center Point Type Main Effects Plot for Mean Data Means Main Effects Center points are not significant (curvature)Center points are not significant (curvature) Stat >DOE >Factorial >Factorial Plots … Stat >DOE >Factorial >Factorial Plots … Page 30/3805 BB W4 Taguchi 07, D. Szemkus/H. Winkler 10-1 10-1 5,6 4,8 4,0 5,6 4,8 4,0 Flour Butter Egg -1 Corner 0 Center 1 Corner Flour Point Type -1 Corner 0 Center 1 Corner Butter Point Type Interaction Plot for Mean Data Means Interactions The interaction between butter and eggs is significant The interaction between butter and eggs is significant Stat >DOE >Factorial >Factorial Plots … Stat >DOE >Factorial >Factorial Plots …
- 16. Page 31/3805 BB W4 Taguchi 07, D. Szemkus/H. Winkler Factorial Fit: Mean versus Flour; Butter; Egg Estimated Effects and Coefficients for Mean (coded units) Term Effect Coef SE Coef T P Constant 4,6822 0,04167 112,36 0,000 Flour 0,3650 0,1825 0,04420 4,13 0,054 Butter 0,2150 0,1075 0,04420 2,43 0,136 Egg 0,8850 0,4425 0,04420 10,01 0,010 Flour*Butter 0,1150 0,0575 0,04420 1,30 0,323 Flour*Egg 0,1450 0,0725 0,04420 1,64 0,243 Butter*Egg -1,2450 -0,6225 0,04420 -14,08 0,005 Statistical Analysis of the Taste Rating Enter column C9 for “mean” and select “terms”. Include all terms except ABC and center points in model. Butter * Egg interaction is the most importantButter * Egg interaction is the most important Stat >DOE >Analyze factorial design … Stat >DOE >Analyze factorial design … Page 32/3805 BB W4 Taguchi 07, D. Szemkus/H. Winkler Which factors (parameter) have a significant effect on the taste? What are the settings (flour, butter, egg) which results in the best taste – recommendation? What would be your approach to figure out if the cake mix is robust against variation of the backing process? We perform the following analysis. We use the natural logarithm of the means. Statistical Analysis of the Taste Rating
- 17. Page 33/3805 BB W4 Taguchi 07, D. Szemkus/H. Winkler 10-1 0,6 0,4 0,2 0,0 10-1 10-1 0,6 0,4 0,2 0,0 Flour Mean Butter Egg Corner Center Point Type Main Effects Plot for LogeStd Data Means The parameter flour is significantThe parameter flour is significant Main effects; Natural Logarithm Used Stat >DOE >Factorial >Factorial Plots … Stat >DOE >Factorial >Factorial Plots … Page 34/3805 BB W4 Taguchi 07, D. Szemkus/H. Winkler 10-1 10-1 0,5 0,0 -0,5 0,5 0,0 -0,5 Flour Butter Egg -1 Corner 0 Center 1 Corner Flour Point Type -1 Corner 0 Center 1 Corner Butter Point Type Interaction Plot for LogeStd Data Means Interactions; Natural Logarithm Used These interactions can be significant These interactions can be significant Stat >DOE >Factorial >Factorial Plots … Stat >DOE >Factorial >Factorial Plots …
- 18. Page 35/3805 BB W4 Taguchi 07, D. Szemkus/H. Winkler Factorial Fit: LogeStd versus Flour; Butter; Egg Estimated Effects and Coefficients for LogeStd (coded units) Term Effect Coef SE Coef T P Constant 0,2255 0,03601 6,26 0,025 Flour -0,6986 -0,3493 0,03819 -9,15 0,012 Butter -0,1738 -0,0869 0,03819 -2,28 0,151 Egg -0,3401 -0,1701 0,03819 -4,45 0,047 Flour*Butter -0,0328 -0,0164 0,03819 -0,43 0,710 Flour*Egg -0,1826 -0,0913 0,03819 -2,39 0,139 Butter*Egg 0,2729 0,1365 0,03819 3,57 0,070 Use column C12 for Loge (std) as the response Flour is significant; Eggs are on the limit; Interaction are not significant Flour is significant; Eggs are on the limit; Interaction are not significant Statistical Analysis; Natural Logarithm Used Stat >DOE >Analyze factorial design … Stat >DOE >Analyze factorial design … Page 36/3805 BB W4 Taguchi 07, D. Szemkus/H. Winkler What are your recommendation now? What are the factor settings (flour, butter eggs and backing process) in order achieve the best taste rating? Statistical Analysis; Natural Logarithm Used
- 19. Page 37/3805 BB W4 Taguchi 07, D. Szemkus/H. Winkler Our king has received some information about robust designs. He wants to know from his knights how robust is that catapult? He is interested in the effect of three different settings on a predefined shoot distance. You have to plan an experiment to investigate the 3 most important controllable factors! 1. Stop point (Position 2 and 4) 2. Rubber tension (Position 1 and 3) 3. Angle (155 and 170 degrees) The noise variables are the different suppliers for the balls and the rubber band (2 settings each). We perform this experiment, analyze it and transfer our knowledge to the knights and the king. Rubber band - fix point Rubber band - fix point Stop -PositionStop -Position Rubber band - tension adjustment Rubber band - tension adjustment 1 2 345 3 4 1 2 3 4 Tension angleTension angle 6 Ball typeBall type Rubber bandRubber band 1 2 5 6 Rubber band - fix point Rubber band - fix point Stop -PositionStop -Position Rubber band - tension adjustment Rubber band - tension adjustment 1 2 345 3 4 1 2 3 4 Tension angleTension angle 6 Ball typeBall type Rubber bandRubber band 1 2 5 6 Rubber band - fix point Rubber band - fix point Stop -PositionStop -Position Rubber band - tension adjustment Rubber band - tension adjustment 1 2 345 3 4 1 2 3 4 1 2 3 4 Tension angleTension angle 6 Ball typeBall type Rubber bandRubber band 1 2 5 6 Catapult Exercise Page 38/3805 BB W4 Taguchi 07, D. Szemkus/H. Winkler Summary • Understanding of the principle of robust designs within product and process development • Understanding of the Taguchi method - application of a DOE to investigate robustness • Creation and analysis of experiments to investigate factors which have the most influence on a product / process design or variation • Evaluation of interactions in order to make a process robust