1. The Fortenberry
Cash to Cash Series:
The Missing Equation: A formula that
determines your company’s financial health
whitepaper
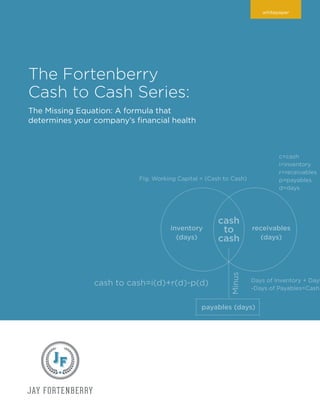
cash
to
cash
c=cash
i=inventory
r=receivables
p=payables
d=days
payables (days)
receivables
(days)
inventory
(days) Minus
Days of Inventory + Days
-Days of Payables=Cash-
cash to cash=i(d)+r(d)-p(d)
Fig. Working Capital = (Cash to Cash)
2. Executive Summary 2
Purpose of the White Paper 2
Introduction 3
The Fortenberry Cash to Cash Method 8
Element 1: Cash to Cash and Running the Business 9
Managing the Culture and People 10
Financial Controls 13
Sales, Inventory & Operations Planning (SIOP): A Continual Process 18
Portfolio and Product Review 21
Business Continuity 31
Element 2: Cash to Cash, Cycle Time
and Optimizing the Supply Chain 34
Supply Chain Design: An Approach for Improving Cycle Time 36
Element 3: Building a Productivity Machine 47
A Climate for Continuous Improvement 48
Conclusion 49
Contents
whitepaper
1The Jay Fortenberry Cash to Cash Method
3. Executive Summary
The old adage that “cash is king” is truer than ever. But handling cash effectively, with foresight, insight and top-down
management awareness of the stakes involved can mean the difference between merely surviving and long-term, profitable
viability. Unfortunately, many companies don’t know how to leverage and optimize their cash, working capital, free cash
flow and the cash to cash cycle—and how those financial management tools are interconnected.
This paper maintains that a company’s health is determined by reviewing and refining its working capital and cash to
cash positions. Here are some of this paper’s major conclusions that underscore the importance of cash flow in your
business, optimizing your supply chain and building a company-wide productivity machine:
Purpose of the White Paper
Every company has to deal with issues involving cash, cash flow, working capital and debt. How efficiently these
issues are handled can determine their long-term success or failure. This is why the “cash to cash” cycle is important.
The cash to cash cycle is a process to calculate how long cash is tied up in a company’s cash producing and cash
consuming areas, including receivables, payables and inventory. It can determine the financial health of a company.
Yet few companies are aware it exists. Or, if they are, only one in three of them understand its importance.
This paper explores the three elements of the cash to cash cycle and shares how companies can leverage it as an effective
way to improve their bottom lines and create efficiencies in their business.
The fact that only one in three companies consider their cash to cash cycle important is a costly mistake—on the
order of tens of billions of dollars—that can be fixed. That is the purpose of this white paper and why almost any
business executive with concerns about cash and working capital can profit by implementing the Fortenberry Cash
to Cash Method.
• The cash to cash cycle is the period of time between
when a company spends a dollar on purchases from a
supplier until it is turned into a dollar of revenue from
the customer. Thus, the shorter the timeframe the better.
• Aggressively managing the speed and agility of the
cash to cash cycle by managing end-to-end cycle
time is a key driver for cash performance.
• It all begins at the top. A company may
have the processes and tools to manage through a
cash or operational crisis, but if the leadership team
is not actively engaged and/or is second-guessing the
frontline managers’ abilities to execute the plan, then
all could be lost very rapidly.
• Contrary to a popular myth, inventory is located
throughout the entire business, not just in a
manufacturing or a distribution center. By managing
cycle time, a business brings together all of its processes
from customer service to delivery in order to direct how
its cash is used.
• Optimizing supply chain design is about positioning
resources in ways that enhance profitability and working
capital while producing shareholder value.
• The simple but vital message to convey is that your cash
is a major asset. It must be used effectively to make all
aspects of your business—from finance to manufacturing,
from inventory to the supply chain—run smoothly,
reliably and profitably.
2The Jay Fortenberry Cash to Cash Method
4. Introduction
“Cash...is to a business as oxygen is to an individual,” says Warren Buffett.
“Never thought about when it is present, the only thing in mind when it is absent.” 1
According to the New York Times, of the Top 10 Reasons Small Businesses Fail
2
, six of those reasons revolve around
money and money management, including poor accounting and the lack of a cash cushion. Whether it is out of control
growth, operational inefficiencies or declining markets, the old adage that “cash is king” remains as true as ever because it
allows companies to grow, become, and remain profitable.
This isn’t new. Every company must deal with issues surrounding cash, cash flow, working capital and debt. There is a
process called cash to cash that directly impacts cash flow, working capital and how companies access and handle debt.
Few companies are aware it exists, and among those that are, one of three don’t understand its importance.
3
The bottom line: the cash to cash process illustrates the financial health of a company.
Companies such as Honeywell and Toyota do have internal processes for cash to cash and working capital management,
but based on my years of experience, many large as well as small companies don’t know what cash to cash is. And if they
do know something about it, many top level executives “don’t really understand how to go after it,”
4
says Dave Cote,
Honeywell CEO.
Cote’s point was underscored by J. Paul Dittmann, Ph.D., The University of Tennessee’s Executive Director Global
Supply Chain Institute: “When the CFO at Whirlpool asked us if we could somehow use our supply chain to cut
working capital in a major way, I was clueless. In fact, I’m embarrassed to say I couldn’t even define working capital. I
was stunned when I discovered the huge impact working capital has on the firm’s overall financial health, cash flow, and
ultimately shareholder value. And I was surprised and gratified when three years later we had taken $600 million out of
working capital using supply chain projects.”
5
Because there is a lack of knowledge about cash to cash or how to “go after it,” companies often take on debt rather than
cleaning house by clearing up bad processes. Instead of having what could be an intense, even emotional, conversation
with their suppliers, they have a matter-of-fact conversation with their banker about borrowing money.
It is easier to borrow than it is to clean up cash management practices. But debt comes with its own set of
potentially harmful complications. As Warren Buffett says, “I do not like debt and do not like to invest in
companies that have too much debt, particularly long-term debt. With long-term debt, increases in interest rates
can drastically affect company profits and make future cash flows less predictable.”
6
Even with current financial conditions where money is cheap, one might surmise that after the tumultuous financial
upheaval of 2009, business leaders would hoard as much cash as possible as a defense mechanism and hedge against
another downturn in the highly volatile global economy.
While some companies do maintain large “rainy day” cash reserves, the Hackett Group’s 2015 Working Capital Survey
7
found that seven years after the Great Recession, debt continued to grow at the alarming rate of more than 113%.
“It was the global financial crisis of 2000-2009 which brought a renewed focus to risk mitigation and liquidity in supply
chains,” observed Lisa Ellram in a report (with Ryan Fernandes) on “Unlocking the Potential of Supply Chain Working
Capital Finance.”
8
The report continued: “Cash was in short supply, and those who had cash were heavily favored by
analysts. Cash was difficult to access through conventional credit channels as banks tightened their belts, lending criteria
and in some cases withdrew from certain countries or segments.”
3The Jay Fortenberry Cash to Cash Method
6. CASH TO CASH CYCLE AVERAGES
Athletic Apparel
Automotive
Chemical
Consumer Products
Food & Beverage
Hard-Disk Drives
High-Tech & Electronics
Medical Devices
Retail
Pharmaceutical
Semiconductors
119
100
82
44
32
19
25
275
23
161
93
110
89
78
21
37
19
14
269
18
168
98
94
87
77
18
40
15
5
309
13
182
92
INDUSTRY SECTOR 2000-2003 2004-2007 2008-2011
Source: Supply Chain Insights LLC. Corportate Annual Reports 2000-2011
It seems rather incredible, but why do only one in three companies view the cash to cash cycle as important? Also
disturbing is that according to JP Morgan, each year Fortune 500 companies incur more than $81 billion of unnecessary
supply chain and working capital costs due to cash flow inefficiencies and lack of visibility.
12
Former Supply Chain Insights Research Associate Abby Mayer asserts that the health of the supply chain can be “quickly
assessed” through the analysis of the cash to cash process.
Her paper, “Supply Chain Metrics That Matter,”
13
says that while supply chain leaders have focused on the reduction of
cash cycles, “little progress has been made. “For most, despite a decade of investments in channel connectivity and supply
chain optimization, there is limited progress on receivables and inventory.”
As seen in the figure below, she says that over the last 15 years, “the only industry that has shown dramatic and
continuous improvement in reducing cash to cash cycles is high-tech and electronics.”
The figure shows that major industries have had cash to cash cycle reductions that are quite dramatic. For example, during
the period 2000-2011 cash to cash cycle time averages in the High Tech and Electronics industry decreased to five days from
25 days. But even a small reduction in the cycle averages can be highly valuable when it comes to the cash flows needed to
operate complex operations.
The figure illustrates the value of using cash to cash in major industries.
Mayer’s analysis supports the need for supply chain teams to align in order to improve cash to cash cycles: “While
companies have claimed to reduce cash to cash cycles, few have been successful. Industry results are often overstated and
inflated, especially self-reported metrics. There is a wide belief, largely unfounded, that supply chain projects over the
past decade have had a dramatic impact on reducing cash-to-cash cycles and inventory levels. What we see in the data
is that progress has been slow for industries, but that the most marked progress is by a few leaders operating in several
different industries.
“Those that have succeeded focused on year-over-year progress and consistent improvement. They managed the supply
chain holistically and balanced the varying demands of the C2C cycle. They used technologies and valued planning
processes. For leaders, the proof that supply chain matters is in the (cash to cash) numbers.”
14
Whether it was Messrs. Toyoda and Ohno at Toyota teaching us Just-In-Time (JIT), Bob Lane at John Deere talking
about the obligations to shareholders for Estimate to Cash, or Honeywell’s Dave Cote’s boundless enthusiasm for
reducing overall cycle time—all of these leaders have had a firm appreciation for how the supply chain worked and
a vision for how it should evolve.
5The Jay Fortenberry Cash to Cash Method
9. As shown, the failure of a business to recognize the importance of managing free cash flow can literally kill it.
The pages that follow introduce the Fortenberry Cash to Cash Method.
Terms
Following are some of the cash and cash management terms referred to in this paper.
Cash to Cash Cycle (cash conversion cycle): The cash to cash cycle is usually defined as the period of time between
when a company spends a dollar on purchases from a supplier until it is turned into a dollar of revenue from the
customer.
Cycle Time: Cycle time is the end-to-end total time from when a customer creates demand until the product is
delivered and cash collected. It comprises all information and material flows, such as order processing time, inventory,
manufacturing, and logistics/distribution, as well as any processing and queuing time.
JIT: From Investopedia—Just-in-time (JIT) is an inventory strategy companies employ to increase efficiency and
decrease waste by receiving goods only as they are needed in the production process, thereby reducing inventory costs.
This method requires producers to forecast demand accurately.
People, Process, Tools: A methodology defined as the three elements needed for successful organizational
transformation. It is the foundation of the Fortenberry Cash to Cash Method: People (or the culture), the Processes
(simple, repeatable methods of meeting the desired output) and Tools (software) are utilized.
Working Capital: From Investopedia—Working capital is a measure of both a company’s efficiency and its short-term
financial health. Working capital is calculated as: Working Capital = Current Assets - Current Liabilities.
Free Cash Flow: Free cash flow (FCF) is a measure of how much cash a business generates after accounting for capital
expenditures such as buildings or equipment. This cash can be used for expansion, dividends, reducing debt, or other
purposes. The formula for free cash flow is: FCF = Operating Cash Flow - Capital Expenditures.
8The Jay Fortenberry Cash to Cash Method
13. MANAGING THE CULTURE AND PEOPLE
Business Strategy Deployment
Over the course of my career I’ve seen many examples of how corporate culture can stand in the way of new initiatives
and strategy deployment. It’s all about getting the culture to move in a unified direction and “drive around perfection.”
Actually, getting a corporate culture to adopt a new program or process takes more effort than simply designing and
executing it. In a global organization, areas like languages, native customs, skills, etc. can have a profound impact on
the success or failure of a program. A company can have world-class processes and tools, but can fail at sustaining
improvements if it does not take the time to fully bring its people along.
In addition, often the company bureaucracy works hard to avoid change. People become comfortable with the way
they are performing their job, scared that the change will have a negative impact on their lives, or they have developed
a power base around the process to be changed. This can actually prevent improvements designed to enhance cash
and the bottom line from taking place. Managing human resources is therefore a vital part of improving any process.
Areas such as Leadership, Organization Effectiveness and Continuous Improvement are all areas of emphasis in order
to achieve and sustain a business strategy deployment.
Business strategy deployment is an integrated approach to drive organizational development by focusing on company
objectives and goals. It concentrates on employee engagement and continuous improvement to assure a process is
sustainable, including these factors:
• Prioritizing: Critical business objectives are developed, prioritized and flowed from the
business leadership to the point of execution.
• Alignment: All functional areas are clearly aligned with the goals of the business.
• Precision: Assures a disciplined management process that integrates the business objectives and that
annual goals are developed, communicated and measured through all levels of the organization.
• Accountability: Ensures that the responsible functions drive accountability for achieving the objectives
and annual goals. In addition, the focus is to integrate all functions so that they move in one direction.
The intent of clearly rolling out the strategy through the entire organization is to:
• Communicate expectations
• Remove all ambiguity
• Insure a complete understanding by the culture
• Hold the responsible parties accountable for their actions
Business strategy deployment is a tool to help focus the organization to meet the desired business results.
The Human Factor
A company is not just a ‘for profit’ enterprise: it also bears a social responsibility to its customers, employees and the
community to make quality products at reasonable prices. All of the facilities, equipment and capital don’t build a
single product, employees are actually the ones that perform the work.
All companies have a set of core values. It is critical that employees grasp these values and actively work to put them
into practice. These values must be used repetitively in order to become sustained and integrated as part of the culture.
There are five programs that can be implemented with little investment to assist in developing a company’s culture.
They illustrate directly to employees leadership’s commitment to doing the right thing.
12The Jay Fortenberry Cash to Cash Method
14. 1. Safety First
A business’s relationship with its employees starts with safety. A company-wide safety policy is the first and primary
method used to communicate a business’s commitment to its employees. It should set expectations regarding the
management of health, safety and environmental policies and captures all issues and risks. This safety policy is used
to communicate to a global workforce with the objective of conveying the business leadership’s commitment to
employees and contractors. It establishes the framework and guidance for performance standards, strategic planning
and setting of objectives and targets.
2. Mutual Trust
The building of mutual trust between a company and its employees is essential to any improvement process. Trust is
earned through building a cooperative environment where the employees feel their contributions are valued. Equally,
the company gains trust with its workforce when it recognizes that rules and policies are respected as well as employee
contributions to productivity. In this environment, everyone works in the same direction for the prosperity of the business.
3. Employee Empowerment
For people accustomed to regimented work environments, employee empowerment can be quite intimidating.
However, responsibility and authority to improve your work are motivational. Experience has proven that the more
authority employees have to manage their jobs, the more they are inclined to pursue improvements. Employees that
can translate their ideas into viable business improvements take pride in their work and the company.
4. Building a Culture of Continuous Improvement
Kaizen (or continuous improvement) is baby steps that add up to great big steps. Each day should be about continuous
learning and improving. The business leadership needs to set the expectation that all employees think about process
improvement as part of their daily work routine. A continuous improvement organization should:
• Integrate lean principles
• Anticipate the future
• Reduce cost
• Eliminate waste
• Create a learning experience for all
Ultimately, Kaizen is about job ownership. It entails giving an employee full responsibility and accountability for their
job. By taking charge of turning out products that are desired by customers, employees receive the authority to modify
and shape their work in ways that improve quality and enhance productivity.
5. Leadership
Leadership is the ability of an individual or organization to guide other individuals, teams, or entire organizations to a
desired outcome. It involves:
• The capacity to establish, communicate and execute a clear vision for others to follow
• Providing information, processes and resources to make timely decisions
• Guiding the process by balancing conflicting priorities
• Insuring teams are accountable for the performance of the organization
13The Jay Fortenberry Cash to Cash Method
24. Activities designed to reduce or prevent these products from growing can include the development of action plans and
timelines to sell or dispose of material as well as developing how to predict slow moving inventory with what will be
excess in the next 3, 6, 12 months.
New Product Introductions through the End of Life
Every additional product line increases complexity from the design through the delivery processes. Product portfolios
with their complexity will have an impact on cash as well as P&L performance. Consequently, managing the portfolio
of products—including the beginning of life, product rationalization and end of life—has a profound impact on cash
and operating expense. When evaluating which product to make, a business needs to evaluate certain factors for cost,
sales and margin. Listed below are some of the costs related to delivering a product to the marketplace.
SIOP and NPI
NPI (new product introduction) is a vital element of the SIOP Process. Demand planners need a view of all upcoming
product introductions, including timing, volumes, probability of projects happening, assumptions to be understood
and documented, opportunities and risks. Any changes should be recorded for incorporation into the demand review
(schedule, volumes, risks, etc.). Creating demand profiles to support product launches, as well as an understanding of
launch and growth strategies is important to managing to cash and operating expenses.
End of Life
Most companies create and maintain their product lines, but very few know how to manage the end of an SKU. Few
understand the financial ramifications on both the profit and loss sheet and on lost working capital by not managing
end of life processes well. Simply put, not performing these tasks leads to a proliferation of unneeded SKUs as well as
increases in inactive, surplus and obsolete inventories.
Manufacturing Costs:
• Changeovers
• Schedule changes
• Component part management
• Tooling
• Maintenance
• Work in process inventory management
Logistics Costs:
• Warehousing and facility costs
• Inventory management
• Freight
Procurement:
• Supply management
• Materials management
• Design Engineering
• Developing and maintaining specs
• Testing
Sales and Marketing Costs:
• Training
• Communications
• Close outs
Customer:
• Warehouse/storage changes
• Display changes
23The Jay Fortenberry Cash to Cash Method
25. Two ways to identify products for end of life are:
• A combination of low sales and margins
• Determining if there are any strategic reasons for a product to stay
Managed properly, end of life assists a company in cleaning up its inventories. Conversely, failing to manage it can
result in higher operating costs by holding inventory, as well as increased cash requirements.
Demand Planning
The demand plan is a realistic view of future sales based on known activities and trends. It’s used by sales and
marketing units to focus or change the commercial direction of the business. It is also a formal request for the supply
chain to have the relevant materials and schedule capacity for anticipated customer requirements. The demand plan is
a financial commitment to manage top line revenue as well as bottom line margin.
Forecasting
I once attended a supply chain forum where the president of a well-known consumer electronics company exclaimed,
“My sales force turned out to be the world’s worst forecasters, but the world’s best adjusters…” This was a great
statement on the art of forecasting. The forecasting process provides an ongoing, sustainable 12-to-18-month forecast
for the business that uses the collaboration of sales and product management knowledge based on historical actuals, as
well as the future expectations of existing and new customers for existing and new product listings. The objective is to:
• Provide an accurate forecast of unconstrained demand by product listing quantity with 12-to-18 month visibility
• Overlay the forecast with market intelligence, trends and exceptions
• Deliver ongoing metrics of forecast accuracy by product listing
• Enable feedback to sales and business teams for improvement to forecast accuracy
A forecasting process that works best for one company probably will not work for another due to differing customer
bases, products, data and people. Other important points to remember regarding forecasting is that a data
warehouse is required to guarantee data integrity and the forecasting system must integrate “seamlessly” with
other corporate systems.
Supply Planning
The supply planning process objective is to resolve any issues in the demand plan that prevent optimal operation
of the supply side of the business. The inputs are the demand plan, previously demonstrated capacity, and supplier
constraints with output being a rough cut capacity plan.
Key elements include:
• Reviewing the unconstrained demand plan
• Demonstrating performance abilities for factories, logistics and suppliers
• Developing a “rough cut” plan against raw materials, labor, machine hours and suppliers
• Creating “what if” scenarios
• Understanding assumptions for risks and opportunities
• Performing a gap analysis of the annual plan vs. the supply plan with recommendations to close any gaps
24The Jay Fortenberry Cash to Cash Method
27. CUSTOMER CARE
The Order Management Process
Customer care is the process that begins when a customer first inquires about a product and continues through the
time the product is delivered. Order management strategies are driven by how a business wants to present itself in the
marketplace and is the company’s main contact point for customers. Some of customer care’s responsibilities are:
• Developing customer requirements
• Determining how orders are defined
• Quoting pricing and lead times
• Providing technical support
• Managing return goods
• Working with “checkout abandonment” in the process
The information that flows from customers follows a completely different path than the product’s physical flow. It is
common for a company to mature with layers of systems that feed each other back-and-forth. Often these systems
are batch-driven and can take up to a week to transfer information. In these cases, inventory is required to protect the
goods that have been reserved in the queue.
Creating a Customer Order
Order management does not mean just simply taking a customer order. Rather, it works to manage the customer
relationship by:
• Defining back order, partial order, and allocation/reservation policies
• Insuring lead times in the system and/or catalogs are correct
• Keeping both customer and product masters accurate, in a timely manner
• Protecting the business by making sure “denied party screening” is completed
• Defining geographical coverage with no currency games allowed
• Managing the return goods process including customer debits and credits
• Delivering performance metrics
Furthermore, with the advent of B2B (business to business) and B2C (business to consumer) web-enabled activities,
customer care can also be required to manage shopping carts and their abandonment, updating websites with current
stocking levels, as well as providing order confirmations and tracking.
The customer care and/or order management processes can have a profound impact on the management of working
capital by ensuring the data administered is in sync with the rest of the organization. A single voice to the customer is
necessary: this is where it starts.
26The Jay Fortenberry Cash to Cash Method
29. What is MRP?
A Materials Resource Planning (MRP) system is software that assists in doing the calculations needed to plan
manufacturing based on inputs from a forecast that includes:
• Inventory control
• Production planning
• Management information system
• Manufacturing control system
MRP has evolved to group demand by calculating from need date and integrating business planning and
operations. Used properly, it plans production so that the right materials are at the right place at the right time.
Ideally, MRP should:
• Reduce inventory levels and component shortages
• Increase shipping performance and customer service
• Simplify and provide accurate scheduling
• Improve productivity while reducing scrap and rework
• Decrease purchasing costs and lead times
• Enhance production scheduling and reduce manufacturing costs while producing higher quality
Data Integrity is the Key to MRP System Accuracy
Accuracy is essential for accurate routings and to maintain accurate standards in the following areas:
MRP does not foresee events—it only provides calculations from the data it is fed. It can be a classic case
of “garbage in/garbage out” if not implemented and maintained properly.
Inventory Records
• On hand
• Open purchase orders
• Work in progress
Bills of Materials
• Data
• Structure
Item Master
• Part numbers
• Source—make/buy
• Lead times
• Order quantities
• Ordering rules
28The Jay Fortenberry Cash to Cash Method
32. BUSINESS CONTINUITY
Business interruptions can take many forms: natural disasters such as the earthquake and ensuing tsunami in
Fukushima, Japan; labor stoppages similar to the occurrences on U.S. West Coast docks; a health crisis where segments
of a population are required to be quarantined; or social unrest and wars. These types of events are growing in numbers
as well as increasing in severity. In an ideal world, incident response is the execution of a well thought out, focused and
rehearsed plan that engages all of the team that will manage the future crisis.
Resiliency is the capacity to recover quickly from difficulties; a toughness. It is also the ability of an object to spring
back into shape; or elasticity. Regardless of the type of business interruption, the fundamental role of a manager in
business continuity is to protect the brand and company by resuming “normal” operations as quickly as possible with
a minimum of disruptions to the company.
When a business continuity plan is implemented, vital resources such as cash, people and facilities are being diverted
in unusual ways to insure the long term viability of operations. Therefore, it is much easier to have these discussions,
prior to the emotion of a developing or ongoing disaster when a business is in the thick of protecting itself.
The subject is vast and entails literally every aspect of a company. For many, the only experience with managing in
this environment comes as an exercise of survival when a disaster strikes. Others have had to learn the practice from
repeated incidents over time.
The initial steps for building a business continuity process is to do a self-assessment starting with examining the
company’s tolerance for risk through its People, Processes, Tools:
• What defines a crisis that would trigger the formation of a response team?
• Who would be on this team?
• How does the team communicate and to whom do they report the details of their activities?
• If a disaster occurred would a company be resilient and keep going, or limit its losses via insurance
and/or just pick up and move?
• Finally, are the systems agile and scalable to support changes in operations, or is the business back in manual mode?
From here, a basic framework can be created for managing under crisis.
Disaster Preparedness
There is nothing worse than trying to quickly find contact information for team members and suppliers during a
crisis. A dynamic contact document must be updated regularly; it is necessary to create it at the outset of a business
continuity process. Call logs should be kept, with meeting minutes and status checks sent after all meetings, so that
information is understood and shared by all participants. There are no secrets—everyone is in the crisis together. All
activities are updated and distributed at least once per day.
Two types of communication are provided as a business continuity plan is administered:
• Technical experts and practitioners managing the process
• Leadership updates
Leadership
All too often companies do not have the time or resources to foresee the impact that an disruption may have on their
business. Rather they wait until an event or disturbance occurs, and then reactively manage the resulting situation.
This lack of preparation can turn what might be a small disruption into a full-fledged crisis.
31The Jay Fortenberry Cash to Cash Method
34. Cybersecurity
Cybersecurity is the process of protecting the confidentiality, integrity and availability of a business’ IT assets (systems,
data, networks). Conversely, compliance is often the minimum a company does to meet regulatory requirements or an
industry standard. Compliance involves checklists, whereas security involves a detailed discussion with the company
about its tolerance for risk. In compliance, both the regulators and businesses are slow to acknowledge new threats
as well as slow to implement change. On the other hand, cybersecurity requirements move quickly at the pace of the
market, threats and the risk profile of the business.
The resilience and preservation of a company’s ability to do business is crucial, because cyber threats are generally not a
matter of if, but when. A resilience program’s objective is to:
• Maximize visibility
• Minimize impact
• Enable a quick recovery
• Continuously improve
Cybersecurity focuses on a company’s critical assets first and is then applied to the next most important resources.
Elements of a cybersecurity program include:
• Network security
• Security architecture
• Data security
• Security awareness and training
• Cyber investigations
• Malicious content management
Many businesses elect to invest in security only after a significant event. The downside of this approach is that suppliers
are acutely aware when a customer is in crisis, which most likely is then reflected in the pricing. Compounding the
issue is that during a crisis third party professional services are often required to implement expensive new controls on
aggressive timelines. Thus the best strategy is to have the process in place before a company’s weakness is evident.
As a rule of thumb, large corporations spend 3% of revenue on IT, with small businesses doubling that.
16
Cybersecurity
can be benchmarked as a percent of IT spend and will depend on several factors including the risk-tolerance of the
company, and the maturity of the cybersecurity function. Cybersecurity can range from 2%-10%
of the IT budget.
17
Summarizing, the focus points when building and executing the process to manage a crisis are:
• Don’t wait until crisis hits to build a business continuity plan
• Respond in a timely manner—the longer you wait, the more damage can be done
• Establish a war room (physical or virtual)
• Encourage a mindset that this is now the team’s job. Everything else, if possible, should be moved to the side
• Don’t react: be quick, but also be fact-based and remember that nothing is off-the-record
• All communications should go through one channel with a spokesperson to represent the organization
throughout the crisis process
• Express empathy and concern for the victims
• Never hide anything; all problems will eventually surface
33The Jay Fortenberry Cash to Cash Method
38. COMPANY A: CASE STUDY
The following case study is based on the analysis of two flows for a privately-owned 30-year old Canadian nutraceutical
manufacturing and distribution business with $500 million in annual revenue. I’ll call it Company A. Its supply chain
grew around rapid product growth and thus became quite complex.
One of the studies looks at raw material flows inbound for the company’s manufacturing division, and the second on
the outbound flow to customers in Australia. Both examples illustrate how supply chains naturally evolve over time
from their original design. Without a team focused on managing this, cycle times increase, which adds inventory and
reduces available cash to the business.
Raw Material Flows into Manufacturing
Background:
Glucosamine is used in over 250 finished goods. Company A’s glucosamine finished goods inventory totaled $9
million. A one week reduction in lead time was worth $497,000, and total lead time varied from 110 days to 162
days, with an average of 127 days. By using the bill of materials and sales history the total demand for glucosamine was
determined to have a very stable demand pattern with low variability.
Other facts to note were:
• Glucosamine originates from Qingdao, China
• In 2015, 23 PO’s were issued totaling 460,000kg for $5.2 million
• One week of glucosamine raw material was worth $100,000
• A 20-foot shipping container from Qingdao carries 18,000kg
• MRP made changes on 15 of 23 purchase orders
• With all of the push out/pull in changes done by MRP, only one day was gained
• Service levels for finished goods were well below the company’s 95% on-time performance standard
• Quality control testing for glucosamine was done on Wednesdays
Other Observations:
• Incoterms with the supplier were CIF Vancouver, therefore the supplier controlled the routes and shipping schedules
• Actual supplier lead times ranged from 40 to 92 days with an average of 65.5 days
• A 16-day vessel sailing from Qingdao to Vancouver was available but seldom used
• Because quality control tested glucosamine on Wednesdays, if a container arrived on Monday it could schedule
accordingly and eliminate seven days of queue time
• Enhanced logistics and quality scheduling could decrease cycle time by two to three weeks, which could improve
service levels and the cash to cash performance
37The Jay Fortenberry Cash to Cash Method
41. As a result, the recommended implementation plan for the company’s Australian supply chain was to:
• Move active Australian SKU’s from forecast to master production scheduling (MPS) process in order to smooth out
procurement, factory scheduling and manufacturing process times
• Transfer into the MPS process for NPI, after six months of production
• Ship finished goods direct to Sydney every eight days
• Reduce inventory levels to match 140 day/$1.75 million working capital for cycle time decreases
• Investigate the effects of in-transit active vs. passive temperature controls to determine if there are value-added
benefits to customers
Summary of Case Study
In both cases, Company A failed to closely manage the monthly forecasting process, data accuracy, new product
introductions (NPI) and lead times. As a result, there was a large variability for suppliers and the customers. Also,
freight and logistics processes were not being managed, so costs were exceptionally high as a percent of revenue.
The key objectives were to:
• Identify current cycle time
• Reduce time through enhanced materials and logistics management
• Manage daily flows across all regions, suppliers and customers
• Create visibility of trade flows
• Ensure the ability to comply with changing trade regulation
• Increase flexibility by reducing touch points
The primary focus was on creating and maintaining the flexibility to absorb order fluctuations. In addition, a
secondary focus was to take the “nervousness” out of the system by standardizing the way the material was ordered,
received and shipped.
This was simply a back to basics campaign of management by walking around. From here value stream mapping
(VSM) could be developed that illustrated where value was added versus where it was taken away. This enabled the
ability to see where to go, how systems interacted with humans and the results of those exchanges. Building value
stream maps also highlighted where each process started and where it stopped with all of the inputs and/or overlaps as
well as where money was spent. VSM takes the emotion out of the conversation and so the focus is solely on the facts
for developing the best flows for the company, their supplier and customers. Finally, VSM points to where waste is
created as well as assist in determining how to eliminate it.
For raw materials, the process was slowed down, but eliminated the push out/pull in activities that sourcing routinely
was executing from system prompts. This enabled a calming effect to the entire supply chain and allowed the team to
focus on what was important and truly in need of intervention.
The process for finished goods was decreased by over 80 days. The products were taken off forecast and put directly
into the master production schedule based on actual usage. Also, the pathways for introducing and managing new
products were standardized, which improved quality and cost.
40The Jay Fortenberry Cash to Cash Method
42. Final Thoughts on the Supply Chain Design
By walking through the supply chain from supplier to customer, we have been able to uncover where we add value
and where it is lost. Furthermore, we have been able to analyze:
Additionally, taking the nervousness and uncertainty out of the supply chain, people were inspired and empowered
to make further enhancements. Finally, inventory was reduced by making flows simple, clear and streamlined with no
investment in expensive software packages or adding new people.
MANUFACTURING
Manufacturing lead time is the elapsed time throughout the manufacturing process. It begins when the raw material is
dispensed and the manufacturing site receives the go-ahead to produce, and ends when finished goods are available for
shipment. Manufacturing plays a key role in:
• Providing input for plant capacity on machine, labor, and suppliers
• Meeting schedule attainment and adherence
• Controlling quality through yield, scrap; including reworks, reclaims or sorting
• Managing cost per unit and units per hour output
• Supervising raw and WIP inventories including programs for their reduction
• Communication and escalation of issues
• Supplier performance
• Quality and productivity issues
The Complete Flow of the Supply Chain within Manufacturing
Creating an environment of simplified flows, material availability and schedule stability helps to build a credible
process for customers and employees alike. Understanding the key elements of lead times, quality and costs allows a
business to better grasp response times, takes the nervousness out of the system and help the business grow.
• Financing cost
• Operational cost
• Administrative cost
• Capital purchases
• Machine output/ maintenance
• Labor management
• Logistics and trade
• Lead/response times
• Material cost
• Pricing
• Supplier Relationships
• Metrics
• Understood the impact of existing constraints
• Quantified the gaps
• Modeled the trade-offs
• Executed
41The Jay Fortenberry Cash to Cash Method
45. Elements of MRP
Due to the complexity of most operations, businesses have turned to the use of a Materials Resource Planning (MRP)
systems to assist in planning. MRP’s methodology is to:
• Explode the master production schedule
• Use BOM to identify parts needed
• Check availability of inventory
• Identify when work should start so that material is available when needed
• Generate work orders and purchase orders
• Repeat the process for other levels of BOM
MRP is a tool for understanding the timing of requirements for an item down to the component level. It applies to all
levels of the BOM and uses existing inventories in order to reduce requirements. Finally, MRP is based on dependent
demand and allows for the lead times for ordering, transit and manufacturing to be taken into account.
The benefits of MRP include:
• Realistic commitments, which provides for better customer service
• Controlled reduction of inventories, which reduces the use of working capital
• Improved responsiveness and flexibility through better forward planning
• Enhanced employee involvement through availability of information
• Stronger relationships with suppliers
• Integrated financial management
Material Replenishment Strategies
Inventory is created to compensate for the differences in timing between supply and demand. Some of the reasons
for holding inventory are:
• Expected demand or cycle stock
• Demand variability or safety stock
• Capacity shortages or pre-build
• In transit inventory
• Purchase prices discounts
• Lot sizing
• Postponement strategies
44The Jay Fortenberry Cash to Cash Method
48. Element 3: Building a Productivity Machine
A CLIMATE FOR CONTINUOUS IMPROVEMENT
Building a productivity machine and improving cycle time isn’t difficult, but it does take time, energy and
collaboration from the entire enterprise. Everyone within the organization needs to be fully engaged and in
agreement. This starts in the boardroom and flows down through all People, Processes and Tools.
Assembling the Team
When building a Cycle Time Team, your best athletes must be on the field and enthusiastic. This should not be an
assignment of dread: rather, it should be viewed as an opportunity to help build the company into a healthier and
stronger business.
The CEO is unquestionably the spiritual team leader, but they also have very real obligations to investors, shareholders,
and customers that require their time. This means that the team needs a strong person granted authority to wander
through every nook and cranny of the company. This is typically the senior finance leader. They have the power and
knowledge, as well as the ability to draw on the necessary financials to develop base lines and execute a scorecard for
the process.
A cross-functional team of experts needs to be organized to examine customer care (or order management), sourcing,
manufacturing and logistics. Health care, nutritional, or pharmaceutical industries will want to include product
quality as a key team member.
The Cycle Time Team needs to be small and agile, with the ability to move quickly through divisions, processes and
geography so that the bureaucracy has difficulty keeping up with their activities and progress. Assignments given to
each function need to be completed on time, with any blockage—be it employee, supplier or constraint—identified
and positively resolved. No victims are allowed— instead, celebrating success and having fun should be a constant. It is
inspiring to watch the progress and see the results in the monthly financials.
Managing the Organization
As the team’s journey begins, the bureaucracy will wonder what the initiative is. Town hall meetings can be used to
introduce and describe the journey the company has elected to take, and leadership should take pride in the new
program and explain the way forward to the workforce. It needs to be stated that all supply chain practices are up for
review, but that unless there is flagrant bad behavior, amnesty will be given for an initial period. This will disarm the
bureaucracy’s concerns and allow the team to advance.
Organizational alignment is fundamental in rolling out this program. The team needs to understand the reporting
relationships, who makes the decisions for what, and how those decisions are made: this is critical to identifying
opportunities. Additionally, aligning goals, compensation and incentive plans streamlines the ability to get the process
moving quickly, efficiently and in a high-quality manner.
47The Jay Fortenberry Cash to Cash Method