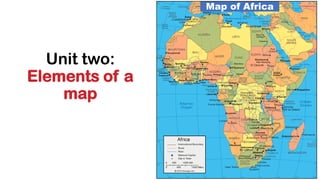
SlideShare una empresa de Scribd logo
1 de 53
Unit two:
Elements of a
map
Map of Africa
Introduction
What is a map?
A map is a representation of the features of an
area of the earth on a flat surface. The area could
be on land or sea.
A map usually shows physical features such as
mountains, rivers, valleys, cities, roads, etc.
Elements of a map
A good map has specific features. These features
are commonly referred to as the elements of a
map.
N.B: The elements of a map are not part of the
information that is represented in a map. They are
therefore usually placed at the margins.
Frame
A compass
Legend
Scale
Title
Is this map good? Either way,
explain why.
The following are the major elements of a
good map.
Element Description
Title This shows the information that is contained in a map.
A key It helps a map reader to understand the symbols, colours and
signs used. A key is important since it helps one to
understand the contents of a map in detail
A compass This shows the direction of various features that are shown
on map. The directions are usually in relation to the cardinal
points of a compass. They are North, South, West and East.
Scale This shows the relationship between the distance on the map
and that of the ground. A scale helps cartographers to draw
a large area of the earth’s surface on a small sheet of a
paper.
Frame This is a line that surrounds a map showing its limitation
Symbols and signs used on maps
A symbol is something that is used for or regarded
as representing something else.
The symbols are usually in the form of short-hand
characters, pictorial presentations or colours.
Some of the features represented on a key are
shown below
Drawing sketch maps
A sketch map is an outline map that is drawn
from observation.
It does not use exact measurements. It only
shows the main features of an area.
Characteristics of sketch maps
Sketch maps have the following features that
distinguish them from other maps.
• They are drawn roughly.
• They are not drawn to the scale.
• They represent few features for the interests of
the user.
• They are less detailed as compared to
topographical maps.
• They are simple and hence easy to understand.
• They have the elements of a good map such as
the title, key, frame and compass.
Steps involved in drawing a sketch map
1.Identify and point out the features to be represented.
2.Place the identified elements in order according to the
divisions of the landscape (background, middle ground and
the fore ground)
3.Draw the actual sketch map, representing it in a simple way.
4.Select a suitable title that accurately shows the purpose of
the sketch map.
Sketch map of school
Homework
•Draw a sketch map of Hope
Haven School.
Indicators of relief on maps
•The term relief in geography refers to the
nature and outlook of a landscape.
•Relief usually refers to the highest and lowest
elevation points in an area.
•Mountains and ridges are the highest elevation
points, while valleys are the lowest.
The relief features represented on maps include
the following:
•Mountains
•Hills
•Rivers
•Lakes
•Plains (low land areas)
•Escarpments/ rift valley
• Fault lines
•Swamps
Methods of presenting relief on maps
1. Layer tinting: This is the use of color to show different relief
features in relation to various heights. The color or shade used
varies from dark shades (Higher Altitudes) to light shades (Lower
altitudes).
2.Trigonometric stations: These are fixed surveying stations that
are used for land surveys. They are of three types:
Layer tinting
3.Spot heights
These are dots used to
represent specific areas
on a topographical
map.
4. Contours are lines drawn on maps joining areas with the
same height above sea level. They show both the height
and steepness of a place.
Characteristics of contour lines
✓These lines are usually drawn at intervals called contour
intervals.
✓The contour lines never cross each other.
✓The lines are usually brown in color.
✓In steep areas, the lines are very close to each other.
✓In areas with gentle gradients, the lines are far apart.
✓They have the height number written on them.
✓They are drawn based on a specific and uniform interval.
Contours
Spots height
Layer tinting
Interpretation of contours on a topographical map
Contours are used on maps to represent various landforms like:
❖Conical hills: These are types of hills that have round tops with slopes that
are similar in gradient and appearance.
Contour lines representing a
conical hill with uneven gradient
❖Flat-topped hills: their tops are generally flat. The contour lines
representing these hills are wide apart at the top, but start getting
close together towards the lower parts of the hills.
• Hills with depressions: These are hills which have depressions at their tops.
They are represented by contours that are ring shaped.
• Depression craters: these are hills or mountains that have deep
depressions usually containing water. An example is Mt. Bisoke in Rwanda.
Such hills or mountains are represented by ring-shaped contour lines.
Mt Bisoke crater
• Ridges: This is an elongated or stretched out hill, or a range of hills
that are close together. The contour lines representing ridges are
elongated or sometimes oval shaped. Ridge are separated from
each other by gaps called saddles which are broad gaps or cols
which are narrow gaps
Ridge
• Escarpments: These are physical features that have two
distinctively different slopes.
❖Steep side (scarp slope) is represented by contours close
together
❖Gentle side (dip slope) is represented by contours that are
far apart from each other.
• Slopes: A slope refers to the surface of the earth whereby one end is at
a higher level than the other.
Types of slopes and how they are represented on topographical
maps
1. Concave slope: The contours that represent this slope are close
together towards the top because the land is steep at the top and
gently slopes towards the base.
•Convex slopes: This is a slope that is gentle towards the top
and steep towards the base and the contours are widely
spaced at top and closely spaced at base.
❖Steep slope: this represented by
contours that are very close together.
This is due to the uniform steepness of
the slopes or land.
❖Gentle slopes: this is represented by contours that are
uniformly spaced because the slope is uniformly gentle.
❖Flat land or plains: This is represented by contours that
are uniformly widely spaced. E.g. swamps.
❖Even slope: This is a slope where the land has an almost
similar gradient. The contour lines are equally spaced.
There are other
indicators of relief
used on maps
✓Hachuring: This
method is used to show
the altitude of an area
with steep gradients
and are represented
using short parallel lines.
However, they do not
reveal the actual
heights.
Hachuring
✓Pictorial method: It uses symbols based on the appearance of
the features. It shows how features appear from above. For
example, mountains are raised while valleys are sunken.
Valleys are sunken
✓Hill shading: this represent relief by carefully using
light and shadow. The darker expressions are used to
represent the steep slopes. Shading
Bright expressions are
used to represent hill
tops and areas with
gentle gradients like
valley bottoms and
plains or flat lands.
The darker expressions are
used to represent the steep
slopes
Bright expressions are used to
represent hill tops and areas with
gentle gradients like valley bottoms
and plains or flat lands.
What indicator of relief used
on map below?
What indicator of relief used
on map below?
Maps and aerial photographs
Map is a representation on a flat surface of a whole or part of an area.
Maps represent parts of the earth’s surface drawn to scale.
A photograph is a picture created using a camera and stored digitally.
An aerial photograph is a picture of the earth’s surface taken from
above.
Aerial Photo
Map of Kigali
A map showing the districts of Rwanda.
Difference between maps and aerial photographs
Maps Aerial Photographs
This is a representation of a part of the
earth’s surface
is a picture taken from a raised platform
representing a small of an area
They are drawn to scale. Not taken to scale.
It represents a relatively large area. It only covers a small area or object.
The features used on a map are
interpreted by use of symbols.
The features are clearly seen without the
use of symbols.
A map is sometimes difficult to interpret. An aerial photograph is easy to interpret.
It is prepared selectively. shows all features that are near a place,
A map is difficult to come up with. It is relatively easier to take a photograph
A map has a key that helps readers to
interpret and understand it.
An aerial photograph has no key.
A map has no skyline An aerial photograph has a skyline
A map has a compass that shows the direction of
various parts on it.
An aerial photograph does not have a compass
Atlas index
An atlas is a collection of maps of the Earth or regions of the Earth. However,
there are atlases of other planets too. An atlas is usually a bound book with a
collection of maps.
Atlases usually present geographical features, political boundaries,
geopolitical, social, religious and economic statistics.
An atlas index is a detailed alphabetical listing of names, places and topics.
Elements of an atlas index
❖It shows various topics and names of places.
❖It is at the last pages of the atlas.
❖It lists a summary of the specific contents of the atlas.
❖It acts as a pointer.
❖It directs the reader to specific pages where given topics
❖It follows a systematic alphabetical or numerical order.
End of unit assessment S1B/20marks
1. What is a map? 2marks
2. Identify and explain the elements of good map. 5marks
3. What is a contour? 2marks
4. Identify the characteristics of contours. 3marks
5. What is the difference between map and aerial
photographs. 4marks
6. Name different methods of showing relief on
topographical maps. 4marks
End of unit assessment S1C/20marks
1. What is an atlas? 2marks
2. Identify and explain the elements of good map. 5marks
3. Identify the characteristics of contours. 3marks
4. What is the difference between a map and aerial
photograph. 5marks
5. Name 4 different methods of showing relief on
topographical maps. 2marks
6. Identify 3 elements of atlas index. 3marks
End of unit assessment S1D/20marks
1. What is an atlas? 2marks
2. Identify and explain the elements of good map. 5marks
3. Identify the characteristics of contours. 3marks
4. What is the difference between a map and aerial
photograph. 5marks
5. Name 4 different methods of showing relief on
topographical maps. 2marks
6. Identify any 3 elements of atlas index. 3marks
End of unit assessment S1A/20marks
1. What is a sketch map? 2marks
2. Sketch maps have features that distinguish them from
other maps. Name any 3 of those features. 3marks
3. Identify and explain the elements of good map. 4marks
4. Identify the characteristics of contours. 3marks
5. What is the difference between map and aerial
photographs. 4marks
6. Name different methods of showing relief on
topographical maps. 4marks

Más contenido relacionado

La actualidad más candente

Aerial photographs and their interpretation
Aerial photographs and their interpretationAerial photographs and their interpretation
Aerial photographs and their interpretation
Sumant Diwakar
 
Topographic maps presentation_mine
Topographic maps presentation_mineTopographic maps presentation_mine
Topographic maps presentation_mine
misterbatroms
 
Geomorphology applications
Geomorphology applicationsGeomorphology applications
Geomorphology applications
vyshalik
 
Digital Elevation Model, Its derivatives and applications
Digital Elevation Model, Its derivatives and applicationsDigital Elevation Model, Its derivatives and applications
Digital Elevation Model, Its derivatives and applications
Shadaab .
 

La actualidad más candente (20)

Projections and coordinate system
Projections and coordinate systemProjections and coordinate system
Projections and coordinate system
 
Basic topographic mapping
Basic topographic mappingBasic topographic mapping
Basic topographic mapping
 
Aerial photographs and their interpretation
Aerial photographs and their interpretationAerial photographs and their interpretation
Aerial photographs and their interpretation
 
Introduction to Maps
Introduction to MapsIntroduction to Maps
Introduction to Maps
 
Aerial photogrammetry 05
Aerial photogrammetry  05Aerial photogrammetry  05
Aerial photogrammetry 05
 
Atmospheric windows
Atmospheric windowsAtmospheric windows
Atmospheric windows
 
Principle of aerial photography and types.ppt
Principle of aerial photography and types.pptPrinciple of aerial photography and types.ppt
Principle of aerial photography and types.ppt
 
Data sources and input in GIS
Data  sources and input in GISData  sources and input in GIS
Data sources and input in GIS
 
Toposheet indexing .
Toposheet indexing .Toposheet indexing .
Toposheet indexing .
 
Topographic maps presentation_mine
Topographic maps presentation_mineTopographic maps presentation_mine
Topographic maps presentation_mine
 
Geomorphology applications
Geomorphology applicationsGeomorphology applications
Geomorphology applications
 
Maps, cartography and significances
Maps, cartography and significancesMaps, cartography and significances
Maps, cartography and significances
 
Geodesy - Definition, Types, Uses and Applications
Geodesy - Definition, Types, Uses and ApplicationsGeodesy - Definition, Types, Uses and Applications
Geodesy - Definition, Types, Uses and Applications
 
Toposheet interpretation
Toposheet interpretationToposheet interpretation
Toposheet interpretation
 
Map Reading and Interpretation
Map Reading and InterpretationMap Reading and Interpretation
Map Reading and Interpretation
 
Introduction to aerial photography and photogrammetry.ppt
Introduction to aerial photography and photogrammetry.pptIntroduction to aerial photography and photogrammetry.ppt
Introduction to aerial photography and photogrammetry.ppt
 
Map Projections
Map ProjectionsMap Projections
Map Projections
 
Remote sensing and aerial photography
Remote sensing and aerial photographyRemote sensing and aerial photography
Remote sensing and aerial photography
 
Distortions and displacement on aerial photograph
Distortions and displacement on aerial photographDistortions and displacement on aerial photograph
Distortions and displacement on aerial photograph
 
Digital Elevation Model, Its derivatives and applications
Digital Elevation Model, Its derivatives and applicationsDigital Elevation Model, Its derivatives and applications
Digital Elevation Model, Its derivatives and applications
 

Similar a Unit 2 Elements of a map.pdf

Chapter 3 gateway 123
Chapter 3 gateway 123Chapter 3 gateway 123
Chapter 3 gateway 123
MissST
 
Chapter 3 gateway 123 combined
Chapter 3 gateway 123 combinedChapter 3 gateway 123 combined
Chapter 3 gateway 123 combined
MissST
 
Orienteering 101
Orienteering 101Orienteering 101
Orienteering 101
rsintobin
 

Similar a Unit 2 Elements of a map.pdf (20)

Chapter 3 gateway 123
Chapter 3 gateway 123Chapter 3 gateway 123
Chapter 3 gateway 123
 
Chapter 3 gateway 123 combined
Chapter 3 gateway 123 combinedChapter 3 gateway 123 combined
Chapter 3 gateway 123 combined
 
MAPS AND GLOBES PRESENTATION FOR SCHOOL STUDENTS
MAPS AND GLOBES PRESENTATION FOR SCHOOL STUDENTSMAPS AND GLOBES PRESENTATION FOR SCHOOL STUDENTS
MAPS AND GLOBES PRESENTATION FOR SCHOOL STUDENTS
 
What is Map.pptx
What is Map.pptxWhat is Map.pptx
What is Map.pptx
 
What is Map.pptx
What is Map.pptxWhat is Map.pptx
What is Map.pptx
 
Land Navigation Presentation
Land Navigation PresentationLand Navigation Presentation
Land Navigation Presentation
 
Ch 1 (maps & diagrams)
Ch 1 (maps & diagrams)Ch 1 (maps & diagrams)
Ch 1 (maps & diagrams)
 
Geographic Information System(GIS).pptx
Geographic  Information System(GIS).pptxGeographic  Information System(GIS).pptx
Geographic Information System(GIS).pptx
 
Map Reading
Map ReadingMap Reading
Map Reading
 
Topographic maps
Topographic mapsTopographic maps
Topographic maps
 
map reading unit 1.pdf
map reading unit 1.pdfmap reading unit 1.pdf
map reading unit 1.pdf
 
Maps and location
Maps and locationMaps and location
Maps and location
 
kegy305.pdf
kegy305.pdfkegy305.pdf
kegy305.pdf
 
kegy305.pdf
kegy305.pdfkegy305.pdf
kegy305.pdf
 
Lecture 03 map
Lecture 03 mapLecture 03 map
Lecture 03 map
 
Social Science Unit 1 Our World presentation
Social Science Unit 1 Our World presentationSocial Science Unit 1 Our World presentation
Social Science Unit 1 Our World presentation
 
BOLTSS - Mapping Geography
BOLTSS - Mapping GeographyBOLTSS - Mapping Geography
BOLTSS - Mapping Geography
 
Cartography – plotting the world
Cartography – plotting the worldCartography – plotting the world
Cartography – plotting the world
 
Maps ppt
Maps pptMaps ppt
Maps ppt
 
Orienteering 101
Orienteering 101Orienteering 101
Orienteering 101
 

Más de DUSABIMANA Jean D Amour

Más de DUSABIMANA Jean D Amour (17)

Unit 15 Power and Energy in Rwanda.pptx
Unit 15 Power and Energy in Rwanda.pptxUnit 15 Power and Energy in Rwanda.pptx
Unit 15 Power and Energy in Rwanda.pptx
 
Unit 17 Transport, communication and Trade in Rwanda....pptx
Unit 17 Transport, communication and Trade in Rwanda....pptxUnit 17 Transport, communication and Trade in Rwanda....pptx
Unit 17 Transport, communication and Trade in Rwanda....pptx
 
Unit 11 Agriculture in Rwanda.pptx
Unit 11 Agriculture in Rwanda.pptxUnit 11 Agriculture in Rwanda.pptx
Unit 11 Agriculture in Rwanda.pptx
 
Unit 10 Rural and urban settlement.pptx
Unit 10 Rural and urban settlement.pptxUnit 10 Rural and urban settlement.pptx
Unit 10 Rural and urban settlement.pptx
 
Unit 7 Vegetation in Rwanda.pptx
Unit 7 Vegetation in Rwanda.pptxUnit 7 Vegetation in Rwanda.pptx
Unit 7 Vegetation in Rwanda.pptx
 
Unit 8 Drainage system in Rwanda.pptx
Unit 8 Drainage system in Rwanda.pptxUnit 8 Drainage system in Rwanda.pptx
Unit 8 Drainage system in Rwanda.pptx
 
Unit 6 Climate in Rwanda.pptx
Unit 6 Climate in Rwanda.pptxUnit 6 Climate in Rwanda.pptx
Unit 6 Climate in Rwanda.pptx
 
Unit 9 Population.pptx
Unit 9 Population.pptxUnit 9 Population.pptx
Unit 9 Population.pptx
 
Unit 4 Rocks and minerals.pptx
Unit 4 Rocks and minerals.pptxUnit 4 Rocks and minerals.pptx
Unit 4 Rocks and minerals.pptx
 
Unit 1 Fieldwork techniques.pptx
Unit 1 Fieldwork techniques.pptxUnit 1 Fieldwork techniques.pptx
Unit 1 Fieldwork techniques.pptx
 
Unit 5 Soils in Rwanda.pptx
Unit 5 Soils in Rwanda.pptxUnit 5 Soils in Rwanda.pptx
Unit 5 Soils in Rwanda.pptx
 
Unit 3 Earth In relation to the universe.pdf
Unit 3 Earth In relation to the universe.pdfUnit 3 Earth In relation to the universe.pdf
Unit 3 Earth In relation to the universe.pdf
 
Unit 5 Forms of Relief.pdf
Unit 5 Forms of Relief.pdfUnit 5 Forms of Relief.pdf
Unit 5 Forms of Relief.pdf
 
Unit 7 Soils.pdf
Unit 7 Soils.pdfUnit 7 Soils.pdf
Unit 7 Soils.pdf
 
Unit 6 Rocks.pdf
Unit 6 Rocks.pdfUnit 6 Rocks.pdf
Unit 6 Rocks.pdf
 
UNIT 1 INTRODUCTION TO GEOGRAPHY.pdf
UNIT 1 INTRODUCTION TO GEOGRAPHY.pdfUNIT 1 INTRODUCTION TO GEOGRAPHY.pdf
UNIT 1 INTRODUCTION TO GEOGRAPHY.pdf
 
Unit 4 Internal Structure of the Earth.pdf
Unit 4 Internal Structure of the Earth.pdfUnit 4 Internal Structure of the Earth.pdf
Unit 4 Internal Structure of the Earth.pdf
 

Último

Russian Escort Service in Delhi 11k Hotel Foreigner Russian Call Girls in Delhi
Russian Escort Service in Delhi 11k Hotel Foreigner Russian Call Girls in DelhiRussian Escort Service in Delhi 11k Hotel Foreigner Russian Call Girls in Delhi
Russian Escort Service in Delhi 11k Hotel Foreigner Russian Call Girls in Delhi
kauryashika82
 
Activity 01 - Artificial Culture (1).pdf
Activity 01 - Artificial Culture (1).pdfActivity 01 - Artificial Culture (1).pdf
Activity 01 - Artificial Culture (1).pdf
ciinovamais
 
An Overview of Mutual Funds Bcom Project.pdf
An Overview of Mutual Funds Bcom Project.pdfAn Overview of Mutual Funds Bcom Project.pdf
An Overview of Mutual Funds Bcom Project.pdf
SanaAli374401
 
1029-Danh muc Sach Giao Khoa khoi 6.pdf
1029-Danh muc Sach Giao Khoa khoi  6.pdf1029-Danh muc Sach Giao Khoa khoi  6.pdf
1029-Danh muc Sach Giao Khoa khoi 6.pdf
QucHHunhnh
 
The basics of sentences session 2pptx copy.pptx
The basics of sentences session 2pptx copy.pptxThe basics of sentences session 2pptx copy.pptx
The basics of sentences session 2pptx copy.pptx
heathfieldcps1
 

Último (20)

Russian Escort Service in Delhi 11k Hotel Foreigner Russian Call Girls in Delhi
Russian Escort Service in Delhi 11k Hotel Foreigner Russian Call Girls in DelhiRussian Escort Service in Delhi 11k Hotel Foreigner Russian Call Girls in Delhi
Russian Escort Service in Delhi 11k Hotel Foreigner Russian Call Girls in Delhi
 
Código Creativo y Arte de Software | Unidad 1
Código Creativo y Arte de Software | Unidad 1Código Creativo y Arte de Software | Unidad 1
Código Creativo y Arte de Software | Unidad 1
 
Activity 01 - Artificial Culture (1).pdf
Activity 01 - Artificial Culture (1).pdfActivity 01 - Artificial Culture (1).pdf
Activity 01 - Artificial Culture (1).pdf
 
Unit-IV; Professional Sales Representative (PSR).pptx
Unit-IV; Professional Sales Representative (PSR).pptxUnit-IV; Professional Sales Representative (PSR).pptx
Unit-IV; Professional Sales Representative (PSR).pptx
 
An Overview of Mutual Funds Bcom Project.pdf
An Overview of Mutual Funds Bcom Project.pdfAn Overview of Mutual Funds Bcom Project.pdf
An Overview of Mutual Funds Bcom Project.pdf
 
Advanced Views - Calendar View in Odoo 17
Advanced Views - Calendar View in Odoo 17Advanced Views - Calendar View in Odoo 17
Advanced Views - Calendar View in Odoo 17
 
1029-Danh muc Sach Giao Khoa khoi 6.pdf
1029-Danh muc Sach Giao Khoa khoi  6.pdf1029-Danh muc Sach Giao Khoa khoi  6.pdf
1029-Danh muc Sach Giao Khoa khoi 6.pdf
 
ICT Role in 21st Century Education & its Challenges.pptx
ICT Role in 21st Century Education & its Challenges.pptxICT Role in 21st Century Education & its Challenges.pptx
ICT Role in 21st Century Education & its Challenges.pptx
 
Basic Civil Engineering first year Notes- Chapter 4 Building.pptx
Basic Civil Engineering first year Notes- Chapter 4 Building.pptxBasic Civil Engineering first year Notes- Chapter 4 Building.pptx
Basic Civil Engineering first year Notes- Chapter 4 Building.pptx
 
Sports & Fitness Value Added Course FY..
Sports & Fitness Value Added Course FY..Sports & Fitness Value Added Course FY..
Sports & Fitness Value Added Course FY..
 
The basics of sentences session 2pptx copy.pptx
The basics of sentences session 2pptx copy.pptxThe basics of sentences session 2pptx copy.pptx
The basics of sentences session 2pptx copy.pptx
 
Web & Social Media Analytics Previous Year Question Paper.pdf
Web & Social Media Analytics Previous Year Question Paper.pdfWeb & Social Media Analytics Previous Year Question Paper.pdf
Web & Social Media Analytics Previous Year Question Paper.pdf
 
Introduction to Nonprofit Accounting: The Basics
Introduction to Nonprofit Accounting: The BasicsIntroduction to Nonprofit Accounting: The Basics
Introduction to Nonprofit Accounting: The Basics
 
Ecological Succession. ( ECOSYSTEM, B. Pharmacy, 1st Year, Sem-II, Environmen...
Ecological Succession. ( ECOSYSTEM, B. Pharmacy, 1st Year, Sem-II, Environmen...Ecological Succession. ( ECOSYSTEM, B. Pharmacy, 1st Year, Sem-II, Environmen...
Ecological Succession. ( ECOSYSTEM, B. Pharmacy, 1st Year, Sem-II, Environmen...
 
Mehran University Newsletter Vol-X, Issue-I, 2024
Mehran University Newsletter Vol-X, Issue-I, 2024Mehran University Newsletter Vol-X, Issue-I, 2024
Mehran University Newsletter Vol-X, Issue-I, 2024
 
INDIA QUIZ 2024 RLAC DELHI UNIVERSITY.pptx
INDIA QUIZ 2024 RLAC DELHI UNIVERSITY.pptxINDIA QUIZ 2024 RLAC DELHI UNIVERSITY.pptx
INDIA QUIZ 2024 RLAC DELHI UNIVERSITY.pptx
 
microwave assisted reaction. General introduction
microwave assisted reaction. General introductionmicrowave assisted reaction. General introduction
microwave assisted reaction. General introduction
 
Nutritional Needs Presentation - HLTH 104
Nutritional Needs Presentation - HLTH 104Nutritional Needs Presentation - HLTH 104
Nutritional Needs Presentation - HLTH 104
 
PROCESS RECORDING FORMAT.docx
PROCESS      RECORDING        FORMAT.docxPROCESS      RECORDING        FORMAT.docx
PROCESS RECORDING FORMAT.docx
 
Paris 2024 Olympic Geographies - an activity
Paris 2024 Olympic Geographies - an activityParis 2024 Olympic Geographies - an activity
Paris 2024 Olympic Geographies - an activity
 

Unit 2 Elements of a map.pdf

  • 1. Unit two: Elements of a map Map of Africa
  • 2. Introduction What is a map? A map is a representation of the features of an area of the earth on a flat surface. The area could be on land or sea. A map usually shows physical features such as mountains, rivers, valleys, cities, roads, etc.
  • 3. Elements of a map A good map has specific features. These features are commonly referred to as the elements of a map. N.B: The elements of a map are not part of the information that is represented in a map. They are therefore usually placed at the margins.
  • 5. Is this map good? Either way, explain why.
  • 6. The following are the major elements of a good map. Element Description Title This shows the information that is contained in a map. A key It helps a map reader to understand the symbols, colours and signs used. A key is important since it helps one to understand the contents of a map in detail A compass This shows the direction of various features that are shown on map. The directions are usually in relation to the cardinal points of a compass. They are North, South, West and East. Scale This shows the relationship between the distance on the map and that of the ground. A scale helps cartographers to draw a large area of the earth’s surface on a small sheet of a paper. Frame This is a line that surrounds a map showing its limitation
  • 7. Symbols and signs used on maps A symbol is something that is used for or regarded as representing something else. The symbols are usually in the form of short-hand characters, pictorial presentations or colours.
  • 8. Some of the features represented on a key are shown below
  • 9.
  • 10. Drawing sketch maps A sketch map is an outline map that is drawn from observation. It does not use exact measurements. It only shows the main features of an area. Characteristics of sketch maps
  • 11. Sketch maps have the following features that distinguish them from other maps. • They are drawn roughly. • They are not drawn to the scale. • They represent few features for the interests of the user. • They are less detailed as compared to topographical maps. • They are simple and hence easy to understand. • They have the elements of a good map such as the title, key, frame and compass.
  • 12. Steps involved in drawing a sketch map 1.Identify and point out the features to be represented. 2.Place the identified elements in order according to the divisions of the landscape (background, middle ground and the fore ground) 3.Draw the actual sketch map, representing it in a simple way. 4.Select a suitable title that accurately shows the purpose of the sketch map.
  • 13. Sketch map of school
  • 14. Homework •Draw a sketch map of Hope Haven School.
  • 15. Indicators of relief on maps •The term relief in geography refers to the nature and outlook of a landscape. •Relief usually refers to the highest and lowest elevation points in an area. •Mountains and ridges are the highest elevation points, while valleys are the lowest.
  • 16. The relief features represented on maps include the following: •Mountains •Hills •Rivers •Lakes •Plains (low land areas) •Escarpments/ rift valley • Fault lines •Swamps
  • 17. Methods of presenting relief on maps 1. Layer tinting: This is the use of color to show different relief features in relation to various heights. The color or shade used varies from dark shades (Higher Altitudes) to light shades (Lower altitudes). 2.Trigonometric stations: These are fixed surveying stations that are used for land surveys. They are of three types:
  • 19. 3.Spot heights These are dots used to represent specific areas on a topographical map.
  • 20. 4. Contours are lines drawn on maps joining areas with the same height above sea level. They show both the height and steepness of a place. Characteristics of contour lines ✓These lines are usually drawn at intervals called contour intervals. ✓The contour lines never cross each other. ✓The lines are usually brown in color. ✓In steep areas, the lines are very close to each other. ✓In areas with gentle gradients, the lines are far apart. ✓They have the height number written on them. ✓They are drawn based on a specific and uniform interval.
  • 21.
  • 23. Interpretation of contours on a topographical map Contours are used on maps to represent various landforms like: ❖Conical hills: These are types of hills that have round tops with slopes that are similar in gradient and appearance. Contour lines representing a conical hill with uneven gradient
  • 24. ❖Flat-topped hills: their tops are generally flat. The contour lines representing these hills are wide apart at the top, but start getting close together towards the lower parts of the hills.
  • 25. • Hills with depressions: These are hills which have depressions at their tops. They are represented by contours that are ring shaped.
  • 26. • Depression craters: these are hills or mountains that have deep depressions usually containing water. An example is Mt. Bisoke in Rwanda. Such hills or mountains are represented by ring-shaped contour lines. Mt Bisoke crater
  • 27. • Ridges: This is an elongated or stretched out hill, or a range of hills that are close together. The contour lines representing ridges are elongated or sometimes oval shaped. Ridge are separated from each other by gaps called saddles which are broad gaps or cols which are narrow gaps Ridge
  • 28. • Escarpments: These are physical features that have two distinctively different slopes. ❖Steep side (scarp slope) is represented by contours close together ❖Gentle side (dip slope) is represented by contours that are far apart from each other.
  • 29. • Slopes: A slope refers to the surface of the earth whereby one end is at a higher level than the other. Types of slopes and how they are represented on topographical maps 1. Concave slope: The contours that represent this slope are close together towards the top because the land is steep at the top and gently slopes towards the base.
  • 30. •Convex slopes: This is a slope that is gentle towards the top and steep towards the base and the contours are widely spaced at top and closely spaced at base.
  • 31.
  • 32. ❖Steep slope: this represented by contours that are very close together. This is due to the uniform steepness of the slopes or land.
  • 33. ❖Gentle slopes: this is represented by contours that are uniformly spaced because the slope is uniformly gentle.
  • 34. ❖Flat land or plains: This is represented by contours that are uniformly widely spaced. E.g. swamps.
  • 35. ❖Even slope: This is a slope where the land has an almost similar gradient. The contour lines are equally spaced.
  • 36. There are other indicators of relief used on maps ✓Hachuring: This method is used to show the altitude of an area with steep gradients and are represented using short parallel lines. However, they do not reveal the actual heights. Hachuring
  • 37. ✓Pictorial method: It uses symbols based on the appearance of the features. It shows how features appear from above. For example, mountains are raised while valleys are sunken. Valleys are sunken
  • 38. ✓Hill shading: this represent relief by carefully using light and shadow. The darker expressions are used to represent the steep slopes. Shading Bright expressions are used to represent hill tops and areas with gentle gradients like valley bottoms and plains or flat lands.
  • 39. The darker expressions are used to represent the steep slopes Bright expressions are used to represent hill tops and areas with gentle gradients like valley bottoms and plains or flat lands.
  • 40. What indicator of relief used on map below?
  • 41. What indicator of relief used on map below?
  • 42. Maps and aerial photographs Map is a representation on a flat surface of a whole or part of an area. Maps represent parts of the earth’s surface drawn to scale. A photograph is a picture created using a camera and stored digitally. An aerial photograph is a picture of the earth’s surface taken from above. Aerial Photo Map of Kigali
  • 43.
  • 44.
  • 45.
  • 46. A map showing the districts of Rwanda.
  • 47. Difference between maps and aerial photographs Maps Aerial Photographs This is a representation of a part of the earth’s surface is a picture taken from a raised platform representing a small of an area They are drawn to scale. Not taken to scale. It represents a relatively large area. It only covers a small area or object. The features used on a map are interpreted by use of symbols. The features are clearly seen without the use of symbols. A map is sometimes difficult to interpret. An aerial photograph is easy to interpret. It is prepared selectively. shows all features that are near a place, A map is difficult to come up with. It is relatively easier to take a photograph A map has a key that helps readers to interpret and understand it. An aerial photograph has no key. A map has no skyline An aerial photograph has a skyline A map has a compass that shows the direction of various parts on it. An aerial photograph does not have a compass
  • 48. Atlas index An atlas is a collection of maps of the Earth or regions of the Earth. However, there are atlases of other planets too. An atlas is usually a bound book with a collection of maps. Atlases usually present geographical features, political boundaries, geopolitical, social, religious and economic statistics. An atlas index is a detailed alphabetical listing of names, places and topics. Elements of an atlas index ❖It shows various topics and names of places. ❖It is at the last pages of the atlas. ❖It lists a summary of the specific contents of the atlas. ❖It acts as a pointer. ❖It directs the reader to specific pages where given topics ❖It follows a systematic alphabetical or numerical order.
  • 49.
  • 50. End of unit assessment S1B/20marks 1. What is a map? 2marks 2. Identify and explain the elements of good map. 5marks 3. What is a contour? 2marks 4. Identify the characteristics of contours. 3marks 5. What is the difference between map and aerial photographs. 4marks 6. Name different methods of showing relief on topographical maps. 4marks
  • 51. End of unit assessment S1C/20marks 1. What is an atlas? 2marks 2. Identify and explain the elements of good map. 5marks 3. Identify the characteristics of contours. 3marks 4. What is the difference between a map and aerial photograph. 5marks 5. Name 4 different methods of showing relief on topographical maps. 2marks 6. Identify 3 elements of atlas index. 3marks
  • 52. End of unit assessment S1D/20marks 1. What is an atlas? 2marks 2. Identify and explain the elements of good map. 5marks 3. Identify the characteristics of contours. 3marks 4. What is the difference between a map and aerial photograph. 5marks 5. Name 4 different methods of showing relief on topographical maps. 2marks 6. Identify any 3 elements of atlas index. 3marks
  • 53. End of unit assessment S1A/20marks 1. What is a sketch map? 2marks 2. Sketch maps have features that distinguish them from other maps. Name any 3 of those features. 3marks 3. Identify and explain the elements of good map. 4marks 4. Identify the characteristics of contours. 3marks 5. What is the difference between map and aerial photographs. 4marks 6. Name different methods of showing relief on topographical maps. 4marks