Graficos
•Descargar como PPTX, PDF•
0 recomendaciones•268 vistas

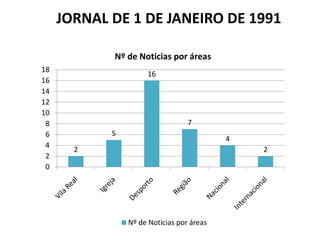
El documento contiene gráficos que muestran el número de noticias por área en diferentes ediciones de periódicos de 1991, 1987 y 2011. Los gráficos muestran que las áreas de noticias más cubiertas variaron entre las ediciones, con las noticias nacionales e internacionales siendo más frecuentes en 2011 y las noticias locales y regionales predominando en 1991 y 1987.

Recomendados
Más contenido relacionado
Destacado
Destacado (20)
Graficos
- 1. JORNAL DE 1 DE JANEIRO DE 1991 Nº de Noticias por áreas 18 16 16 14 12 10 8 7 6 5 4 4 2 2 2 0 Nº de Noticias por áreas
- 2. JORNAL DE 26 DE SETEMBRO DE 1987 Nº de notícias por área 9 8 8 8 7 6 5 4 4 3 Nº de notícias por área 2 2 1 1 1 0
- 3. JORNAL DE 17 DE NOVEMBRO DE 2011 Nº de Notícias por área 45 41 40 35 30 24 25 21 20 15 Nº de Notícias por área 10 7 6 5 0 0 0
- 4. JORNAL DE 21 DE JULHO DE 2011 Nº de Notícias por cada área 35 30 30 25 24 20 15 13 10 Nº de Notícias por cada 10 área 5 4 0 0 0
- 5. CONCLUSÃO DE JORNAIS DE 1991 E 1987 Nº de notícias por cada área 25 20 20 19 15 13 10 5 5 4 3 0 Vila Real Igreja Desporto Região Nacional Internacional
- 6. CONCLUSÃO DE JORNAIS DE 2011 Nº de Notícias por área 60 54 51 50 48 40 30 20 16 11 10 0 0 0