

Recomendados
Recomendados
Más contenido relacionado
La actualidad más candente
La actualidad más candente (8)
Destacado
Destacado (9)
Similar a Kalman Graffi - 15 Slide on Monitoring P2P Systems - 2010
Similar a Kalman Graffi - 15 Slide on Monitoring P2P Systems - 2010 (20)
Más de Kalman Graffi
Más de Kalman Graffi (19)
Último
Último (20)
Kalman Graffi - 15 Slide on Monitoring P2P Systems - 2010
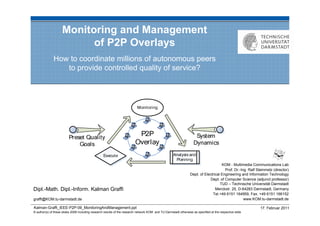
- 1. Monitoring and Management of P2P Overlays How to coordinate millions of autonomous peers to provide controlled quality of service? KOM - Multimedia Communications Lab Prof. Dr.-Ing. Ralf Steinmetz (director) Dept. of Electrical Engineering and Information Technology Dept. of Computer Science (adjunct professor) TUD – Technische Universität Darmstadt Dipl.-Math. Dipl.-Inform. Kalman Graffi Merckstr. 25, D-64283 Darmstadt, Germany Tel.+49 6151 164959, Fax. +49 6151 166152 graffi@KOM.tu-darmstadt.de www.KOM.tu-darmstadt.de Kalman-Graffi_IEEE-P2P-09_MonitoringAndManagement.ppt 17. Februar 2011 © author(s) of these slides 2008 including research results of the research network KOM and TU Darmstadt otherwise as specified at the respective slide
- 2. The Peer-to-Peer Paradigm Peer-to-peer systems Users build infrastructure Service is provided from users to users Peer-to-peer overlays Connecting all peers, providing new functionality H(„my data“) = 3107 1008 1622 2011 709 2207 E.g. Distributed Hash Tables, keyword-based search ? 611 3485 2906 12.5.7.31 peer-to-peer.info planet-lab.org berkeley.edu 61.51.166.150 95.7.6.10 86.8.10.18 7.31.10.25 Evolution of applications / QoS demands File sharing No Quality of Service (QoS) requirements Voice over IP Real-time requirements Video-on-demand Real-time and bandwidth requirements Online community platforms Potential for high user interaction See: K. Graffi, AsKo, et al. “Peer-to-Peer Forschung - Überblick und Herausforderungen” KOM – Multimedia Communications Lab 2 In: it - Information Technology (Methods and Applications of Informatics and Information Technology), vol. 46, no. 5, p. 272-279, July 2007
- 3. Dynamics and Modularization as Challenge Dynamics in P2P System: Modularization of Software Various scenarios Enables rapid software development Distributed storage Results in non-optimized components Content delivery Need for: Discovery and contacting of users Monitoring Component Dynamics over time Quality Managment Component Network size Churn Peer heterogeneity Peer capacities Connectivity KOM – Multimedia Communications Lab 3
- 4. Dynamics in P2P System Various scenarios Distributed storage Content delivery User Discovery and contacting of users Application Manage- Dynamics over time ment Overlay Network size Churn Devices Peer heterogeneity Network Peer capacities Connectivity Frequent changes in the quality of the p2p system Monitoring needed KOM – Multimedia Communications Lab 4
- 5. System- and Peer-specific Information Global system statistics Peer-specific information Statistics: Capacities: Average CPU usage Max / current bandwidth Average bandwidth utilization Operating System, Java version Average hop count CPU power Messages sent / received Free disk space Number of peers Responsibility range Message sizess Parent coordinator … … Statistical information: List-based concatenation avg, min, max, standard dev., sum,... E.g. peer 101, up bandwidth 27kb/s, … Information is aggragatable: Information is NOT aggragatable: Size of information remains the same Size of information grows with number Independent of number of peers of peers Leads to overhead issues K. Graffi et al. “SkyEye.KOM: An Information Management Over-Overlay for Getting the Oracle View on Structured P2P Systems”Communications Lab KOM – Multimedia 5 IEEE International Conference on Parallel and Distributed Systems (IEEE ICPADS ‘08), December 2008
- 6. General Challenges for the Approach Robustness Handling Churn Coping with Link-Losses Scalability Scaling in terms of participating peers Scaling in terms of exchanged information Performance High precision, low outliers Efficiency Lightweight solution Minimize complexity: easier to use, more robust Applicability Applicable on every (KBR-compatible) structured p2p overlay Independent of any application K. Graffi et al. “SkyEye.KOM: An Information Management Over-Overlay for Getting the Oracle View on Structured P2P Systems”Communications Lab KOM – Multimedia 6 IEEE International Conference on Parallel and Distributed Systems (IEEE ICPADS ‘08), December 2008
- 7. SkyEye.KOM – Architecture Design Decisions Integrated vs. new layer New layer allows wider applicability Set on top of KBR-compatible structured p2p overlays Reactive vs. proactive System state information is continuously interesting for all users Allows for fast queries Monitoring topology: bus, ring, star, mesh, tree Tree structure alleviate information aggregation Fixed out and in degree Position assignment: dynamic vs. deterministic Deterministic IDs used in topology, dynamically resolved with DHT For all structured P2P overlays Covered by DHT-function: route(msg, key), lookup(key) Usable by all functional layers/modules in the P2P system K. Graffi et al. “SkyEye.KOM: An Information Management Over-Overlay for Getting the Oracle View on Structured P2P Systems”Communications Lab KOM – Multimedia 7 IEEE International Conference on Parallel and Distributed Systems (IEEE ICPADS ‘08), December 2008
- 8. Topology of SkyEye.KOM Coordinator_ID 0,5 Concept of Over-overlay C0 Built on underlying structured overlay C_ID 0,25 C_ID 0,75 1 1 Unified ID space [0,1] decouples C C C_ID 0,125 C_ID 0,625 C_ID 0,875 from specific DHT implementation 2 2 C2 C_ID 0,375 C C Communicates via common API C2 route(msg, key) C_ID 0,3125 C3 Information Domains: 0,09 0,2 0,31 0,4 0,5 0,6 0,75 0,9 Peer ID determines position in tree 0 1 Receive information from children nodes Sends aggregated information to father 50 1 node (Coordinator) 45 10 DHT 15 40 20 30 Protocols for monitoring System-specific information Peer-specific information K. Graffi et al. “SkyEye.KOM: An Information Management Over-Overlay for Getting the Oracle View on Structured P2P Systems”Communications Lab KOM – Multimedia 8 IEEE International Conference on Parallel and Distributed Systems (IEEE ICPADS ‘08), December 2008
- 9. Overview on SkyEye.KOM Topology Statistic updates Tree based information architecture Periodically sent to parent peer Uses p2p overlay functionality Aggregated in each node ( same size) [µ,σ,σ²,Σ, min,max] 0,09 0,2 0,3 0,4 0,51 0,6 0,75 0,9 0 1 [µ,σ,σ²,Σ, 50 1 min,max] 10 45 15 40 20 [µ,σ,σ²,Σ, 30 min,max] KOM – Multimedia Communications Lab 9
- 10. Overview on SkyEye.KOM Topology Statistic updates Tree based information architecture Periodically sent to parent peer Uses p2p overlay functionality Aggregated in each node ( same size) [µ,σ,σ²,Σ, 0,09 0,2 0,3 0,4 0,51 0,6 0,75 0,9 min, max] 0 1 [µ,σ,σ²,Σ, 50 1 min, max] 10 45 15 40 20 30 [µ,σ,σ²,Σ, min, max] KOM – Multimedia Communications Lab 10
- 11. Some Remarks on SkyEye.KOM and Monitoring System Statistics Why is it generally applicable on DHTs? Unified ID space, using core DHT functions (Key based Routing API) Coordinator_ID C 0 0,5 Why is it robust against churn? C_ID 0,25 C_ID 1 1 0,75 If peer fails: automatically replaced in the DHT C C Updates are routed to new peer for aggregation C_ID 0,125 C_ID 0,625 C_ID 0,875 2 2 C2 C_ID 0,375 C C 2 C Why are costs low? C_ID One update: ~1kb, 0,3125 C3 Out + in degree = 1 + tree degree (2 or 4) Independent of position in the tree! 0,09 0,2 0,31 0,4 0,5 0,6 0,75 0,9 0 1 Age of information: 50 1 Limited by tree depth, O(log (N)) 10 45 DHT Influenced by update period 15 40 20 30 Just two message types: Update, ACK Assumed functions: route(msg, key), amIresponsible(key) KOM – Multimedia Communications Lab 11
- 12. Gathering Peer-specific Information Type of information Individual Peer ID and peer specific information: Free storage space, CPU power, bandwidth capabilities, online time, … Responsibility range, node degree, Coordinator ID, … Desired query Capacity-based peer search: Find N peers with e.g. node degree > 20, free storage space > 10MB, online time > 10h Design decision: proactive Constantly gathering peer information in the tree Query directly accesses prepared data Better for scenarios with frequent queries Challenge: Information cannot be aggregated grows in size Costs may overload the Coordinators Solution idea: replace weak peers in tree with strong Support Peers KOM – Multimedia Communications Lab 12
- 13. Gathering Peer-specific Information Supporting Peers for Load Balancing Coordinator Support Peer Peer Each peer defines max. load Coordinator may choose strong Supporting Peers Workload delegated to supporting peer Good peers chosen by 50/50 ratio Pick e.g. 2 best peers in the domain Unified ID space and abstr. functions Best peer advertised one level up For SP: best 10 peers in the tree Second best peer used best 1-5 best 1-5 Results For SP: best 5-10 from below In a tree with strong peers Best peers at the top, best 1-5 best 1-5 carrying most of the load No peer is overloaded For SP: best 6-10 For SP: best 6-10 KOM – Multimedia Communications Lab 13
- 14. Gathering Peer-specific Information: Protocol Update information: Query format: Peer 11, RAM = 700MB, Online = 12h 5_of_ RAM_>_1024_Int,CPU_>2048_Int … Threshold 150MB Query C0 Match 1 C0 15MB Match 2 Match 3 Threshold 50MB 42MB 37MB C1 C1 11MB 20MB Query Threshold 10MB 16MB Match 1 15MB Match 2 C2 SP C2 SP Threshold Query 200MB Query Query 10MB Match 1 Threshold Address Match 1 20MB 20MB of the Match 2 10MB Support-Peer Match 3 Match 4 C3 C3 Match 5 10MB KOM – Multimedia Communications Lab 14
- 15. Summary on Monitoring Solution SkyEye.KOM Monitoring scope: System-specific information: statistics on system-wide metrics Peer-specific information: detailed view on capabilities of individual peers For all structured P2P overlays Covered by KBR-function: route(msg, key), lookup(key) Usable by all functional layers in the P2P system Features: Overlay-independency Robustness, churn resistance No overloaded peer Supporting peer heterogeneity Low overhead KOM – Multimedia Communications Lab 15
- 16. Simulation Setup Evaluated in PeerfactSim.KOM PeerfactSim.KOM User Simulation Setup Application Simulation Engine IdealDHT: Dispatches messages to responsible peer Manage- ment 5000 Nodes Overlay Delay model: global network positioning Churn model: based on KAD measurements (Steiner et al.) Transport Network Metrics Monitored and real metrics Relative monitoring error Monitoring age Traffic overhead KOM – Multimedia Communications Lab 16
- 17. System Monitoring Performance Tree degree = 4 Update interval = 60sec K.See: K.D. Stingl et al.“Monitoringand Management ofof Structured Peer-to-Peer Systems” IEEE P2P 2009 Graffi, Graffi et al., “Monitoring and Management Structured P2P Systems” submitted to KOM – Multimedia Communications Lab 17 In: IEEE Peer-to-Peer Computing '09 (IEEE P2P’09), September 2009.
- 18. System Monitoring Costs Tree degree = 4 Update interval = 60sec K.See: K.D. Stingl et al.“Monitoringand Management ofof Structured Peer-to-Peer Systems” IEEE P2P 2009 Graffi, Graffi et al., “Monitoring and Management Structured P2P Systems” submitted to KOM – Multimedia Communications Lab 18 In: IEEE Peer-to-Peer Computing '09 (IEEE P2P’09), September 2009.
- 19. SkyEye.KOM: Tree Growth and Depth Logarithmic Tree Depth Example tree Tree degree (TD) = 2 Balanced, if ID space balanced Peers may be Coordinators at various levels not always 2 children KOM – Multimedia Communications Lab 19
- 20. SkyEye.KOM: General Parameter Variation Bandwidth consumption related to Precision / Age of information Out-bandwidth: update intervals (UI) Freshness tightly related to tree depth In-bandwidth: Proportional related to update interval update intervals, tree degree (TD) Information age: O(logTD N) * UI Costs for system-specific monitoring Costs: Can be kept < 100 byte / s Controllable quality and costs KOM – Multimedia Communications Lab 20
- 21. SkyEye.KOM: Smoothing of System Monitoring Exponential smoothing: Results: Weighted sum of history of Very precise monitoring measurements Capturing the status of a few UI before Weights decrease exponentially for older Low relative error in monitoring measurements History size H, exponential factor a KOM – Multimedia Communications Lab 21
- 22. Testbed Setup Setup Scenario Up to 500 peers (on 37 PCs) Churn levels tested: 10,000 sec of simulation time 10%, 20%, 50% leaving nodes, Test-bed is good for evaluating random churn Costs in a real deployment Statistics and capacities are updated Less suitable for precision every 5 seconds KOM – Multimedia Communications Lab 22
- 23. Testbed: Number of Peers ~20% leaving 2 x ~50 % leaving ~10% leaving Number of Nodes Random churn Time [s] KOM – Multimedia Communications Lab 23
- 24. Testbed: Number of Peers per Tree Level With ~ 500 Peers most peers are located at level 7 and 8 Peers join and leave at all levels of the tree KOM – Multimedia Communications Lab 24
- 25. Testbed: Location of the Peers in the Tree Distribution of nodes in the levels 0 to 7 follows the function f ( x) = 2 x due to binary tree structure here: TD = 2 KOM – Multimedia Communications Lab 25
- 26. Testbed: Costs, Average Bandwidth Utilization Average bandwidth utilization of 3 KB/s Bandwidth utilization increases with increasing number of peers High bandwidth required for nodes at higher levels Please note: Update interval: 5s KOM – Multimedia Communications Lab 26
- 27. Testbed: Average Traffic per Peer per Level Bandwidth utilization increases towards the root Due to monitoring not-aggragatable peer-specific information However, no peer is overloaded KOM – Multimedia Communications Lab 27
- 28. Testbed: Topology of the Tree Topology link to Coordinator responsibility range With 44 Peers 8 tree levels are used (2 above minimum) Minimum (=O(logN)) not reached due to non uniform peer ID distribution KOM – Multimedia Communications Lab 28
- 29. Summary on Monitoring in Structured P2P Systems Peer-specific global view Provides capacity-based peer search for monitored peer information Scope limited by the load limits of the individual peers Evaluation shows: Logarithmical tree depth, low average peer load Higher tree levels supported with strong Support Peers System-specific global view Provides global view on the quality of service of the system Rich system statistics, extendable, considering aggregatable metrics Evaluation shows: With smoothing: precise, low relative error Very low costs: due to aggregation and fixed node degree KOM – Multimedia Communications Lab 29