Taco Bell in Coachella, CA
•
2 recomendaciones•362 vistas

This document provides an offering memorandum for the rare 25-year lease of a Taco Bell property located in Coachella, California. It includes an executive summary that outlines the key details of the investment opportunity, including the long-term nature of the lease, the seasoned Taco Bell operator, and growth in the local area. Financial details are provided, such as the building and lot sizes, traffic counts, and lease terms. An overview of Taco Bell Corporation and information on opening a Taco Bell franchise are also summarized to provide context on the national brand and tenant.

Recomendados
Recomendados
Más contenido relacionado
La actualidad más candente
La actualidad más candente (17)
Similar a Taco Bell in Coachella, CA
Similar a Taco Bell in Coachella, CA (20)
Más de Kevin Boeve
Más de Kevin Boeve (20)
Último
Último (9)
Taco Bell in Coachella, CA
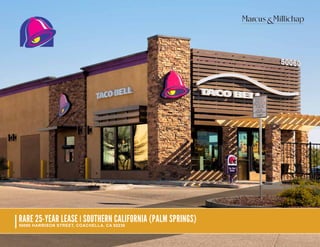
- 1. RARE 25-YEAR LEASE | SOUTHERN CALIFORNIA (PALM SPRINGS) 50060 HARRISON STREET, COACHELLA, CA 92236
- 2. The information contained in the following offering memorandum is proprietary and strictly confidential. It is intended to be reviewed only by the party receiving it from Marcus & Millichap and it should not be made available to any other person or entity without the written consent of Marcus & Millichap. By taking possession of and reviewing the information contained herein the recipient agrees to hold and treat all such information in the strictest confidence. The recipient further agrees that recipient will not photocopy or duplicate any part of the offering memorandum. If you have no interest in the subject property at this time, please return this offering memorandum to Marcus & Millichap. This offering memorandum has been prepared to provide summary, unverified financial and physical information to prospective purchasers, and to establish only a preliminary level of interest in the subject property. The information contained herein is not a substitute for a thorough due diligence investigation. Marcus & Millichap has not made any investigation, and makes no warranty or representation with respect to the income or expenses for the subject property, the future projected financial performance of the property, the size and square footage of the property and improvements, the presence or absence of contaminating substances, PCBs or asbestos, the compliance with local, state and federal regulations, the physical condition of the improvements thereon, or the financial condition or business prospects of any tenant, or any tenant’s plans or intentions to continue its occupancy of the subject property. The information contained in this offering memorandum has been obtained from sources we believe to be reliable;however,Marcus&Millichaphasnotverified,andwillnotverify,anyoftheinformationcontainedherein,norhasMarcus&Millichapconductedanyinvestigationregardingthesemattersandmakesnowarrantyorrepresentationwhatsoeverregardingtheaccuracyor completeness of the information provided. All potential buyers must take appropriate measures to verify all of the information set forth herein. Prospective buyers shall be responsible for their costs and expenses of investigating the subject property. ALL PROPERTY SHOWINGS ARE BY APPOINTMENT ONLY. PLEASE CONTACT THE MARCUS & MILLICHAP AGENT FOR MORE DETAILS. Marcus & Millichap hereby advises all prospective purchasers of Net Leased property as follows: The information contained in this Marketing Brochure has been obtained from sources we believe to be reliable. However, Marcus & Millichap has not and will not verify any of this information, nor has Marcus & Millichap conducted any investigation regarding these matters. Marcus & Millichap makes no guarantee, warranty or representation whatsoever about the accuracy or completeness of any information provided. As the Buyer of a net leased property, it is the Buyer’s responsibility to independently confirm the accuracy and completeness of all material information before completing any purchase. This Marketing Brochure is not a substitute for your thorough due diligence investigation of this investment opportunity. Marcus & Millichap expressly denies any obligation to conduct a due diligence examination of this Property for Buyer. Any projections, opinions, assumptions or estimates used in this Marketing Brochure are for example only and do not represent the current or future performance of this property. The value of a net leased property to you depends on factors that should be evaluated by you and your tax, financial and legal advisors. Buyer and Buyer’s tax, financial, legal, and construction advisors should conduct a careful, independent investigation of any net leased property to determine to your satisfaction with the suitability of the property for your needs. Like all real estate investments, this investment carries significant risks. Buyer and Buyer’s legal and financial advisors must request and carefully review all legal and financial documents related to the property and tenant. While the ten- ant’s past performance at this or other locations is an important consideration, it is not a guarantee of future success. Similarly, the lease rate for some properties, including newly-constructed facilities or newly-acquired locations, may be set based on a tenant’s projected sales with little or no record of actual performance, or comparable rents for the area. Returns are not guaranteed; the tenant and any guarantors may fail to pay the lease rent or property taxes, or may fail to comply with other material terms of the lease; cash flow may be interrupted in part or in whole due to market, economic, environmental or other conditions. Regardless of tenant history and lease guarantees, Buyer is responsible for conducting his/her own investigation of all matters affecting the intrinsic value of the property and the value of any long-term lease, including the likelihood of locating a replacement tenant if the current tenant should default or abandon the property, and the lease terms that Buyer may be able to negotiate with a potential replacement tenant considering the location of the property, and Buyer’s legal ability to make alternate use of the property. By accepting this Marketing Brochure you agree to release Marcus & Millichap Real Estate Investment Services and hold it harmless from any kind of claim, cost, expense, or liability arising out of your investigation and/or purchase of this net leased property. Confidentiality Agreement Net Leased Disclaimer
- 3. contents Executive Summary Investment Overview . . . . . . . . . . . . . . . . . . . . . . . . . . . . . . . . . . 2 Tenant Overview . . . . . . . . . . . . . . . . . . . . . . . . . . . . . . . . . . . . 3-4 Financial Overview Financial Overview . . . . . . . . . . . . . . . . . . . . . . . . . . . . . . . . . . 6-7 Property Description Aerial Maps . . . . . . . . . . . . . . . . . . . . . . . . . . . . . . . . . . . . . . . 9-10 Regional Map . . . . . . . . . . . . . . . . . . . . . . . . . . . . . . . . . . . . . . . 11 Market Overview Location Overview . . . . . . . . . . . . . . . . . . . . . . . . . . . . . . . . . . . 13 Demographics Map . . . . . . . . . . . . . . . . . . . . . . . . . . . . . . . . . . . . . . . . . . . . . . . . . 15 Summary Report . . . . . . . . . . . . . . . . . . . . . . . . . . . . . . . . . . . . . 16
- 5. This information has been secured from sources we believe to be reliable, but we make no representations or warranties, expressed or implied, as to the accuracy of the information. References to square footage or age are approximate. Buyer must verify the information and bears all risk for any inaccuracies. Any projections, opinions, assumptions or estimates used herein are for example purposes only and do not represent the current or future performance of the property. Marcus & Millichap Real Estate Investment Services is a service mark of Marcus & Millichap Real Estate Investment Services, Inc. © 2011 Marcus & Millichap ACT ID Y0080574 2 Marcus & Millichap is pleased to present for sale a brand new Taco Bell fast food restaurant in the city of Coachella, California. This oversized lot with 0.93 acres is located on the southeast corner of Harrison Street and Avenue 50. The lease features an initial term of 25-years with four, five-year options to extend. The lease rate increases 10 percent every five years during the initial lease term and during each option period. The subject property is located on Harrison Street, one block west of Highway 86 and three miles from Interstate 10 which creates great regional access to the property. Major retailers in the area include: Dollar Tree, Save A Lot Food Stores, and Family Dollar in the Coachella Shopping Center located directly west of the subject; Walgreens and McDonald’s surround the subject property on the north and south side and 99 Cents Only, Planet Fitness, and Cardena’s Market southwest of the subject property. Food 4 Less, Fallas Discount Stores, Wells Fargo, Rent-A-Center, and Also’s in the Gateway Center to the northwest of the subject. The Coachella Valley has seen tremendous growth over the past fifteen years and the subject neighbor- hood is no exception. The population within a three-mile radius of the subject has grown 64.2 percent since 2010 and is forecast to grow 15.9 percent by 2018. New housing development in the area has been focused on the construction of single-family residences, with the percentage of home ownership increas- ing from 49.8 percent in 2010 to 57.3 percent in 2013. The median household income has grown by 2.2 percent since 2000 and is forecast to increase 13.4 percent by 2018. overview Brand New Long Term Lease | 25-Year Initial Term With Four, Five-Year Options to Extend Seasoned Operator With Exclusive Experience Operating Taco Bells in the Desert, 12 Current Locations This Site is Recognized as the Number One Retail Location in the Southeastern Part of the Coachella Valley Stellar and Growing Traffic Counts Over 28,800 Cars Per Day Priced Below Replacement Cost Strategically Positioned Between Walgreens and McDonald’s investment highlights
- 7. This information has been secured from sources we believe to be reliable, but we make no representations or warranties, expressed or implied, as to the accuracy of the information. References to square footage or age are approximate. Buyer must verify the information and bears all risk for any inaccuracies. Any projections, opinions, assumptions or estimates used herein are for example purposes only and do not represent the current or future performance of the property. Marcus & Millichap Real Estate Investment Services is a service mark of Marcus & Millichap Real Estate Investment Services, Inc. © 2011 Marcus & Millichap ACT ID Y0080574 4 financial overview location 50060 Harrison Street Coachella, CA 92236 site The subject property has frontage along Harrison Street. square footage The building square footage is 2,100 square feet and the lot size is 0.93 acres. year built The property was built in 2016. traffic counts The intersection of Harrison Street and Avenue 50 receives 28,800 cars per day.
- 8. taco bell overview 5 This information has been secured from sources we believe to be reliable, but we make no representations or warranties, expressed or implied, as to the accuracy of the information. References to square footage or age are approximate. Buyer must verify the information and bears all risk for any inaccuracies. Any projections, opinions, assumptions or estimates used herein are for example purposes only and do not represent the current or future performance of the property. Marcus & Millichap Real Estate Investment Services is a service mark of Marcus & Millichap Real Estate Investment Services, Inc. © 2011 Marcus & Millichap ACT ID Y0080574 Taco Bell Taco Bell Corporation, a subsidiary of Yum! Brands, Incorporated (NYSE: YUM), is the nation’s leading Mex- ican-inspired quick service restaurant (QSR) brand. From breakfast to late night, Taco Bell serves made- to-order and customizable tacos and burritos, among other choices, and is the first QSR restaurant to offer American Vegetarian Association (AVA)-certified menu items. Taco Bell and its more than 350 franchise organizations proudly serve over 42 million customers each week through 7,000 restaurants across the nation, as well as through its mobile, desktop and delivery ordering services. Overseas, Taco Bell has over 250 restaurants, with plans to add 2,000 more restaurants internationally within the next decade. The brand encourages its fans to “Live Mas” and connects with them through sports, gaming and new music via its Feed The Beat® music program. Taco Bell also provides education opportunities and serves the commu- nity through its nonprofit organization, the Taco Bell® Foundation™, and connects fans with their passions through programs such as the Live Mas Scholarship program. In 2016, Taco Bell was named as one of Fast Company’s Top 10 Most Innovative Companies in the World. Parent Company Yum! Brands, Incorporated, based in Louisville, Kentucky, has nearly 43,000 restaurants in 135 countries and territories and is one of the Aon Hewitt Top Companies for Leaders in North America. The Company’s restaurant brands – KFC, Pizza Hut and Taco Bell – are the global leaders of the chicken, pizza, and Mexi- can-style food categories. Worldwide, the Yum! Brands system opens over six new restaurants per day on average, making it a leader in global retail development. Since its spin-off from PepsiCo in 1997, Yum! Brands has become a truly global company going from ap- proximately 20 percent of profits coming from outside the United States. to almost 65 percent in 2015. We’re proud to be the worldwide leader in emerging markets with nearly 17,000 restaurants, nearly twice as many as the nearest competition. With about 2.5 restaurants per million people in the top 10 emerging markets, compared to 57 restaurants per million in the United States. Opening a Taco Bell Start-up costs, which include construction expenses and a $45,000 franchise fee, average between $1.2 million and $2.5 million, according to the company. The costs are slightly lower — between $175,000 and $1.4 million — for franchisees to acquire an existing Taco Bell restaurant. Because initial costs are so high, Taco Bell requires potential franchisees to have a minimum net worth of $1.5 million and at least $750,000 in liquid assets. Once the restaurant is up and running, the company charges an ongoing royalty fee equal to 5.5 percent of gross sales. If successful, the restaurant will bring in annual sales of at least $1.4 million, which is what the average Taco Bell restaurant generated last year, according to Quick-Service Restaurant magazine. Founded 1962 Type Subsidiary Parent Company Yum! Brands Inc. Ticket Symbol YUM Revenue US $1.98 Billion (2015) Number of Locations 6,407 Number of Employees 175,000+ Headquarters Downey, California, U.S Website www.tacobell.com
- 9. taco bell in the news This information has been secured from sources we believe to be reliable, but we make no representations or warranties, expressed or implied, as to the accuracy of the information. References to square footage or age are approximate. Buyer must verify the information and bears all risk for any inaccuracies. Any projections, opinions, assumptions or estimates used herein are for example purposes only and do not represent the current or future performance of the property. Marcus & Millichap Real Estate Investment Services is a service mark of Marcus & Millichap Real Estate Investment Services, Inc. © 2011 Marcus & Millichap ACT ID Y0080574 6 Quesarito Rush: Taco Bell Plans to Hire 100,000 Workers Over Next Six Years Taco Bell announced that it plans to hire 100,000 workers over the next six years. The hiring surge is part of a plan to take its restaurant count to 9,000 (from the current 6,500) and its sales to $15 billion by 2022. Taco Bell cur- rently employs 210,000 people across its company-owned and franchised stores. In 2015, the chain recorded nine billion dollars in sales. Fast food and fast casual restaurants have faced a challenging consumer environment in 2016, to say the least, with deflation in food commodity prices making grocery shopping more appealing and the ugly presidential campaign supposedly making eating out less appealing. Taco Bell, however, has largely resisted succumbing to this trend; its same-store sales grew three percent during the third quarter of 2016, and system sales jumped five percent. Parent of Taco Bell, KFC, Pizza Hut Tops 2Q Profit Forecasts Yum Brand Incorporated shares jumped in extended trading Wednesday af- ter the parent company of Taco Bell, KFC, and Pizza Hut reported a better- than- expected profit for its second quarter. The results come as Louisville, Kentucky-based Yum prepares to split off its China unit later this year into a separate company. China has been a critical region for Yum, which is a dominant player in the country’s fast-food indus- try with more than 5,000 KFC locations. The company earned $339 million or 81 cents per share, for the period. Earnings, adjusted for non-recurring gains, were 75 cents per share. That topped market expectations of 74 centers per share, according to analysts polled by Zacks Investment Research. The Three ‘C’s of Taco Bell The Taco Bell brand is centered on three ‘C’s. “You have to be current, you have to be creative, and you have to have a cause,” said Brian Niccol. chief executive officer of Taco Bell. This strategy among others has helped drive five years of same-store sales growth for the Mexican fast-food chain. The brand already has grown well beyond nine billion dollars, up from seven billion dollars in 2011. How does Taco remain current? “Our food has to stay current,” Mr. Niccol said during parent company Yum! Brands’ investor and analyst conference on Oct. 11. “So, some things that we have accomplished: We have reduced sodium by 15 percent since 2008; we will get to 25 per- cent reduction by 2025. Actually, on Nov. 17, we will be 100 percent cage-free eggs across our system. And by Jan. 1, 2017, all our chicken will no longer have human crossover antibiotics.” “These aren’t things that are going to define us, but these are things that we are doing quietly because it keeps the food current with young people, and it is the right thing to do.” Efforts to be creative play out in social media initiatives, including the launch of a Snapchat lens that generated record impressions on the platform, drawing 48 million unique users. The third ‘C’ [is] cause. “We have this Live Mas scholarship program... It is really around reward- ing kids for their passion. So it is not an academic scholarship or an athletic scholarship; it is all about finding your passion and then rewarding you for that passion.” Beyond the three ‘C’s, Taco Bell is focused on leading the industry in value and innovation. Forthcoming menu items include the Naked Chicken Chalupa, Crispy Chicken Chips, Double Stacked Tacos and Quesalupa 2.0, in flavors including Volcano and Bacon Club. Other initiatives under way at Taco Bell include the opening of contemporary new formats, including walk-up and container stores, and the addition of beer and wine in several locations. “...the store in Wicker Park we are selling beer and wine, 20 percent of the sales are going through drinks, which is pretty powerful,” Mr. Niccol said. Taco Bell continues to expand domestically and internationally, with 6,975 United States res- taurants and another 300 units in 22 countries. By 2022, the company expects to operate more than 8,000 locations in the United States and more than 1,000 units in 40 countries.
- 10. financial overview annualized operating data Rent Increases Annual Rent Monthly Rent Rent Commencement $72,000.00 $6,000.00 Year 06 - Year 10 $79,200.00 $6,600.00 Year 11 - Year 15 $87,120.00 $7,260.00 Year 16 - Year 20 $95,832.00 $7,986.00 Year 21 - Year 25 $105,415.20 $8,784.60 Option 1: Year 26- Year 30 $115,956.72 $9,663.06 Option 2: Year 31 - Year 35 $127,552.39 $10,639.37 Option 3: Year 36 - Year 39 $140,307.63 $11,692.30 Option 4: Year 40 - Year 44 $154,338.39 $12,861.53 Base Rent ($34.29/SF) $72,000 Net Operating Income $72,000 Total Return 4.45% / $72,000 pricing Property Name Taco Bell Property Address 50060 Harrison Street Coachella, CA 92236 Price $1,617,000 Cap Rate 4.45% Price Per Square Foot $770 Gross Leasable Area 2,100 SF Year Built 2016 Lot Size 0.93 Acres financing FIRSTTRUSTDEED Loan Amount $900,000 Interest Rate 5-Year Fixed Rate/Term at 4.550% Amortization 30 Years Broker Origination Fee 1.00% Prepayment Penalty No Lender Legal Fees No Survey No, unless Title requires it 7 This information has been secured from sources we believe to be reliable, but we make no representations or warranties, expressed or implied, as to the accuracy of the information. References to square footage or age are approximate. Buyer must verify the information and bears all risk for any inaccuracies. Any projections, opinions, assumptions or estimates used herein are for example purposes only and do not represent the current or future performance of the property. Marcus & Millichap Real Estate Investment Services is a service mark of Marcus & Millichap Real Estate Investment Services, Inc. © 2011 Marcus & Millichap ACT ID Y0080574 tenant summary Tenant Trade Name Taco Bell Lease Type Ground Lease Roof and Structure Tenant Responsible Lease Term 25 Years Lease Commencement Date August 26, 2016 Rent Commencement Date February 28, 2016 Lease Expiration Date August 26, 2041 Term Remaining on Lease 25 Years Increases 10% Every 5 Years Options Four, Five-Year Options
- 12. 9 This information has been secured from sources we believe to be reliable, but we make no representations or warranties, expressed or implied, as to the accuracy of the information. References to square footage or age are approximate. Buyer must verify the information and bears all risk for any inaccuracies. Any projections, opinions, assumptions or estimates used herein are for example purposes only and do not represent the current or future performance of the property. Marcus & Millichap Real Estate Investment Services is a service mark of Marcus & Millichap Real Estate Investment Services, Inc. © 2011 Marcus & Millichap ACT ID Y0080574 McDonald’s subject property HARRISON STREET & AVENUE 50 28,800+ CARS PER DAY HARRISON STREET AVENUE 50 Taco Bell is Strategically Located Between Two Fortune 500 Tenants - Walgreens & McDonald’s
- 13. This information has been secured from sources we believe to be reliable, but we make no representations or warranties, expressed or implied, as to the accuracy of the information. References to square footage or age are approximate. Buyer must verify the information and bears all risk for any inaccuracies. Any projections, opinions, assumptions or estimates used herein are for example purposes only and do not represent the current or future performance of the property. Marcus & Millichap Real Estate Investment Services is a service mark of Marcus & Millichap Real Estate Investment Services, Inc. © 2011 Marcus & Millichap ACT ID Y0080574 10 gateway center coachella shopping center CESAR CHAVEZ ELEMENTARY SCHOOL planet fitness McDonald’s Future Retail Planned Location is the Epicenter of Retail for the City of Coachella subject property
- 14. 11 This information has been secured from sources we believe to be reliable, but we make no representations or warranties, expressed or implied, as to the accuracy of the information. References to square footage or age are approximate. Buyer must verify the information and bears all risk for any inaccuracies. Any projections, opinions, assumptions or estimates used herein are for example purposes only and do not represent the current or future performance of the property. Marcus & Millichap Real Estate Investment Services is a service mark of Marcus & Millichap Real Estate Investment Services, Inc. © 2011 Marcus & Millichap ACT ID Y0080574 McDonald’s Sold to Private Investor in 2013 for $2,000,000 Sold to Private Investor in 2011 for $6,918,000 Sold to Private Investor in 2015 for $8,350,000 Walgreens Smart & Final Sold to Private Investor in 2004 for $2,400,000 Coachella Plaza Sold to Private Investor in 2005 for $14,150,000 Coachella Shopping Center
- 15. market overview
- 16. 13 This information has been secured from sources we believe to be reliable, but we make no representations or warranties, expressed or implied, as to the accuracy of the information. References to square footage or age are approximate. Buyer must verify the information and bears all risk for any inaccuracies. Any projections, opinions, assumptions or estimates used herein are for example purposes only and do not represent the current or future performance of the property. Marcus & Millichap Real Estate Investment Services is a service mark of Marcus & Millichap Real Estate Investment Services, Inc. © 2011 Marcus & Millichap ACT ID Y0080574 Highway 111 is a state highway in California. It is the main north/ south state highway and retail corridor through the Coachella Val- ley, a part of the Colorado Desert in the southeastern corner of the state and famous as a resort destination. It runs from the United States-Mexico border crossing to Interstate 10 at White Water. Highway 111 links virtually every desert resort city in the Coachella Valley. Highway 111 area overview Palm Springs 29 Miles Los Angeles 133 Miles San Diego 165 Miles Newport Beach 127 Miles Coachella, CA Coachella is located in the massively expanding Riverside County which became the 10th most popu- lous county in the United States. This expansion is in part to the vivid scenery, lush golf courses, excel- lent dining, and vibrant nightlife that combine to create a resort experience. The Coachella Valley is made up of nine distinct cities including Palm Springs, Palm Desert, Rancho Mirage, Indian Wells, La Quinta, Desert Hot Springs, Indio, and Coachella. These diverse municipalities merge into one exciting experience. Indio is the closest in relation to the city of Coachella and is one of the fastest growing cities in the Coachella Valley. The increasing popularity of the Coachella Valley Music and Arts Festival and Stagecoach Music Festival, both held at Empire Polo Club, have contributed to much of the city’s cur- rent size. Millions of people come here annually for a host of additional events, including the Riverside County Fair and National Date Festival, Southwest Arts Festival, and International Tamale Festival. distance to and from property 36,100+ Employees 175,000+ Residents (Within Five- Mile Radius of Subject Property) 9,950+ Enrolled Students (College of the Desert) 34,000+ Households (Within Five- Mile Radius of Subject Property) $72,065 Average Household Income $6.4B Total Palm Springs Area Economic Impact The Coachella Valley Music and Arts Festival is an annual festival held at the Empire Polo Club in Indio, California. Coachella show- cases popular and established musical artists, as well as emerging artists and reunited groups. Coachella is one of the largest, most famous, and most profitable music festivals in the United States. Coachella Valley Music and Arts Festival
- 17. demographics
- 18. 1 MILE 3 MILES 5 MILES 1815 This information has been secured from sources we believe to be reliable, but we make no representations or warranties, expressed or implied, as to the accuracy of the information. References to square footage or age are approximate. Buyer must verify the information and bears all risk for any inaccuracies. Any projections, opinions, assumptions or estimates used herein are for example purposes only and do not represent the current or future performance of the property. Marcus & Millichap Real Estate Investment Services is a service mark of Marcus & Millichap Real Estate Investment Services, Inc. © 2011 Marcus & Millichap ACT ID Y0080574 Subject Property 1 MILE 3 MILES 5 MILES 2016 Population 17,544 93,409 175,720 2016 Households 3,843 21,305 46,632 2016 Average Household Size 4.47 3.81 3.29 2014 Daytime Population 1,805 17,491 36,162 2016 Owner Occupied Housing Units 60.81% 54.08% 64.49% 2016 Renter Occupied Housing Units 39.19% 45.92% 35.51% 2016 Vacant 4.07% 13.17% 19.90% 2016 Median Household Income $37,005 $37,604 $47,199 2014 Per Capita Income $9,919 $13,938 $21,836 2016 Average Household Income $45,237 $53,364 $72,065
- 19. This information has been secured from sources we believe to be reliable, but we make no representations or warranties, expressed or implied, as to the accuracy of the information. References to square footage or age are approximate. Buyer must verify the information and bears all risk for any inaccuracies. Any projections, opinions, assumptions or estimates used herein are for example purposes only and do not represent the current or future performance of the property. Marcus & Millichap Real Estate Investment Services is a service mark of Marcus & Millichap Real Estate Investment Services, Inc. © 2011 Marcus & Millichap ACT ID Y0080574 16 Demographic data © 2016 by Experian/Applied Geographic 5-mile radius of property population In 2016, the population in the area is 154,869. The population has changed by 59.57% since 2000. It is estimated that the population in the area will be 175,720 five years from now, which represents a change of 13.46% from the current year. The current population is 49.40% make and 50.59% female. The median age of the population in the area is 37.3, compare this to the entire U.S. average which is 37.3. The population density in the area is 1,005.97 people per square mile. households There are currently 46,632 households in the area. The number of households has changed by 73.81% since 2000. It is estimated that the number of households in the area will be 53,564 five years from now, which represents a change of 14.86% from the current year. The average household size in the area is 3.29 persons. income In 2016, the median household income for the area is $47,198, compare this to the entire U.S. average which is currently $51,972. The median household income for the area has changed by 29.58% since 2000. It is estimated that the median household income in the area will be $54,837 five years from now, which represents a change of 16.18% from the current year. The current year per capita income in the area is $21,836, compare this to the entire U.S. average, which is $28,599. The current year average household income in the area is $72,065, compare this to the entire U.S. average which is $74,533. race & ethnicity The current year racial makeup of your selected area is as follows: 59.81% White, 1.70% Black, 0.07% Native American and 1.86% Asian/Pacific Islander. Compare these to Entire US averages which are: 71.60% White, 12.70% Black, 0.18% Native American and 5.02% Asian/Pacific Islander. People of Hispanic origin are counted independently of race. People of Hispanic origin make up 70.82% of the current year population in your selected area. Compare this to the Entire US average of 17.13%. housing In 2000, there were 16,829 owner-occupied housing units and 10,000 renter-occupied housing units in the area. The median rent at the time was $461. employment In 2016, there were 36,161 employees in the area, this is also known as the daytime population. The 2000 Census revealed that 40.80% of employees are employed in white-collar occupations in this geography, and 59.01% are employed in blue-collar occupations. In 2016, unemployment in this area is 12.33%. In 2000, the average time traveled to work was 22.0 minutes.
- 20. PRESENTED BY LEAD BROKER Kevin Boeve Senior Vice President Investments ONTARIO OFFICE Tel: (909) 456-3450 kevin.boeve@marcusmillichap.com CA License: 01247016 LEAD BROKER Neil Naran Associate ONTARIO OFFICE Tel: (909) 456-3476 neil.naran@marcusmillichap.com CA License: 02025512 Joshua Rey Associate ONTARIO OFFICE Tel: (909) 456-7015 joshua.rey@marcusmillichap.com CA License: 1776485