
Recomendados
Más contenido relacionado
Similar a Assignment 1
Similar a Assignment 1 (20)
Último
Último (20)
Assignment 1
- 1. ASSIGNMENT IN PRODUCTION TECHNOLOGY - MSC IN PETROLEUM ENGINEERING JOHN KEVIN M. DE CASTRO 16000494 1. Given the data below, analyze the effect of skin on flowing bottom hole pressure and demonstrate the effect of drainage area on oil well production rate Q = 100STB/day re = 2980 ft k = 8.2 mD Pi = 5651 psi rw = 0.328 ft µ = 1.1 cp Bo = 1.7 bbl/STB h = 53 ft Assumptions: a. Flow regime is pseudosteady state. b. The given pressure is average pressure. Working Equation: 𝒑 𝒘𝒇 = 𝒑 𝒂𝒗𝒆 − 𝟏𝟒𝟏. 𝟐 𝒒𝝁𝑩 𝒌𝒉 ⌈ 𝒍𝒏 ( 𝒓 𝒆 𝒓 𝒘 ) − 𝟑 𝟒 + 𝑺⌉ a. Skin effect can be analyzed by assuming different values of skin factor, S. For S = 0 𝑝 𝑤𝑓 = 5651 𝑝𝑠𝑖 − 141.2 (100 𝑆𝑇𝐵 𝑑𝑎𝑦 )(1.1 𝑐𝑝)(1. 7𝑏𝑏𝑙 𝑆𝑇𝐵 ) (8.2 𝑚𝐷)(53 𝑓𝑡) ⌈ 𝑙𝑛 ( 2980 𝑓𝑡 0.328 𝑓𝑡 ) − 3 4 + 0⌉ 𝒑 𝒘𝒇 = 𝟓𝟏𝟒𝟐. 𝟖𝟏𝟒𝟑 𝒑𝒔𝒊 For S = 0.5 𝑝 𝑤𝑓 = 5651 𝑝𝑠𝑖 − 141.2 (100 𝑆𝑇𝐵 𝑑𝑎𝑦 )(1.1 𝑐𝑝)(1. 7𝑏𝑏𝑙 𝑆𝑇𝐵 ) (8.2 𝑚𝐷)(53 𝑓𝑡) ⌈ 𝑙𝑛 ( 2980 𝑓𝑡 0.328 𝑓𝑡 ) − 3 4 + 0.5⌉ 𝒑 𝒘𝒇 = 𝟓𝟏𝟏𝟐. 𝟒𝟑𝟔𝟓 𝒑𝒔𝒊 For S = 1 𝑝 𝑤𝑓 = 5651 𝑝𝑠𝑖 − 141.2 (100 𝑆𝑇𝐵 𝑑𝑎𝑦 )(1.1 𝑐𝑝)(1. 7𝑏𝑏𝑙 𝑆𝑇𝐵 ) (8.2 𝑚𝐷)(53 𝑓𝑡) ⌈ 𝑙𝑛 ( 2980 𝑓𝑡 0.328 𝑓𝑡 ) − 3 4 + 1⌉ 𝒑 𝒘𝒇 = 𝟓𝟎𝟖𝟐. 𝟎𝟓𝟖𝟕 𝒑𝒔𝒊 For S = 1.5
- 2. ASSIGNMENT IN PRODUCTION TECHNOLOGY - MSC IN PETROLEUM ENGINEERING 𝑝 𝑤𝑓 = 5651 𝑝𝑠𝑖 − 141.2 (100 𝑆𝑇𝐵 𝑑𝑎𝑦 )(1.1 𝑐𝑝)(1. 7𝑏𝑏𝑙 𝑆𝑇𝐵 ) (8.2 𝑚𝐷)(53 𝑓𝑡) ⌈ 𝑙𝑛 ( 2980 𝑓𝑡 0.328 𝑓𝑡 ) − 3 4 + 1.5⌉ 𝒑 𝒘𝒇 = 𝟓𝟎𝟓𝟏. 𝟔𝟖𝟎𝟗 𝒑𝒔𝒊 For S = 2 𝑝 𝑤𝑓 = 5651 𝑝𝑠𝑖 − 141.2 (100 𝑆𝑇𝐵 𝑑𝑎𝑦 ) (1.1 𝑐𝑝)(1. 7𝑏𝑏𝑙 𝑆𝑇𝐵 ) (8.2 𝑚𝐷)(53 𝑓𝑡) ⌈ 𝑙𝑛 ( 2980 𝑓𝑡 0.328 𝑓𝑡 ) − 3 4 + 2⌉ 𝒑 𝒘𝒇 = 𝟓𝟎𝟐𝟏. 𝟑𝟎𝟑𝟏 𝒑𝒔𝒊 For S = -0.5 𝑝 𝑤𝑓 = 5651 𝑝𝑠𝑖 − 141.2 (100 𝑆𝑇𝐵 𝑑𝑎𝑦 )(1.1 𝑐𝑝)(1. 7𝑏𝑏𝑙 𝑆𝑇𝐵 ) (8.2 𝑚𝐷)(53 𝑓𝑡) ⌈ 𝑙𝑛 ( 2980 𝑓𝑡 0.328 𝑓𝑡 ) − 3 4 + (−0.5)⌉ 𝒑 𝒘𝒇 = 𝟓𝟏𝟕𝟑. 𝟏𝟗𝟐𝟏 𝒑𝒔𝒊 For S = -1 𝑝 𝑤𝑓 = 5651 𝑝𝑠𝑖 − 141.2 (100 𝑆𝑇𝐵 𝑑𝑎𝑦 )(1.1 𝑐𝑝)(1. 7𝑏𝑏𝑙 𝑆𝑇𝐵 ) (8.2 𝑚𝐷)(53 𝑓𝑡) ⌈ 𝑙𝑛 ( 2980 𝑓𝑡 0.328 𝑓𝑡 ) − 3 4 + (−1)⌉ 𝒑 𝒘𝒇 = 𝟓𝟐𝟎𝟑. 𝟓𝟔𝟗𝟗 𝒑𝒔𝒊 For S = -1.5 𝑝 𝑤𝑓 = 5651 𝑝𝑠𝑖 − 141.2 (100 𝑆𝑇𝐵 𝑑𝑎𝑦 )(1.1 𝑐𝑝)(1. 7𝑏𝑏𝑙 𝑆𝑇𝐵 ) (8.2 𝑚𝐷)(53 𝑓𝑡) ⌈ 𝑙𝑛 ( 2980 𝑓𝑡 0.328 𝑓𝑡 ) − 3 4 + (−1.5)⌉ 𝒑 𝒘𝒇 = 𝟓𝟐𝟑𝟑. 𝟗𝟒𝟕𝟕 𝒑𝒔𝒊 For S = -2 𝑝 𝑤𝑓 = 5651 𝑝𝑠𝑖 − 141.2 (100 𝑆𝑇𝐵 𝑑𝑎𝑦)(1.1 𝑐𝑝)(1. 7𝑏𝑏𝑙 𝑆𝑇𝐵 ) (8.2 𝑚𝐷)(53 𝑓𝑡) ⌈ 𝑙𝑛 ( 2980 𝑓𝑡 0.328 𝑓𝑡 ) − 3 4 + (−2)⌉ 𝒑 𝒘𝒇 = 𝟓𝟐𝟔𝟒. 𝟑𝟐𝟓𝟓 𝒑𝒔𝒊
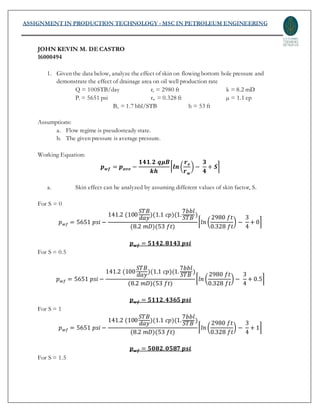
- 3. ASSIGNMENT IN PRODUCTION TECHNOLOGY - MSC IN PETROLEUM ENGINEERING Table 1 Wellbore Flowing Pressure and ∆p at Varying Skin Factor S pwf (psi) ∆p (psi) -2 5264.3255 386.6745 -1.5 5233.9477 417.0523 -1 5203.5699 447.4301 -0.5 5173.1921 477.8078 0 5142.8143 508.1857 0.5 5112.4365 538.5635 1 5082.0587 568.9413 1.5 5051.6809 599.3191 2 5021.3031 629.6969 Figure 1 - Skin Factor versus Wellbore Flowing Pressure Plot The figure above shows the relationship between the wellbore flowing pressure and the skin factor. It can be observed that there is an inverse linear relationship between them since wellbore flowing pressure decreases as skin factor increases. The change according to the equation above is 30.378 times of the skin factor. This is because the wellbore flowing pressure is affected by the skin via the change or reduction in permeability and any other factors. The formation fluid wasn’t able to flow freely into the wellbore thereby causing low flowing pressure – which can be assumed to be a damage formation. Since skin is defined as the permeability impairment due to wellbore damage caused by oil and gas operations, increasing its value inhibit the flow of fluids causing a lower wellbore flowing pressure. y = -30.378x + 5294.7 4850 4900 4950 5000 5050 5100 5150 5200 5250 5300 -2 -1.5 -1 -0.5 0 0.5 1 1.5 2 WellboreFLowingpressure(psi) Skin factor Skin Factor vs Wellbore Flowing PressurePlot
- 4. ASSIGNMENT IN PRODUCTION TECHNOLOGY - MSC IN PETROLEUM ENGINEERING Figure 2 - Skin Factor versus ∆p Plot Figure 2 shows the relationship between the change in pressure (∆p) and the skin factor. According to the trendline, y = 20.378x + 356.3, there is a direct linear relationship between the two variables since increases with each other. If the wellbore flowing pressure is low for higher skin factor, and we get ∆p, we will expect higher value. b. Effect of drainage area can be determined by assuming varying drainage areas. Working Equation: 𝒒 = 𝟕. 𝟎𝟖𝒙𝟏𝟎−𝟑 𝒌𝒉(𝒑 𝒂𝒗𝒆 − 𝒑 𝒘𝒇) 𝝁𝑩 [𝒍𝒏 ( 𝒓 𝒆 𝒓 𝒘 )− 𝟑 𝟒 + 𝑺] Table 4 Drainage Area and Its Equivalent Effective Radius Drainage area (ft2 ) Effective radius (ft) 15,000,000 2185.0969 20,000,000 2523.1325 25,000,000 2820.9479 30,000,000 3090.1936 35,000,000 3337.7906 40,000,000 3568.2482 45,000,000 3784.6988 y = 30.378x + 356.3 0 100 200 300 400 500 600 700 -2 -1.5 -1 -0.5 0 0.5 1 1.5 2 ∆p(psi) Skin Factor Skin Factor vs ∆p
- 5. ASSIGNMENT IN PRODUCTION TECHNOLOGY - MSC IN PETROLEUM ENGINEERING Assumption: Calculations made are based on S = 0. For Ad = 15x106 ft 𝒒 = 𝟕. 𝟎𝟖𝒙𝟏𝟎−𝟑 𝒌𝒉(𝒑 𝒂𝒗𝒆 − 𝒑 𝒘𝒇) 𝝁𝑩 [𝒍𝒏 ( 𝒓 𝒆 𝒓 𝒘 )− 𝟑 𝟒 + 𝑺] 𝑞 = 7.08𝑥10−3 (8.2 𝑚𝐷)(53 𝑓𝑡)(5651 𝑝𝑠𝑖 − 5142.8143 𝑝𝑠𝑖) (1.1 𝑐𝑝)(1.7 𝑏𝑏𝑙 𝑆𝑇𝐵 )[𝑙𝑛 ( 2185.0969 𝑓𝑡 0.328 𝑓𝑡 ) − 3 4 + 0] 𝒒 = 𝟏𝟎𝟑. 𝟖𝟐𝟎𝟔 𝑺𝑻𝑩/𝒅𝒂𝒚 For Ad = 20x106 ft 𝑞 = 7.08𝑥10−3 (8.2 𝑚𝐷)(53 𝑓𝑡)(5651 𝑝𝑠𝑖 − 5142.8143 𝑝𝑠𝑖) (1.1 𝑐𝑝)(1.7 𝑏𝑏𝑙 𝑆𝑇𝐵 )[𝑙𝑛 ( 2523.1325 𝑓𝑡 0.328 𝑓𝑡 ) − 3 4 + 0] 𝒒 = 𝟏𝟎𝟏. 𝟗𝟗𝟗𝟎 𝑺𝑻𝑩/𝒅𝒂𝒚 For Ad = 25x106 ft 𝑞 = 7.08𝑥10−3 (8.2 𝑚𝐷)(53 𝑓𝑡)(5651 𝑝𝑠𝑖 − 5142.8143 𝑝𝑠𝑖) (1.1 𝑐𝑝)(1.7 𝑏𝑏𝑙 𝑆𝑇𝐵 )[𝑙𝑛 ( 2820.9479 𝑓𝑡 0.328 𝑓𝑡 ) − 3 4 + 0] 𝒒 = 𝟏𝟎𝟎. 𝟔𝟐𝟗𝟓 𝑺𝑻𝑩/𝒅𝒂𝒚 For Ad = 30x106 ft 𝑞 = 7.08𝑥10−3 (8.2 𝑚𝐷)(53 𝑓𝑡)(5651 𝑝𝑠𝑖 − 5142.8143 𝑝𝑠𝑖) (1.1 𝑐𝑝)(1.7 𝑏𝑏𝑙 𝑆𝑇𝐵 )[𝑙𝑛 ( 3090.1936 𝑓𝑡 0.328 𝑓𝑡 ) − 3 4 + 0] 𝒒 = 𝟗𝟗. 𝟓𝟑𝟕𝟓 𝑺𝑻𝑩/𝒅𝒂𝒚 For Ad = 35x106 ft 𝑞 = 7.08𝑥10−3 (8.2 𝑚𝐷)(53 𝑓𝑡)(5651 𝑝𝑠𝑖 − 5142.8143 𝑝𝑠𝑖) (1.1 𝑐𝑝)(1.7 𝑏𝑏𝑙 𝑆𝑇𝐵 )[𝑙𝑛 ( 3337.7906 𝑓𝑡 0.328 𝑓𝑡 ) − 3 4 + 0] 𝒒 = 𝟗𝟖. 𝟔𝟑𝟐𝟔 𝑺𝑻𝑩/𝒅𝒂𝒚 For Ad = 40x106 ft 𝑞 = 7.08𝑥10−3 (8.2 𝑚𝐷)(53 𝑓𝑡)(5651 𝑝𝑠𝑖 − 5142.8143 𝑝𝑠𝑖) (1.1 𝑐𝑝)(1.7 𝑏𝑏𝑙 𝑆𝑇𝐵 )[𝑙𝑛 ( 3568.2482 𝑓𝑡 0.328 𝑓𝑡 ) − 3 4 + 0] 𝒒 = 𝟗𝟕. 𝟖𝟔𝟏𝟗 𝑺𝑻𝑩/𝒅𝒂𝒚
- 6. ASSIGNMENT IN PRODUCTION TECHNOLOGY - MSC IN PETROLEUM ENGINEERING For Ad = 45x106 ft 𝑞 = 7.08𝑥10−3 (8.2 𝑚𝐷)(53 𝑓𝑡)(5651 𝑝𝑠𝑖 − 5142.8143 𝑝𝑠𝑖) (1.1 𝑐𝑝)(1.7 𝑏𝑏𝑙 𝑆𝑇𝐵 )[𝑙𝑛 ( 3784.6988𝑓𝑡 0.328 𝑓𝑡 ) − 3 4 + 0] 𝒒 = 𝟗𝟕. 𝟏𝟗𝟐𝟎 𝑺𝑻𝑩/𝒅𝒂𝒚 Table 4 Production rate at Varying Drainage Area Drainage area (ft2 ) Effective radius (ft) Q (STB/day) 15,000,000 2185.0969 103.8206 20,000,000 2523.1325 101.9990 25,000,000 2820.9479 100.6295 30,000,000 3090.1936 99.5375 35,000,000 3337.7906 98.6326 40,000,000 3568.2482 97.8619 45,000,000 3784.6988 97.1920 Figure 3 – Drainage area vs Production rate Plot Figure above shows the effect of drainage area on the production rate. According to the trendline, the relationship is a logarithmic function, y = -3.434ln(x) +104.14. The reason maybe is that for a fixed pressure of different volume (drainage area with fixed thickness), pressure distribution for smaller container for example is greater compared to the bigger ones. With this, production rate can be higher since there is enough driving force the will enable the hydrocarbons to flow into the wellbore. However, for large container (again for example) at same pressure, pressure distribution is not that high thereby causing a low production rate. y = -3.434ln(x) + 104.14 92 94 96 98 100 102 104 106 15,000,000 20,000,000 25,000,000 30,000,000 35,000,00040,000,00045,000,000 Productionrate(STB/day) Drainagearea (ft2) Drainagearea vs Production rate
- 7. ASSIGNMENT IN PRODUCTION TECHNOLOGY - MSC IN PETROLEUM ENGINEERING 2. Show the equation transformation from the initial reservoir pressure version to the average reservoir pressure equation. a. 𝒑𝒊 − 𝒑 𝒘𝒇 = 𝟏𝟒𝟏.𝟐𝒒𝝁𝑩 𝒐 𝒌𝒉 [ 𝟎.𝟎𝟎𝟎𝟓𝟐𝟕𝒌𝒕 ∅𝝁𝒄 𝒕 𝒓 𝒆 𝟐 + 𝒍𝒏 ( 𝒓 𝒆 𝒓 𝒘 ) − 𝟑 𝟒 ] b. 𝒑 𝒂𝒗𝒆 − 𝒑 𝒘𝒇 = 𝟏𝟒𝟏.𝟐𝒒𝝁𝑩 𝒐 𝒌𝒉 [𝒍𝒏 ( 𝒓 𝒆 𝒓 𝒘 ) − 𝟑 𝟒 ] Transforming the initial pressure equation to average pressure equation can be done by substituting the compressibility formula to the left hand side of the former equation. Assumptions: a. Fluids inside the reservoir is slightly compressible. b. The natural drive mechanism is by expansion. c. Flow regime can be pseudosteady state. 𝒄 = − 𝟏 𝒗 ∆𝑽 ∆𝑷 (1) ∆𝑽 = −𝒄𝑽∆𝑷 = 𝒒𝒅𝒕 (2) Where V = πr2 hØ ∆𝒑 ∆𝒕 = − 𝒒 𝒄𝑽 = − 𝒒 𝒔 𝑩 𝒄𝝅𝒓 𝒆 𝟐 𝒉∅ (3) ∆p can be equated to pi – pave since we this change in pressure is caused by the change in volume upon production, where pave is possible. 𝒑 𝒊−𝒑 𝒂𝒗𝒆 ∆𝒕 = − 𝒒 𝒔 𝑩 𝒄𝝅𝒓 𝒆 𝟐 𝒉∅ (4) qs is the flow rate under reservoir condition with a unit of bbl/hr. To make it under standard condition, we multiply it with formation volume factor and also multiplying 5.615 ft3 /bbl and dividing 24 hours/day to make all units solvable. 𝒑𝒊 − 𝒑 𝒂𝒗𝒆 = − 𝟓.𝟔𝟏𝟓𝒒 𝒔 𝑩( 𝒕 𝟐𝟒 ) 𝒄𝝅𝒓 𝒆 𝟐 𝒉∅ (5) The negative sign is just a sign convention for the reduction in volume. Substituting Equation 6 to Equation a. 𝒑𝒊 = 𝒑 𝒂𝒗𝒆 + 𝟎.𝟎𝟕𝟒𝟒𝒒 𝒔 𝑩𝒕 𝒄 𝒓 𝒆 𝟐 𝒉∅ (6) 𝒑 𝒂𝒗𝒆 + 𝟎.𝟎𝟕𝟒𝟒𝒒 𝒔 𝑩𝒕 𝒄𝒓 𝒆 𝟐 𝒉∅ − 𝒑 𝒘𝒇 = 𝟏𝟒𝟏.𝟐𝒒𝝁𝑩 𝒐 𝒌𝒉 [ 𝟎.𝟎𝟎𝟎𝟓𝟐𝟕𝒌𝒕 ∅𝝁𝒄 𝒕 𝒓 𝒆 𝟐 + 𝒍𝒏 ( 𝒓 𝒆 𝒓 𝒘 ) − 𝟑 𝟒 ] (7) 𝒑 𝒂𝒗𝒆 + 𝟎.𝟎𝟕𝟒𝟒𝒒 𝒔 𝑩𝒕 𝒄𝒓 𝒆 𝟐 𝒉∅ − 𝒑 𝒘𝒇 = 𝟎.𝟎𝟕𝟒𝟒𝒒𝑩 𝒐 𝒕𝒌𝝁 𝒉∅𝒄 𝒕 𝒓 𝒆 𝟐 𝒌𝝁 + 𝟏𝟒𝟏.𝟐𝒒𝝁𝑩 𝒐 𝒌𝒉 [𝒍𝒏( 𝒓 𝒆 𝒓 𝒘 ) − 𝟑 𝟒 ] (8)
- 8. ASSIGNMENT IN PRODUCTION TECHNOLOGY - MSC IN PETROLEUM ENGINEERING Canceling kµ term on the first term of the right hand side of the equation. And transposing the second term of the left hand side of the equation. 𝒑 𝒂𝒗𝒆 − 𝒑 𝒘𝒇 = − 𝟎.𝟎𝟕𝟒𝟒𝒒 𝒔 𝑩𝒕 𝒄𝒓 𝒆 𝟐 𝒉∅ + 𝟎.𝟎𝟕𝟒𝟒𝒒𝑩 𝒐 𝒕𝒌𝝁 𝒉∅ 𝒄 𝒕 𝒓 𝒆 𝟐 𝒌𝝁 + 𝟏𝟒𝟏.𝟐𝒒𝝁𝑩 𝒐 𝒌𝒉 [𝒍𝒏 ( 𝒓 𝒆 𝒓 𝒘 ) − 𝟑 𝟒 ] (9) Combining like terms. 𝒑 𝒂𝒗𝒆 − 𝒑 𝒘𝒇 = 𝟏𝟒𝟏.𝟐𝒒𝝁𝑩 𝒐 𝒌𝒉 [𝒍𝒏( 𝒓 𝒆 𝒓 𝒘 ) − 𝟑 𝟒 ] (10)