SlideShare una empresa de Scribd logo
1 de 2
Descargar para leer sin conexión
Columna2 Columna1
azul           11           azul               15
rojo           17           rojo               23
amarillo       33           amarillo           45
verde          39           verde              54


                       grafica


                                azul
                                11%

                    verde               rojo
                     39%                17%


                             amarillo
                              33%
Columna2   Columna1

Más contenido relacionado

Destacado (18)

Registro
RegistroRegistro
Registro
 
Miley cyrus magazine
Miley cyrus magazineMiley cyrus magazine
Miley cyrus magazine
 
Presentation11
Presentation11Presentation11
Presentation11
 
Observaciones
ObservacionesObservaciones
Observaciones
 
Law of increase rakeshji
Law of increase rakeshjiLaw of increase rakeshji
Law of increase rakeshji
 
Impact Investing Nieuws 1 November 2016
Impact Investing Nieuws 1 November 2016Impact Investing Nieuws 1 November 2016
Impact Investing Nieuws 1 November 2016
 
NAF Misawa Fajita Lunch Fundraiser
NAF Misawa Fajita Lunch FundraiserNAF Misawa Fajita Lunch Fundraiser
NAF Misawa Fajita Lunch Fundraiser
 
2 abanico mariposa
2 abanico mariposa2 abanico mariposa
2 abanico mariposa
 
Dire
DireDire
Dire
 
2
22
2
 
43590 FFF Festival Banner final
43590 FFF Festival Banner final43590 FFF Festival Banner final
43590 FFF Festival Banner final
 
Diagrama de gantt
Diagrama de ganttDiagrama de gantt
Diagrama de gantt
 
Inv
InvInv
Inv
 
office
officeoffice
office
 
Hidalgo
HidalgoHidalgo
Hidalgo
 
Baremo spain
Baremo spainBaremo spain
Baremo spain
 
LA COHESION SOCIAL
LA COHESION SOCIALLA COHESION SOCIAL
LA COHESION SOCIAL
 
Effective class planning for business students and their typical complaints
Effective class planning for business students and their typical complaintsEffective class planning for business students and their typical complaints
Effective class planning for business students and their typical complaints
 

Grafica de encuesta de excel

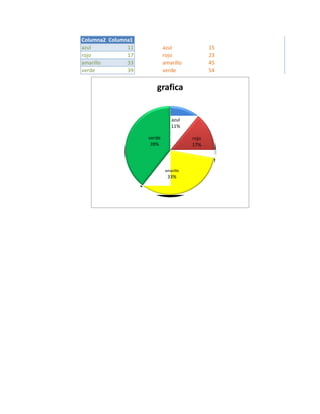
  • 1. Columna2 Columna1 azul 11 azul 15 rojo 17 rojo 23 amarillo 33 amarillo 45 verde 39 verde 54 grafica azul 11% verde rojo 39% 17% amarillo 33%
  • 2. Columna2 Columna1