Keynote technicals commodity intraday levels for 091012
•
0 recomendaciones•586 vistas


Recomendados
Recomendados
Más contenido relacionado
La actualidad más candente
La actualidad más candente (20)
Destacado
Destacado (18)
Similar a Keynote technicals commodity intraday levels for 091012
Similar a Keynote technicals commodity intraday levels for 091012 (9)
Más de Keynote Capitals Ltd.
Más de Keynote Capitals Ltd. (20)
Keynote technicals commodity intraday levels for 091012
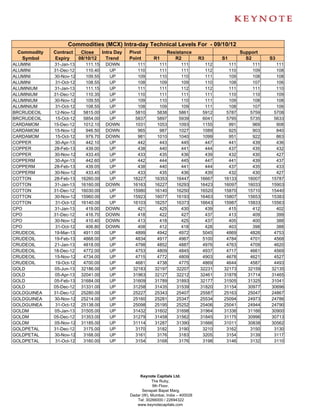
- 1. Commodities (MCX) Intra-day Technical Levels For - 09/10/12 Commodity Contract Close Intra Day Pivot Resistance Support Symbol Expiry 08/10/12 Trend Point R1 R2 R3 S1 S2 S3 ALUMINI 31-Jan-13 111.15 DOWN 111 111 111 112 111 111 111 ALUMINI 31-Dec-12 110.40 UP 110 111 111 112 110 109 108 ALUMINI 30-Nov-12 109.55 UP 109 110 110 111 109 108 108 ALUMINI 31-Oct-12 108.55 UP 108 109 109 110 108 107 106 ALUMINIUM 31-Jan-13 111.15 UP 111 111 112 112 111 111 110 ALUMINIUM 31-Dec-12 110.35 UP 110 111 111 111 110 110 109 ALUMINIUM 30-Nov-12 109.55 UP 109 110 110 111 109 108 108 ALUMINIUM 31-Oct-12 108.55 UP 108 109 109 111 108 107 106 BRCRUDEOIL 12-Nov-12 5815.00 UP 5810 5838 5861 5912 5787 5759 5708 BRCRUDEOIL 15-Oct-12 5854.00 UP 5837 5897 5939 6041 5795 5735 5633 CARDAMOM 15-Dec-12 1012.10 DOWN 1031 1053 1093 1155 991 969 908 CARDAMOM 15-Nov-12 946.50 DOWN 965 987 1027 1089 925 903 840 CARDAMOM 15-Oct-12 979.70 DOWN 981 1010 1040 1099 951 922 863 COPPER 30-Apr-13 442.10 UP 442 443 445 447 441 439 436 COPPER 28-Feb-13 439.00 UP 438 440 441 444 437 435 432 COPPER 30-Nov-12 433.45 UP 433 435 436 439 432 430 427 COPPERM 30-Apr-13 442.60 UP 442 444 445 447 441 439 437 COPPERM 28-Feb-13 439.05 UP 438 440 441 444 437 435 433 COPPERM 30-Nov-12 433.45 UP 433 435 436 439 432 430 427 COTTON 28-Feb-13 16260.00 UP 16227 16353 16447 16667 16133 16007 15787 COTTON 31-Jan-13 16160.00 DOWN 16163 16227 16293 16423 16097 16033 15903 COTTON 31-Dec-12 16030.00 UP 15980 16140 16250 16520 15870 15710 15440 COTTON 30-Nov-12 15960.00 UP 15923 16077 16193 16463 15807 15653 15383 COTTON 31-Oct-12 16140.00 UP 16103 16257 16373 16643 15987 15833 15563 CPO 31-Jan-13 419.00 DOWN 421 425 430 439 415 412 402 CPO 31-Dec-12 416.70 DOWN 418 422 427 437 413 409 399 CPO 30-Nov-12 410.40 DOWN 413 418 425 437 405 400 388 CPO 31-Oct-12 406.80 DOWN 408 412 418 428 403 398 388 CRUDEOIL 19-Mar-13 4911.00 UP 4899 4942 4972 5045 4869 4826 4753 CRUDEOIL 19-Feb-13 4868.00 UP 4834 4917 4967 5100 4784 4701 4568 CRUDEOIL 21-Jan-13 4818.00 UP 4798 4852 4887 4976 4763 4709 4620 CRUDEOIL 18-Dec-12 4772.00 UP 4753 4809 4845 4937 4717 4661 4569 CRUDEOIL 15-Nov-12 4734.00 UP 4715 4772 4809 4903 4678 4621 4527 CRUDEOIL 19-Oct-12 4700.00 UP 4681 4738 4775 4869 4644 4587 4493 GOLD 05-Jun-13 32186.00 UP 32183 32197 32207 32231 32173 32159 32135 GOLD 05-Apr-13 32041.00 UP 31963 32127 32212 32461 31878 31714 31465 GOLD 05-Feb-13 31684.00 UP 31609 31789 31893 32177 31505 31325 31041 GOLD 05-Dec-12 31331.00 UP 31258 31435 31539 31820 31154 30977 30696 GOLDGUINEA 31-Dec-12 25280.00 UP 25227 25343 25407 25587 25163 25047 24867 GOLDGUINEA 30-Nov-12 25214.00 UP 25160 25281 25347 25534 25094 24973 24786 GOLDGUINEA 31-Oct-12 25138.00 UP 25098 25195 25252 25406 25041 24944 24790 GOLDM 05-Jan-13 31505.00 UP 31432 31602 31698 31964 31336 31166 30900 GOLDM 05-Dec-12 31353.00 UP 31279 31458 31562 31845 31175 30996 30713 GOLDM 05-Nov-12 31185.00 UP 31114 31287 31390 31666 31011 30838 30562 GOLDPETAL 31-Dec-12 3175.00 UP 3170 3182 3190 3210 3162 3150 3130 GOLDPETAL 30-Nov-12 3168.00 UP 3161 3176 3183 3205 3154 3139 3117 GOLDPETAL 31-Oct-12 3160.00 UP 3154 3168 3176 3198 3146 3132 3110 Keynote Capitals Ltd. The Ruby, 9th Floor, Senapati Bapat Marg, Dadar (W), Mumbai, India – 400028 Tel: 30266000 / 22694322 www.keynotecapitals.com
- 2. Commodities (MCX) Intra-day Technical Levels For - 09/10/12 Commodity Contract Close Intra Day Pivot Resistance Support Symbol Expiry 08/10/12 Trend Point R1 R2 R3 S1 S2 S3 GOLDPTLDEL 31-Dec-12 3198.00 DOWN 3199 3208 3217 3235 3190 3181 3163 GOLDPTLDEL 30-Nov-12 3187.00 DOWN 3189 3202 3218 3247 3173 3160 3131 GOLDPTLDEL 31-Oct-12 3251.00 UP 3250 3264 3278 3306 3236 3222 3194 KAPAS 30-Apr-13 925.40 UP 923 933 940 957 916 906 889 KAPAS 30-Mar-13 899.60 UP 898 906 913 928 891 883 868 KAPASKHALI 30-Apr-13 1463.00 DOWN 1467 1501 1540 1613 1428 1394 1321 KAPASKHALI 30-Mar-13 1455.50 DOWN 1456 1481 1507 1558 1430 1405 1354 KAPASKHALI 28-Feb-13 1465.50 UP 1458 1477 1488 1517 1447 1429 1399 KAPASKHALI 31-Jan-13 1447.50 UP 1439 1461 1474 1508 1426 1405 1370 KAPASKHALI 31-Dec-12 1437.50 UP 1426 1453 1469 1512 1410 1383 1340 LEAD 31-Jan-13 118.10 UP 118 118 119 119 118 118 117 LEAD 31-Dec-12 118.35 UP 118 119 119 120 118 117 116 LEAD 30-Nov-12 118.20 UP 118 119 119 120 118 117 116 LEAD 31-Oct-12 118.05 UP 118 118 119 120 117 117 116 LEADMINI 31-Jan-13 118.40 UP 118 119 119 119 118 118 117 LEADMINI 31-Dec-12 118.35 UP 118 119 119 120 118 117 117 LEADMINI 30-Nov-12 118.20 UP 118 119 119 120 118 117 116 LEADMINI 31-Oct-12 118.05 UP 118 119 119 121 117 117 115 MENTHAOIL 31-Jan-13 1178.80 UP 1178 1189 1199 1220 1168 1157 1136 MENTHAOIL 31-Dec-12 1177.90 UP 1170 1187 1196 1222 1161 1144 1118 MENTHAOIL 30-Nov-12 1160.20 UP 1156 1174 1187 1219 1142 1124 1093 MENTHAOIL 31-Oct-12 1146.50 UP 1142 1159 1172 1201 1129 1112 1082 NATURALGAS 26-Dec-12 203.60 UP 203 205 207 211 201 198 194 NATURALGAS 27-Nov-12 195.10 UP 194 197 199 204 192 189 185 NATURALGAS 26-Oct-12 179.30 UP 178 181 184 189 176 173 168 NICKEL 31-Jan-13 968.90 DOWN 970 971 974 978 967 966 962 NICKEL 31-Dec-12 961.40 DOWN 962 967 973 984 956 951 940 NICKEL 30-Nov-12 957.20 UP 956 963 969 981 951 944 931 NICKEL 31-Oct-12 950.10 UP 949 956 962 975 943 936 924 NICKELM 31-Jan-13 969.00 UP 968 973 978 987 964 959 949 NICKELM 31-Dec-12 962.70 UP 963 968 973 984 957 952 941 NICKELM 30-Nov-12 956.80 UP 956 963 970 983 950 943 930 NICKELM 31-Oct-12 950.10 UP 950 957 964 978 943 936 921 POTATO 15-Apr-13 697.10 UP 692 710 722 752 680 663 633 POTATO 15-Mar-13 729.50 UP 726 734 739 752 721 713 700 POTATO 15-Oct-12 795.30 DOWN 798 801 806 814 793 790 782 POTATOTRWR 15-Oct-12 910.00 UP 907 913 917 927 903 897 887 SILVER 04-May-13 64623.00 UP 64605 64874 65125 65645 64354 64085 63565 SILVER 05-Mar-13 63185.00 DOWN 63234 63699 64213 65192 62720 62255 61276 SILVER 05-Dec-12 61474.00 UP 61414 61785 62096 62778 61103 60732 60050 SILVER1000 31-Dec-12 61720.00 DOWN 61720 61740 61760 61800 61700 61680 61640 SILVER1000 30-Nov-12 61468.00 UP 61385 61698 61927 62469 61156 60843 60301 SILVER1000 31-Oct-12 61000.00 UP 60885 61271 61541 62197 60615 60229 59573 SILVERM 30-Apr-13 64743.00 UP 64646 64949 65154 65662 64441 64138 63630 Keynote Capitals Ltd. The Ruby, 9th Floor, Senapati Bapat Marg, Dadar (W), Mumbai, India – 400028 Tel: 30266000 / 22694322 www.keynotecapitals.com
- 3. Commodities (MCX) Intra-day Technical Levels For - 09/10/12 Commodity Contract Close Intra Day Pivot Resistance Support Symbol Expiry 08/10/12 Trend Point R1 R2 R3 S1 S2 S3 SILVERM 28-Feb-13 63201.00 UP 63129 63482 63762 64395 62849 62496 61863 SILVERM 30-Nov-12 61487.00 UP 61419 61773 62059 62699 61133 60779 60139 SILVERMIC 30-Apr-13 64749.00 UP 64621 65041 65334 66047 64328 63908 63195 SILVERMIC 28-Feb-13 63199.00 UP 63142 63487 63775 64408 62854 62509 61876 SILVERMIC 30-Nov-12 61489.00 UP 61453 61836 62184 62915 61105 60722 59991 ZINC 31-Jan-13 108.45 DOWN 108 109 109 110 108 108 107 ZINC 31-Dec-12 107.65 DOWN 108 108 108 109 107 107 107 ZINC 30-Nov-12 106.95 DOWN 107 107 108 109 107 106 106 ZINC 31-Oct-12 106.05 DOWN 106 107 107 108 106 105 104 ZINCMINI 31-Jan-13 108.35 DOWN 108 109 109 109 108 108 108 ZINCMINI 31-Dec-12 107.65 DOWN 108 108 108 109 107 107 107 ZINCMINI 30-Nov-12 106.95 DOWN 107 107 108 109 107 106 105 ZINCMINI 31-Oct-12 106.05 DOWN 106 107 108 109 106 105 104 Sanjay Bhatia (AVP – Technical Research), Email Id sanjay@keynotecapitals.net Pivot Point: Intra- Day Trading Tool. - The key to the use of this tool is the use of Stop Loss Intra Day Trend: It is valid only till the point where Price trades above Pivot Point. For Eg. “UP” would be valid till Price remains above Pivot Point. It would become “DOWN” in event Price trades below Pivot Point. Pivot Point (PP): This is a trigger point for Intra Day Buy / Sell based on the price range of the previous day. R1: Resistance 1: 1st Resistance level over Pivot Point, R2: Resistance 2: Next Resistance level after R1. R3: Resistance 3: Next Resistance level after R2. S1: Support 1: 1st Support level after Pivot Point, S2: Support 2: Next Support level after S1. S3: Support 3: Next Support level after S2. Note: As per this tool, the trader should take BUY position just above the Pivot Point and keep the Pivot Point level as stop loss and the first target would be R1 level (Resistance 1). If R1 is crossed then R2 (Resistance 2) becomes the next target with the stop loss placed at R1 level. If R2 is crossed then R3 (Resistance 3) becomes the next target with the stop loss placed at R2 level. Similarly if price goes below the Pivot Point the trader should take a SELL position and keep the Pivot Point level as the stop loss and the first target would be S1 level (Support 1). If S1 level is breached then S2 level (Support 2) becomes the next target with the stop loss placed at S1 level. If S2 level is breached then S3 level (Support 3) becomes the next target with the stop loss placed at S2 level. Disclaimer: This document is not for public distribution and has been furnished to you solely for your information and must not be reproduced or redistributed to any other person. Persons into whose possession this document may come are required to observe these restrictions. This material is for the personal information of the authorized recipient, and we are not soliciting any action based upon it. This report is not to be construed as an offer to sell or the solicitation of an offer to buy any security in any jurisdiction where such an offer or solicitation would be illegal. It is for the general information of clients of Keynote Capitals Ltd. It does not constitute a personal recommendation or take into account the particular investment objectives, financial situations, or needs of individual clients. We have reviewed the report, and in so far as it includes current or historical information, it is believed to be reliable though its accuracy or completeness cannot be guaranteed. Neither Keynote Capitals Ltd., nor any person connected with it, accepts any liability arising from the use of this document. The recipients of this material should rely on their own investigations and take their own professional advice. Price and value of the investments referred to in this material may go up or down. Past performance is not a guide for future performance. Certain transactions -including those involving futures, options and other derivatives as well as non-investment grade securities - involve substantial risk and are not suitable for all investors. Reports based on technical analysis centers on studying charts of a stock’s price movement and trading volume, as opposed to focusing on a company’s fundamentals and as such, may not match with a report on a company’s fundamentals. Opinions expressed are our current opinions as of the date appearing on this material only. While we endeavor to update on a reasonable basis the information discussed in this material, there may be regulatory, compliance, or other reasons that prevent us from doing so. Prospective investors and others are cautioned that any forward-looking statements are not predictions and may be subject to change without notice. Our proprietary trading and investment businesses may make investment decisions that are inconsistent with the recommendations expressed herein. We and our affiliates, officers, directors, and employees world wide may: (a) from time to time, have long or short positions in, and buy or sell the securities thereof, of company (ies) mentioned herein or (b) be engaged in any other transaction involving such securities and earn brokerage or other compensation or act as a market maker in the financial instruments of the company (ies) discussed herein or act as advisor or lender / borrower to such company (ies) or have other potential conflict of interest with respect to any recommendation and related information and opinions. The analyst for this report certifies that all of the views expressed in this report accurately reflect his or her personal views about the subject company or companies and its or their securities, and no part of his or her compensation was, is or will be, directly or indirectly related to specific recommendations or views expressed in this report. No part of this material may be duplicated in any form and/or redistributed without Keynote Capitals Ltd’s., prior written consent. Keynote Capitals Ltd. The Ruby, 9th Floor, Senapati Bapat Marg, Dadar (W), Mumbai, India – 400028 Tel: 30266000 / 22694322 www.keynotecapitals.com