Keynote technicals commodity intraday levels for 210213
•
0 recomendaciones•464 vistas


Recomendados
Recomendados
Más contenido relacionado
Más de Keynote Capitals Ltd.
Más de Keynote Capitals Ltd. (20)
Keynote technicals commodity intraday levels for 210213
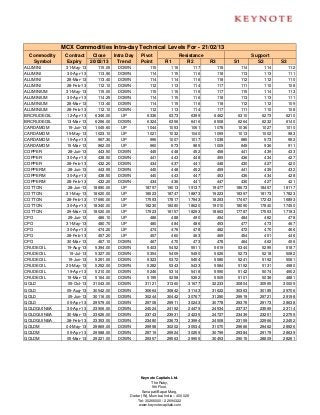
- 1. MCX Commodities Intra-day Technical Levels For - 21/02/13 Commodity Contract Close Intra Day Pivot Resistance Support Symbol Expiry 20/02/13 Trend Point R1 R2 R3 S1 S2 S3 ALUMINI 31-May-13 115.05 DOWN 115 116 117 118 114 114 112 ALUMINI 30-Apr-13 113.90 DOWN 114 115 116 118 113 113 111 ALUMINI 28-Mar-13 113.40 DOWN 114 114 116 118 112 112 110 ALUMINI 28-Feb-13 112.10 DOWN 112 113 114 117 111 110 108 ALUMINIUM 31-May-13 115.00 DOWN 115 115 116 117 115 114 113 ALUMINIUM 30-Apr-13 114.25 DOWN 114 115 116 118 113 113 111 ALUMINIUM 28-Mar-13 113.40 DOWN 114 115 116 118 112 112 109 ALUMINIUM 28-Feb-13 112.10 DOWN 112 113 114 117 111 110 108 BRCRUDEOIL 12-Apr-13 6346.00 UP 6336 6373 6399 6462 6310 6273 6210 BRCRUDEOIL 13-Mar-13 6296.00 DOWN 6324 6356 6416 6508 6264 6232 6140 CARDAMOM 15-Jun-13 1045.60 UP 1044 1053 1061 1078 1036 1027 1010 CARDAMOM 15-May-13 1023.10 UP 1021 1032 1040 1059 1013 1002 983 CARDAMOM 15-Apr-13 997.30 UP 995 1007 1017 1038 985 973 952 CARDAMOM 15-Mar-13 962.00 UP 960 973 985 1009 949 936 911 COPPER 28-Jun-13 443.50 DOWN 445 448 452 458 441 439 433 COPPER 30-Apr-13 438.50 DOWN 441 443 448 455 436 434 427 COPPER 28-Feb-13 432.20 DOWN 434 437 441 448 430 427 420 COPPERM 28-Jun-13 443.55 DOWN 445 448 452 459 441 439 432 COPPERM 30-Apr-13 438.50 DOWN 440 443 447 453 436 434 428 COPPERM 28-Feb-13 432.20 DOWN 434 436 441 447 430 427 421 COTTON 28-Jun-13 18890.00 UP 18797 19013 19137 19477 18673 18457 18117 COTTON 31-May-13 18620.00 UP 18523 18747 18873 19223 18397 18173 17823 COTTON 28-Feb-13 17690.00 UP 17593 17817 17943 18293 17467 17243 16893 COTTON 30-Apr-13 18340.00 UP 18230 18480 18620 19010 18090 17840 17450 COTTON 29-Mar-13 18020.00 UP 17923 18157 18293 18663 17787 17553 17183 CPO 29-Jun-13 486.10 UP 486 488 490 494 484 482 478 CPO 31-May-13 480.70 UP 480 484 486 493 477 473 467 CPO 30-Apr-13 474.20 UP 474 476 478 482 472 470 466 CPO 28-Feb-13 457.20 UP 457 460 463 469 454 451 446 CPO 30-Mar-13 467.10 DOWN 467 470 473 478 464 462 456 CRUDEOIL 19-Aug-13 5394.00 DOWN 5403 5452 5511 5619 5344 5295 5187 CRUDEOIL 19-Jul-13 5327.00 DOWN 5354 5409 5490 5626 5273 5218 5082 CRUDEOIL 19-Jun-13 5291.00 DOWN 5323 5372 5454 5585 5241 5192 5061 CRUDEOIL 20-May-13 5252.00 DOWN 5282 5343 5433 5584 5192 5131 4980 CRUDEOIL 19-Apr-13 5210.00 DOWN 5246 5314 5418 5590 5142 5074 4902 CRUDEOIL 19-Mar-13 5164.00 DOWN 5195 5258 5352 5509 5101 5038 4881 GOLD 05-Oct-13 31043.00 DOWN 31121 31360 31677 32233 30804 30565 30009 GOLD 05-Aug-13 30542.00 DOWN 30664 30842 31143 31622 30363 30185 29706 GOLD 05-Jun-13 30116.00 DOWN 30244 30442 30767 31290 29919 29721 29198 GOLD 05-Apr-13 29579.00 DOWN 29708 29911 30243 30778 29376 29173 28638 GOLDGUINEA 30-Apr-13 23906.00 DOWN 24024 24192 24479 24934 23737 23569 23114 GOLDGUINEA 30-Mar-13 23626.00 DOWN 23743 23931 24235 24727 23439 23251 22759 GOLDGUINEA 28-Feb-13 23353.00 DOWN 23480 23673 23994 24508 23159 22966 22452 GOLDM 04-May-13 29869.00 DOWN 29998 30202 30534 31070 29666 29462 28926 GOLDM 05-Apr-13 29588.00 DOWN 29719 29924 30259 30799 29384 29179 28639 GOLDM 05-Mar-13 29221.00 DOWN 29357 29563 29905 30453 29015 28809 28261 Keynote Capitals Ltd. The Ruby, 9th Floor, Senapati Bapat Marg, Dadar (W), Mumbai, India – 400028 Tel: 30266000 / 22694322 www.keynotecapitals.com
- 2. MCX Commodities Intra-day Technical Levels For - 21/02/13 Commodity Contract Close Intra Day Pivot Resistance Support Symbol Expiry 20/02/13 Trend Point R1 R2 R3 S1 S2 S3 GOLDPETAL 30-Apr-13 2986.00 DOWN 3001 3022 3057 3113 2966 2945 2889 GOLDPETAL 30-Mar-13 2954.00 DOWN 2969 2994 3033 3097 2930 2905 2841 GOLDPETAL 28-Feb-13 2922.00 DOWN 2937 2959 2995 3053 2901 2879 2821 GOLDPTLDEL 30-Apr-13 3049.00 DOWN 3051 3070 3090 3129 3031 3012 2973 GOLDPTLDEL 30-Mar-13 2991.00 DOWN 3005 3030 3068 3131 2967 2942 2879 GOLDPTLDEL 28-Feb-13 2944.00 DOWN 2960 2990 3035 3110 2915 2885 2810 KAPAS 30-Mar-13 918.20 UP 909 930 942 976 897 875 842 KAPAS 30-Apr-13 960.00 UP 951 972 984 1018 939 917 883 KAPASKHALI 31-May-13 1417.00 UP 1414 1424 1430 1446 1408 1398 1382 KAPASKHALI 30-Apr-13 1391.00 UP 1387 1398 1406 1425 1379 1368 1349 KAPASKHALI 28-Feb-13 1331.50 UP 1326 1338 1345 1364 1319 1307 1288 KAPASKHALI 30-Mar-13 1360.50 UP 1355 1368 1376 1396 1348 1335 1314 LEAD 31-May-13 128.75 DOWN 129 130 130 132 128 127 126 LEAD 30-Apr-13 128.00 DOWN 128 129 130 132 127 127 125 LEAD 28-Mar-13 127.55 DOWN 128 129 130 132 127 126 124 LEAD 28-Feb-13 126.85 DOWN 127 128 130 132 126 125 123 LEADMINI 31-May-13 128.30 DOWN 129 129 130 131 128 127 126 LEADMINI 30-Apr-13 127.90 DOWN 128 129 130 132 127 127 125 LEADMINI 28-Mar-13 127.55 DOWN 128 129 130 132 127 126 124 LEADMINI 28-Feb-13 126.85 DOWN 127 128 129 131 126 125 123 MENTHAOIL 31-May-13 1142.50 UP 1141 1149 1155 1168 1135 1127 1114 MENTHAOIL 30-Apr-13 1240.50 UP 1238 1252 1263 1287 1227 1214 1190 MENTHAOIL 30-Mar-13 1308.20 UP 1303 1318 1328 1353 1293 1278 1253 MENTHAOIL 28-Feb-13 1435.40 UP 1432 1450 1464 1497 1417 1399 1367 NATURALGAS 25-Apr-13 186.60 UP 186 188 189 192 185 184 181 NATURALGAS 25-Mar-13 182.50 UP 182 184 185 188 181 179 177 NATURALGAS 25-Feb-13 178.50 UP 178 180 181 184 177 175 172 NICKEL 31-May-13 942.70 DOWN 948 956 968 989 935 927 907 NICKEL 30-Apr-13 938.50 DOWN 943 953 968 992 929 919 894 NICKEL 28-Mar-13 931.00 DOWN 937 947 963 990 921 910 884 NICKEL 28-Feb-13 923.40 DOWN 930 941 959 988 912 901 872 NICKELM 31-May-13 944.70 DOWN 949 958 972 995 936 927 904 NICKELM 30-Apr-13 939.00 DOWN 944 955 970 997 928 917 891 NICKELM 28-Mar-13 931.10 DOWN 937 947 963 989 921 911 885 NICKELM 28-Feb-13 923.40 DOWN 929 940 956 983 913 902 875 POTATO 15-Apr-13 825.40 UP 823 829 833 844 819 812 802 POTATO 15-Mar-13 845.80 UP 845 851 856 868 840 833 822 POTATO 15-May-13 825.40 UP 824 830 834 845 820 814 803 SILVER 05-Jul-13 56467.00 DOWN 56850 57630 58793 60736 55687 54907 52964 SILVER 04-May-13 55194.00 DOWN 55551 56373 57553 59555 54371 53549 51547 SILVER 05-Mar-13 53720.00 DOWN 54088 54910 56100 58112 52898 52076 50064 SILVER1000 30-Apr-13 55159.00 DOWN 55222 55937 56715 58208 54444 53729 52236 SILVER1000 28-Feb-13 53261.00 DOWN 53681 54560 55860 58039 52381 51502 49323 SILVER1000 30-Mar-13 54645.00 DOWN 54782 55663 56681 58580 53764 52883 50984 SILVERM 29-Jun-13 56532.00 DOWN 56888 57714 58895 60902 55707 54881 52874 SILVERM 30-Apr-13 55227.00 DOWN 55601 56416 57606 59611 54411 53596 51591 SILVERM 28-Feb-13 53729.00 DOWN 54103 54925 56120 58137 52908 52086 50069 SILVERMIC 29-Jun-13 56533.00 DOWN 56881 57752 58971 61061 55662 54791 52701 SILVERMIC 30-Apr-13 55230.00 DOWN 55590 56424 57619 59648 54395 53561 51532 SILVERMIC 28-Feb-13 53728.00 DOWN 54103 54925 56123 58143 52905 52083 50063 Keynote Capitals Ltd. The Ruby, 9th Floor, Senapati Bapat Marg, Dadar (W), Mumbai, India – 400028 Tel: 30266000 / 22694322 www.keynotecapitals.com
- 3. MCX Commodities Intra-day Technical Levels For - 21/02/13 Commodity Contract Close Intra Day Pivot Resistance Support Symbol Expiry 20/02/13 Trend Point R1 R2 R3 S1 S2 S3 STEELRPR 20-May-13 31850.00 UP 31740 32100 32350 32960 31490 31130 30520 STEELRPR 20-Feb-13 30410.00 UP 30390 30620 30830 31270 30180 29950 29510 STEELRPR 20-Mar-13 30920.00 UP 30843 31027 31133 31423 30737 30553 30263 STEELRPR 18-Apr-13 31330.00 UP 31223 31507 31683 32143 31047 30763 30303 ZINC 31-May-13 117.20 DOWN 117 118 118 120 117 116 115 ZINC 30-Apr-13 116.40 DOWN 117 117 118 119 116 115 114 ZINC 28-Mar-13 115.75 DOWN 116 117 117 119 115 115 113 ZINC 28-Feb-13 114.85 DOWN 115 116 117 118 114 114 112 ZINCMINI 31-May-13 117.05 DOWN 117 118 119 120 117 116 115 ZINCMINI 30-Apr-13 116.40 DOWN 117 117 118 120 116 115 114 ZINCMINI 28-Mar-13 115.75 DOWN 116 117 117 119 115 115 113 ZINCMINI 28-Feb-13 114.85 DOWN 115 116 117 118 114 114 112 Sanjay Bhatia (AVP – Technical Research), Email Id sanjay@keynotecapitals.net Pivot Point: Intra- Day Trading Tool. - The key to the use of this tool is the use of Stop Loss Intra Day Trend: It is valid only till the point where Price trades above Pivot Point. For Eg. “UP” would be valid till Price remains above Pivot Point. It would become “DOWN” in event Price trades below Pivot Point. Pivot Point (PP): This is a trigger point for Intra Day Buy / Sell based on the price range of the previous day. R1: Resistance 1: 1st Resistance level over Pivot Point, R2: Resistance 2: Next Resistance level after R1. R3: Resistance 3: Next Resistance level after R2. S1: Support 1: 1st Support level after Pivot Point, S2: Support 2: Next Support level after S1. S3: Support 3: Next Support level after S2. Note: As per this tool, the trader should take BUY position just above the Pivot Point and keep the Pivot Point level as stop loss and the first target would be R1 level (Resistance 1). If R1 is crossed then R2 (Resistance 2) becomes the next target with the stop loss placed at R1 level. If R2 is crossed then R3 (Resistance 3) becomes the next target with the stop loss placed at R2 level. Similarly if price goes below the Pivot Point the trader should take a SELL position and keep the Pivot Point level as the stop loss and the first target would be S1 level (Support 1). If S1 level is breached then S2 level (Support 2) becomes the next target with the stop loss placed at S1 level. If S2 level is breached then S3 level (Support 3) becomes the next target with the stop loss placed at S2 level. Disclaimer: This document is not for public distribution and has been furnished to you solely for your information and must not be reproduced or redistributed to any other person. Persons into whose possession this document may come are required to observe these restrictions. This material is for the personal information of the authorized recipient, and we are not soliciting any action based upon it. This report is not to be construed as an offer to sell or the solicitation of an offer to buy any security in any jurisdiction where such an offer or solicitation would be illegal. It is for the general information of clients of Keynote Capitals Ltd. It does not constitute a personal recommendation or take into account the particular investment objectives, financial situations, or needs of individual clients. We have reviewed the report, and in so far as it includes current or historical information, it is believed to be reliable though its accuracy or completeness cannot be guaranteed. Neither Keynote Capitals Ltd., nor any person connected with it, accepts any liability arising from the use of this document. The recipients of this material should rely on their own investigations and take their own professional advice. Price and value of the investments referred to in this material may go up or down. Past performance is not a guide for future performance. Certain transactions - including those involving futures, options and other derivatives as well as non-investment grade securities - involve substantial risk and are not suitable for all investors. Reports based on technical analysis centers on studying charts of a stock’s price movement and trading volume, as opposed to focusing on a company’s fundamentals and as such, may not match with a report on a company’s fundamentals. Opinions expressed are our current opinions as of the date appearing on this material only. While we endeavor to update on a reasonable basis the information discussed in this material, there may be regulatory, compliance, or other reasons that prevent us from doing so. Prospective investors and others are cautioned that any forward-looking statements are not predictions and may be subject to change without notice. Our proprietary trading and investment businesses may make investment decisions that are inconsistent with the recommendations expressed herein. We and our affiliates, officers, directors, and employees world wide may: (a) from time to time, have long or short positions in, and buy or sell the securities thereof, of company (ies) mentioned herein or (b) be engaged in any other transaction involving such securities and earn brokerage or other compensation or act as a market maker in the financial instruments of the company (ies) discussed herein or act as advisor or lender / borrower to such company (ies) or have other potential conflict of interest with respect to any recommendation and related information and opinions. The analyst for this report certifies that all of the views expressed in this report accurately reflect his or her personal views about the subject company or companies and its or their securities, and no part of his or her compensation was, is or will be, directly or indirectly related to specific recommendations or views expressed in this report. No part of this material may be duplicated in any form and/or redistributed without Keynote Capitals Ltd’s., prior written consent. Keynote Capitals Ltd. The Ruby, 9th Floor, Senapati Bapat Marg, Dadar (W), Mumbai, India – 400028 Tel: 30266000 / 22694322 www.keynotecapitals.com