Startup cycle and VC funding
•
2 recomendaciones•700 vistas

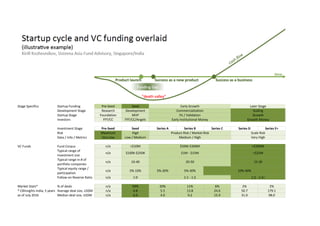
Startup cycle and VC funding overlaid, some top-line VC statistics for India from CBInsights
Recomendados

Recomendados
Más contenido relacionado
La actualidad más candente
La actualidad más candente (19)
Destacado
Destacado (20)
Similar a Startup cycle and VC funding
Similar a Startup cycle and VC funding (20)
Más de Kirill (Kyril) Kozhevnikov
Más de Kirill (Kyril) Kozhevnikov (8)
Último
Último (15)
Startup cycle and VC funding
- 1. Stage Specifics Startup Funding Pre-Seed Seed Development Stage Research Development Startup Stage Foundation MVP Investors FFF/CC FFF/CC/Angels Investment Stage Pre-Seed Seed Series A Series B Series C Series D Series E+ Risk Maximum High Data / Info / Metrics Very low Low / Medium VC Funds Fund Corpus n/a <$10M Typical range of investment size n/a $100K-$250K Typical range in # of portfolio companies n/a 10-40 Typical equity range / participation n/a 5%-10% 5%-20% 5%-30% Follow-on Reserve Ratio n/a 1:0 Market Stats* % of deals n/a 59% 20% 11% 6% 2% 2% * CBInsights India, 5 years Average deal size, US$M n/a 0.8 5.5 13.8 24.6 50.7 179.1 as of July 2016 Median deal size, US$M n/a 0.4 4.0 9.2 15.9 31.0 98.0 10%-40% 1:1 - 1:2 1:2 - 1:3+ $50M-$300M >$300M $1M - $15M >$25M 20-50 15-30 Early Institutional Money Growth Money Product Risk / Market Risk Scale Risk Medium / High Very High Early Growth Later Stage Commercialization Scaling Fit / Validation Growth Product launch Success as a new product Success as a business cme Funding Gap "death valley" Startup cycle and VC funding overlaid (illustracve example) Kirill Kozhevnikov, Sistema Asia Fund Advisory, Singapore/India