
Recomendados
Más contenido relacionado
La actualidad más candente
La actualidad más candente (19)
Similar a Strategic Management:Business Level Strategies, Corporate level Analysis,
Similar a Strategic Management:Business Level Strategies, Corporate level Analysis, (20)
Último
Último (20)
Strategic Management:Business Level Strategies, Corporate level Analysis,
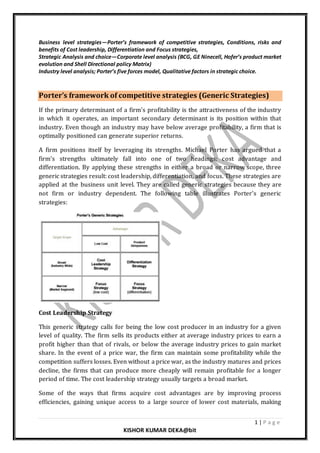
- 1. 1 | P a g e KISHOR KUMAR DEKA@bit Business level strategies—Porter’s framework of competitive strategies, Conditions, risks and benefits of Cost leadership, Differentiation and Focus strategies, Strategic Analysis and choice—Corporate level analysis (BCG, GE Ninecell, Hofer’s product market evolution and Shell Directional policy Matrix) Industry level analysis; Porter’s five forces model, Qualitative factors in strategic choice. Porter’s framework of competitive strategies (Generic Strategies) If the primary determinant of a firm's profitability is the attractiveness of the industry in which it operates, an important secondary determinant is its position within that industry. Even though an industry may have below average profitability, a firm that is optimally positioned can generate superior returns. A firm positions itself by leveraging its strengths. Michael Porter has argued that a firm's strengths ultimately fall into one of two headings: cost advantage and differentiation. By applying these strengths in either a broad or narrow scope, three generic strategies result: cost leadership, differentiation, and focus. These strategies are applied at the business unit level. They are called generic strategies because they are not firm or industry dependent. The following table illustrates Porter's generic strategies: Cost Leadership Strategy This generic strategy calls for being the low cost producer in an industry for a given level of quality. The firm sells its products either at average industry prices to earn a profit higher than that of rivals, or below the average industry prices to gain market share. In the event of a price war, the firm can maintain some profitability while the competition suffers losses. Even without a price war, as the industry matures and prices decline, the firms that can produce more cheaply will remain profitable for a longer period of time. The cost leadership strategy usually targets a broad market. Some of the ways that firms acquire cost advantages are by improving process efficiencies, gaining unique access to a large source of lower cost materials, making
- 2. 2 | P a g e KISHOR KUMAR DEKA@bit optimal outsourcing and vertical integration decisions, or avoiding some costs altogether. If competing firms are unable to lower their costs by a similar amount, the firm may be able to sustain a competitive advantage based on cost leadership. Firms that succeed in cost leadership often have the following internal strengths: Access to the capital required to make a significant investment in production assets; this investment represents a barrier to entry that many firms may not overcome. Skill in designing products for efficient manufacturing, for example, having a small component count to shorten the assembly process. High level of expertise in manufacturing process engineering. Efficient distribution channels. Each generic strategy has its risks, including the low cost strategy. For example, other firms may be able to lower their costs as well. As technology improves, the competition may be able to leapfrog the production capabilities, thus eliminating the competitive advantage. Additionally, several firms following a focus strategy and targeting various narrow markets may be able to achieve an even lower cost within their segments and as a group gain significant market share. Differentiation Strategy A differentiation strategy calls for the development of a product or service that offers unique attributes that are valued by customers and that customers perceive to be better than or different from the products of the competition. The value added by the uniqueness of the product may allow the firm to charge a premium price for it. The firm hopes that the higher price will more than cover the extra costs incurred in offering the unique product. Because of the product's unique attributes, if suppliers increase their prices the firm may be able to pass along the costs to its customers who cannot find substitute products easily. Firms that succeed in a differentiation strategy often have the following internal strengths: Access to leading scientific research. Highly skilled and creative product development team. Strong sales team with the ability to successfully communicate the perceived strengths of the product. Corporate reputation for quality and innovation. The risks associated with a differentiation strategy include imitation by competitors and changes in customer tastes. Additionally, various firms pursuing focus strategies may be able to achieve even greater differentiation in their market segments.
- 3. 3 | P a g e KISHOR KUMAR DEKA@bit Focus Strategy The focus strategy concentrates on a narrow segment and within that segment attempts to achieve either a cost advantage or differentiation. The premise is that the needs of the group can be better serviced by focusing entirely on it. A firm using a focus strategy often enjoys a high degree of customer loyalty, and this entrenched loyalty discourages other firms from competing directly. Because of their narrow market focus, firms pursuing a focus strategy have lower volumes and therefore less bargaining power with their suppliers. However, firms pursuing a differentiation focused strategy may be able to pass higher costs on to customers since close substitute products do not exist. Firms that succeed in a focus strategy are able to tailor a broad range of product development strengths to a relatively narrow market segment that they know very well. Some risks of focus strategies include imitation and changes in the target segments. Furthermore, it may be fairly easy for a broad market cost leader to adapt its product in order to compete directly. Finally, other focusers may be able to carve out sub segments that they can serve even better. PORTER'S FIVE FORCES MODEL (Industry analysis model) Introduction Porter's fives forces model is an excellent model to analyse a particular industry. It looks at the five main factors that affect a particular industry: 1) Competitive rivalry 2) Power ofsuppliers 3) Power of buyers 4) Threats of substitutes 5) Threat of new entrants. As the above factors influence industry performance, it is useful to find out about these factors before you enter an industry or if you are wondering why your business industry is not doing well.
- 4. 4 | P a g e KISHOR KUMAR DEKA@bit Competitive Rivalry Competitive rivalry is a good starting point to when analysing a particular industry. If entry to an industry is easy then competitive rivalry is likely to be high. If it is easy for customers to move to substitute products for example from coke to water then again rivalry will be high. Generally competitive rivalry will be high if: • There is little differentiation between the products sold by competitors. • Competitors are approximately the same size of each other. • If competitors have similar strategies. • It is costly to leave the industry (exit barriers) Power of Suppliers Suppliers are also essential for the success of an organisation as they provide businesses with the resources they need to produce their products and services. Supplier power can come from: • If there is one or just a few suppliers that can provide the resources a business needs. • If it is expensive to move from one supplier to another (known also as switching cost) • If there is no other substitute for the product provided by the supplier. Power of Buyers Buyers or customers can exert influence and control over an industry in certain circumstances. This happens when: • There is little differentiation over the product and substitutes can be found easily by customers/buyers. • Buyers/customers are sensitive to price fluctuations. • Switching to another product is not costly for customers/buyers. Threat of Substitutes Are there alternative products that customers can purchase instead of yours? alternative products that offer the same benefit as your products? The threat from substitute (competitor) products is high when: • The price of the substitute (competitor) product falls. • It is easy for consumers to switch from one substitute product to another. • Buyers are willing to substitute products from different competitors. Threat of New Entrant The threat of new organisations entering the industry is high when it is easy for an organisation to enter the industry i.e. entry barriers are low.When a new business is deciding whether to enter an industry it will look at: How loyal customers are to existing products, How quickly it can achieve economy of scales Would it have access to suppliers and
- 5. 5 | P a g e KISHOR KUMAR DEKA@bit Would government legislation prevent them or encourage them to enter the industry. To Summarize it can be said that Porter's five forces model is an essential analysis/ analytical tool if you want to understand an industry. All five of Porter's forces affect the strength of an industry and the prices that an industry can charge. BCG Matrix (Growth Market Share Matrix) to review your product portfolio The Boston Consulting group’s product portfolio matrix (BCG) is designed to help with long-term strategic planning, to help a business consider growth opportunities by reviewing its portfolio of products to decide where to invest, to discontinue or develop products. The Matrix is divided into 4 quadrants derived on market growth and relative market share, as shown in the diagram below. 1. Dogs: These are products with low growth or market share. 2. Question marks orProblem Child: Products in high growth markets with low market share. 3. Stars: Products in high growth markets with high market share. 4. Cash cows: Products in low growth markets with high market share How to use the BCG Matrix? To look at each of these quadrants, here are some tips: Dogs: The usual marketing advice is to remove any dogs from your product portfolio as they are a drain on resources. However, some can generate ongoing revenue with little cost. For example, in the automotive sector, when a car line ends, there is still a need for spare parts. As SAAB ceased trading and producing new cars, a whole business has emerged providing SAAB parts. Question marks: Named this, as it’s not known if they will become a star or drop into the dog quadrant. These products often require significant investment to push them into the star quadrant. The challenge is that a lot of investment may
- 6. 6 | P a g e KISHOR KUMAR DEKA@bit be required to get a return. For example, Rovio, creators of the very successful Angry Birds game has developed many other games you may not have heard of. Computer games companies often develop hundreds of games before gaining one successful game. It’s not always easy to spot the future star and this can result in potentially wasted funds. Stars: Can be the market leader though requires ongoing investment to sustain. They generate more ROI than other product categories. Cash cows: ‘Milk these products as much as possible without killing the cow!. Often mature, well established products. The company Procter & Gamble which manufactures Pampers nappies to Lynx deodorants has often been described as a ‘cash cow company’. GE NINE CELL MATRIX Another popular “Corporate Portfolio Analysis” technique is the result of pioneering effort of General Electric Company along with McKinsey Consultants which is known as the GE NINE CELL MATRIX. GE nine-box matrix is a strategy tool that offers a systematic approach for the multi business enterprises to prioritize their investments among the various business units. It is a framework that evaluates business portfolio and provides further strategic implications. Each business is appraised in terms of two major dimensions – Market Attractiveness and Business Strength. If one of these factors is missing, then the business will not produce desired results. Neither a strong company operating in an unattractive market, nor a weak company operating in an attractive market will do very well. The vertical axis denotes industry attractiveness, which is a weighted composite rating based on eight different factors. They are: 1. Market Size and growth rate
- 7. 7 | P a g e KISHOR KUMAR DEKA@bit 2. Industry Profit Margins 3. Intensity of Competition 4. Seasonality 5. Product Life cycle Changes 6. Economies of scale 7. Technology 8. Social, Environmental, Legal and Human Impacts What does the horizontal axis represent? It indicates business strength or in other words competitive position, which is again a weighted composite rating based on seven factors as listed below: 1. Relative market share 2. Profit margins 3. Ability to compete on #price and quality 4. Knowledge of customer and market 5. Competitive strength and weakness 6. Technological capability 7. Caliber of management The two composite values for industry attractiveness and competitive position are plotted for each strategic business unit (SBU) in a COMPANY’S PORTFOLIO. The PIE chart (circles) denotes the proportional size of the industry and the dark segments denote the company’s respective market share. The nine cells of the GE matrix are grouped on the basis of low to high industry attractiveness, and weak to strong business strength. Three zones of three cells each are made, indicating different combinations represented by green, yellow and red colors. So it is also called ‘Stoplight Strategy Matrix’, similar to the traffic signal. The green zone suggests you to ‘go ahead’, to grow and build, pushing you through expansion strategies. Businesses in the green zone attract major investment. Yellow cautions you to ‘wait and see’ indicating hold and maintain type of strategies aimed at stability. Red indicates that you have to adopt turnover strategies of divestment and liquidation or rebuilding approach. Grow – Business units that fall under grow attract high investment. Firms may go for product differentiation or Cost leadership. Huge cash is generated in this phase. Market leaders exist in this phase. Hold – Business units that fall under hold phase attract moderate investment. Market segmentation, Market penetration, imitation strategies are adopted in this phase. Followers exist in this phase. Harvest - Business units that fall under this phase are unattractive. Low priority is given in these business units. Strategies like divestment, Diversification, mergers are adopted in this phase.
- 8. 8 | P a g e KISHOR KUMAR DEKA@bit This matrix offers some advantages over BCG matrix in that, it offers intermediate classification of medium and average ratings. It also integrates a larger variety of strategic variables like the market share and industry size. Advantages 1. Helps to prioritize the limited resources in order to achieve the best returns. 2. The performance of products or business units becomes evident. 3. It’s more sophisticated business portfolio framework than the BCG matrix. 4. Determines the strategic steps the company needs to adopt to improve the performance of its business portfolio. Disadvantages 1. Needs a consultant or an expert to determine industry’s attractiveness and business unit strength as accurately as possible. 2. It is expensive to conduct. 3. It doesn’t take into account the harmony that could exist between two or more business units. Options for each cell 1. Protect position -maintain position 2. Try harder - challenge the leader 3. Be choosy - keep an eye of opportunities – if risk is low 4. Harvest - reduce cost to maximise profits 5. Manage carefully 6. Grow wisely - invest in attractive areas 7. Regroup - preserve cash flow, defend strengths 8. Keep investment to a minimum- protect the position that you have 9. Get out Channon and McCosh devised a set of generic investment strategies for the GE McKinsey matrix as labelled in the previous diagram. A. T. Kearney also put forward guidelines for strategies in the different boxes and where these have not been incorporated they are mentioned below. (ATK = A.T. Kearny)* 1. Grow / Penetrate – These businesses are a target for investment, they have strong business strengths, are in attractive markets and they should therefore have high returnson investmentandcompetitive advantage.Theyshouldreceive financialand managerial supporttomaintaintheirstrongpositionandtocontinue contributingto long-term profitability. *ATK – Seek dominance
- 9. 9 | P a g e KISHOR KUMAR DEKA@bit Grow Maximise investment 2. Invest for Growth – Businesses here are in very attractive industries but have average business strength. They should be invested in to improve their long-term competitive position. ATK – Evaluate potential for leadership via segmentation Identify weaknesses Build strengths 3. SelectiveInvestmentorDivestment - These businessesare inveryattractive markets but their business strength is weak. Investment must be aimed at improving the business strengths. These businesses will probably have to be funded by other businesses in the group as they are not self-funding. Only businesses that can improve their strengths should be retained – if not they should be divested. ATK – Specialise Seek niches Consider acquisitions 4. SelectiveHarvestorInvestment–Businessesinthisbox have goodbusinessstrength inan industrythat islosingitsattractiveness.Theyshouldbe supported if necessary but theymaybe self-supportingincashflow terms.Selective harvesting is an option to extractcash flowbut this should be done with caution so as not to run down the business prematurely. ATK – Identify growth segments Invest strongly Maintain position elsewhere 5. Segment and Selective Investment – Businesses with average business strengths and in average industries can improve their positions by creative segmentation to create profitable segmentsandbyselective investmenttosupportthe segmentation strategy.The businessneedstocreate superiorreturnsbyconcentratingonbuilding segment barriers to differentiate themselves. ATK – Identify growth segments Specialise Invest selectively 6. ControlledExitor Harvest – Businesseswithweakbusinessstrengthsin moderately attractive industriesare candidatesfora controlledexit or divestment. Attempts to gainmarketshare byincreasingbusinessstrengthscouldprove tobe veryexpensive and must be done with caution ATK – Specialise Seek niches Consider exit 7. Harvest for Cash Generation – Strongbusinessesinunattractive markets should be net cash generators and could provide funds for use throughout the rest of the portfolio. Investment should be aimed at keeping these businesses in a dominant position of strength but over investment can be disastrous especially in a mature market. Be aware of competitors trying to revitalise mature industries ATK – Maintain overall position
- 10. 10 | P a g e KISHOR KUMAR DEKA@bit Seek cash flow Invest at maintenance level 8. Controlled Harvest – They have average business strengths in an unattractive market and the strategy should be to harvest the business in a controlled way to prevent a defeat or the business could be used to upset a competitor. ATK – Prune lines Minimise investment Position to divest 9. Rapid Exit or Attack Business – These businesses have neither strengths nor an attractive industryandshouldbe exited.Investments made should only be done to fund the exit. ATK – Trust leaders statesmanship Go after competitors cash generators Time exit and divest Hofers Product-market Evolution Matrix The GE Business Screen is not without controversy. Some observes argue that there is too much subjectivity in the construction of the matrix. According to Hofer and Schendel, "The Principal difficulty with GE Business Screen is that it does not depict as affectively at it might the positions of new businesses that are just starting to grow in new industries. In such instances, it may be preferable to use a fifteen-cell matrix in which businesses are plotted in terms of their competitive position and their stage of product/market evolution". Thus, Hofer developed the Product/Market Evolution Portfolio Matrix, or Life Cycle Matrix. Several useful ideas concerning the strategic alternatives available to each business unit emerge from an analysis of Figure .
- 11. 11 | P a g e KISHOR KUMAR DEKA@bit -Business unit A would to be a developing winner. Its relatively large share of the market combined with its being at the development stage of product- market evolution and its potential for being in a strong competitive position make it a good candidate for receiving more corporate resources. -Business unit B is somewhat similar to A. However, it has a relatively small share of the market given its strong competitive position. A strategy would have to be developed to overcome this low market share in order to justify more investments. -Business unit C might be classified as a potential loser. A strategy must be developed to overcome the low market share and weak competitive position in order to justify future investments. -Business unit D is in a shakeout period, has a relatively large share of the market, and is in a relatively strong position. Investment should be made to maintain that position. -Business units E and F are cash cows and should be used for cash generation. -Business unit G appears to be a dog. It should be managed to generate cash in the short run, if possible; however, the long-run strategy will more the likely be divestment or liquidation. It has been suggested that most portfolios are variations of one of three ideal types: growth, profit, balanced Shell Directional Policy Matrix • Another refinement upon the Boston Matrix • Along the horizontal axis are prospects for sector profitability, and along the vertical axis is a company's competitive capability • The location of a Strategic Business Unit (SBU) in any cell of the matrix implies different strategic decisions • However decisions often span options and in practice the zones are an irregular shape and do not tend to be accommodated by box shapes. Instead they blend into each other.
- 12. 12 | P a g e KISHOR KUMAR DEKA@bit There follows a description of how to complete the matrix and what each of the horizontal and vertical axes in the model mean. The horizontal axis: prospects for sector profitability This includes criteria of market growth rate, market quality, industry situation and environmental considerations. On each of these factors an SBU or product is given from one to five stars. For instance, the factor of ‘market quality’ might be judged on the basis of several criteria such as pricing behaviour, past stability or profitability of that sector. The qualitative or quantitative evaluation of market quality is then converted into a rating from nought to four. The same procedure is followed for each of the other three factors, so the overall score on sector profitability is the total of the ratings on all four factors. The vertical axis: company’s competitive capability The same approach is used here, except that the company’s capabilities are assessed on the basis of market position, product research and development and production capability. These are further divided into sub-factors applicable to any particular industry. Shell emphasize that whatever strategy is eventually selected, the aim is that is should be ‘resilient’, i.e. viable in a diverse range of potential futures. Hence, each strategy ideally should be evaluated against all future possible scenarios. Each of the zones is described as follows: Leader - Major resources are focused upon the SBU Try Harder - Could be vulnerable over a longer period of time, but fine for now Double or Quit - Gamble on potential major SBU's for the future Growth - Grow the market by focusing just enough resources here Custodial - Just like a cash cow, milk it and do not commit any more resources Cash Generator - Even more like a cash cow, milk here for expansion elsewhere
- 13. 13 | P a g e KISHOR KUMAR DEKA@bit Phased Withdrawal - Move cash to SBU's with greater potential Divest - Liquidate or move these assets on a fast as you can Limitations of shells directional policy matrix The Shell directional policy matrix has been criticized on the grounds that, like the BCG approach, it assumes that the same set of factors is universally applicable for assessing the prospects of any product or business. Critics believe that the relevant factors and their relative importance will vary both according to the firm’s products and the individual characteristics of each company. In addition, the matrix does not provide any guidelines on how to implement the strategies suggested in each cell of the matrix. A Nine Celled directional Policy Matrix The Shell Directional Policy Matrix is another refinement upon the Boston Matrix. Along the horizontal axis are prospects for sector profitability, and along the vertical axis is a company’s competitive capability. As with the GE Business Screen the location of a Strategic Business Unit (SBU) in any cell of the matrix implies different strategic decisions. Double or quit – gamble on potential major SBU’s for the future. Growth – grow the market by focusing just enough resources here. Custodial – just like a cash cow, milk it and do not commit any more resources. Cash Generator – Even more like a cash cow, milk here for expansion elsewhere. Phased withdrawal – move cash to SBU’s with greater potential. Divest – liquidate or move these assets on a fast as you can. However decisions often span options and in practice the zonesare an irregular shape and do not tend to be accommodated by box shapes. Instead they blend into each other. Each of the zones is described as follows: Leader – major resources are focused upon the SBU.
- 14. 14 | P a g e KISHOR KUMAR DEKA@bit Try harder – could be vulnerable over a longer period of time, but fine for now. Subjective Factors in Strategic Choice Strategic choice is a decision. At both the corporate and the business levels, this decision determines the future strategy of the firm. After alternative strategies are examined, strategic choice is made. This is a decision to adopt one of the alternatives scrutinized. If the examination identified a clearly superior strategy, or if the current strategy will clearly meet future company objectives, then the decision is relatively simple. Such clarity is the exception, however, making the decision judgmental and difficult. Strategic decision makers, after comprehensive strategy examination, are often confronted with several viable alternatives rather than the luxury of a clear-cut, obvious choice. Under these circumstances, several factors influence the strategic choice decision. Some of the more important are: 1. Role of past strategy. 2. Degree of the firm’s external dependence. 3. Attitudes toward risk. 4. Internal political considerations and the CEO. 5. Timing. 6. Competitive reaction. ==================================== xxxxx ========================================