UK Office Space Outlook, Jan 2014

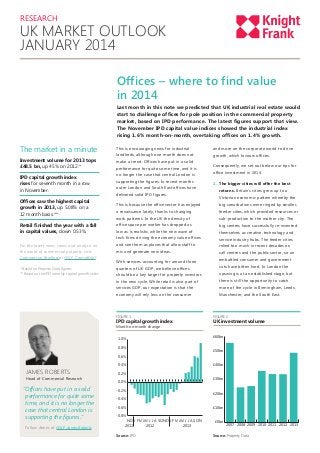
Last month in this note we predicted that UK industrial real estate would start to challenge offices for pole position in the commercial property market, based on IPD performance. The latest figures support that view. The November IPD capital value indices showed the industrial index rising 1.6% month-on-month, overtaking offices on 1.4% growth. This is encouraging news for industrial landlords, although one month does not make a trend. Offices have put in a solid performance for quite some time, and it is no longer the case that central London is supporting the figures. In recent months outer London and South East offices have delivered solid IPD figures. This is because the office sector has enjoyed a renaissance lately, thanks to changing work patterns. In the UK the density of office space per worker has dropped as low as is realistic, while the new wave of tech firms driving the economy value offices and see them as places that allow staff to mix and generate new ideas. With services accounting for around three quarters of UK GDP, we believe offices should be a key target for property investors in the new cycle. While retail is also part of services GDP, our expectation is that the economy will rely less on the consumer and more on the corporate world to drive growth, which favours offices. Consequently, we set out below our tips for office investment in 2014.

Recomendados
Recomendados
Más contenido relacionado
Más de Knight Frank LLP
Más de Knight Frank LLP (13)
Último
Último (20)
UK Office Space Outlook, Jan 2014
- 1. RESEARCH UK MARKET OUTLOOK JANUARY 2014 Offices – where to find value in 2014 Last month in this note we predicted that UK industrial real estate would start to challenge offices for pole position in the commercial property market, based on IPD performance. The latest figures support that view. The November IPD capital value indices showed the industrial index rising 1.6% month-on-month, overtaking offices on 1.4% growth. The market in a minute This is encouraging news for industrial and more on the corporate world to drive Investment volume for 2013 tops £48.5 bn, up 45% on 2012.* landlords, although one month does not growth, which favours offices. make a trend. Offices have put in a solid IPD capital growth index rises for seventh month in a row in November. Offices saw the highest capital growth in 2013, up 5.08% on a 12 month basis.** performance for quite some time, and it is no longer the case that central London is supporting the figures. In recent months outer London and South East offices have delivered solid IPD figures. Consequently, we set out below our tips for office investment in 2014. 1. he bigger cities will offer the best T returns. Britain’s cities grew up to a Victorian economic pattern whereby the big conurbations were ringed by smaller, a renaissance lately, thanks to changing feeder cities, which provided resources or work patterns. In the UK the density of sub-production to the mother city. The office space per worker has dropped as big centres have successfully re-invented low as is realistic, while the new wave of themselves as creative, technology and tech firms driving the economy value offices Retail finished the year with a fall in capital values, down 0.53%. This is because the office sector has enjoyed service industry hubs. The feeder cities For the latest news, views and analysis on the world of commercial property, visit Commercial Briefing or @KF_CommBrief and see them as places that allow staff to * Based on Property Data figures ** Based on the IPD monthly capital growth index quarters of UK GDP, we believe offices mix and generate new ideas. With services accounting for around three relied too much in recent decades on call centres and the public sector, so an embattled consumer and government cuts have bitten hard. In London the should be a key target for property investors upswing is at an established stage, but in the new cycle. While retail is also part of there is still the opportunity to catch services GDP, our expectation is that the more of the cycle in Birmingham, Leeds, economy will rely less on the consumer Manchester, and the South East. FIGURE 1 IPD capital growth index Month-on-month change 1.0% 0.8% FIGURE 2 UK investment volume £60bn £50bn 0.6% 0.4% JAMES ROBERTS Head of Commercial Research “ ffices have put in a solid O performance for quite some time, and it is no longer the case that central London is supporting the figures.” Follow James at @KF_JamesRoberts £40bn 0.2% 0.0% -0.2% £30bn £20bn -0.4% -0.6% £10bn -0.8% ND J F M AM J J A S O ND J F M AM J J A S O N 2011 2012 2013 Source: IPD £0bn 2007 2008 2009 2010 2011 2012 2013 Source: Property Data
- 2. RESEARCH UK MARKET OUTLOOK JANUARY 2014 2. 014 will be the year for edge of CBD 2 researchers in Knight Frank’s international locations. In London and New York the “cutting space per worker down to 175 strongest lately have not been the sq ft”. In the UK densities are so low traditional CBD cores, but gentrifying “n the UK I densities are so low that the arrival of new working areas like break-out space, and even exercise areas, means that space per worker could start to rise.” network we often hear comments about office sub-markets that have performed (typically 100-125 sq ft per worker) that fringe areas. This reflects the growing the arrival of new working areas like importance of new technology and break-out space, brain storming rooms, creative industry companies in the office and even exercise areas, means that market, who often prefer a mixed-use and a trendy environment. Also, up to now the enterprise zones have made little impact, but a rising economic tide will bring them into focus, and we expect the more successful ones to be those in edge of CBD locations in the regional cities. 3. ook out for communal offices. Another L trend emerging in the Big Apple which we may see appear on this side of the Atlantic is the rise of communal offices. WeWork, a US firm that operates in this area, has been expanding steadily in New York in recent years. These offices sit somewhere between a serviced office and a tech incubator, where entrepreneurs rent desk space and work surrounded by people running other businesses. This could offer new life to older buildings in fringe locations. 4. verage space per office worker A will start to rise. When speaking to for the first time in decades space per worker could start to rise. The size of the individual’s work station is unlikely to increase, but increasingly the office is less about the desk and more about creating new spaces for colleagues to interact. This is where we will see growth coming through. 5. xpect grade B supply to come under E pressure in city centres. While demand is traditionally strongest for grade A early in the cycle, we see start-up businesses playing a bigger role in this cycle. Inevitably the cheapest options appeal to start-ups, and the rise of wifi and cloud computing make grade B more practical than was the case in previous cycles. Also, with the housing market improving and planning controls relaxed, we expect developers to target town house type office buildings on the margins of CBDs for conversion to residential. RECENT MARKET-LEADING RESEARCH PUBLICATIONS COMMERCIAL RESEARCH James Roberts Head of Commercial Research +44 20 7861 1239 james.roberts@knightfrank.com Global Investment Report 2013-2014 UK Shopping Centre Investment Q4 2013 European Market Indicators Winter 2013 Investment Guide: Germany 2013 Knight Frank Research Reports are available at KnightFrank.com/Research © Knight Frank LLP 2014 - This report is published for general information only and not to be relied upon in any way. Although high standards have been used in the preparation of the information, analysis, views and projections presented in this report, no responsibility or liability whatsoever can be accepted by Knight Frank LLP for any loss or damage resultant from any use of, reliance on or reference to the contents of this document. As a general report, this material does not necessarily represent the view of Knight Frank LLP in relation to particular properties or projects. Reproduction of this report in whole or in part is not allowed without prior written approval of Knight Frank LLP to the form and content within which it appears. Knight Frank LLP is a limited liability partnership registered in England with registered number OC305934. Our registered office is 55 Baker Street, London, W1U 8AN, where you may look at a list of members’ names.