LRAP at NACCAP 2018 | A Facilitated Discussion on Fear of Student Loan Debt & Enrollment Impact
•
1 recomendación•241 vistas

What strategies are being implemented at your college or university to address the growing impact that fear of student debt is having on enrollment trends? Chime in using the comments below or tag us on Twitter (@LRAPassociation). We've taken the time to scour the web for relevant data and statistics regarding the potential for impact fear of managing student debt after graduation might be having on the higher education choices students and families are making. As a focal point for the facilitated discussion we are leading at NACCAP, we created this convenient take-home document with primary sources listed (and linked at http://lrap.org/NACCAP).

Recomendados
Recomendados
Más contenido relacionado
La actualidad más candente
La actualidad más candente (18)
Similar a LRAP at NACCAP 2018 | A Facilitated Discussion on Fear of Student Loan Debt & Enrollment Impact
Similar a LRAP at NACCAP 2018 | A Facilitated Discussion on Fear of Student Loan Debt & Enrollment Impact (20)
Último
Último (20)
LRAP at NACCAP 2018 | A Facilitated Discussion on Fear of Student Loan Debt & Enrollment Impact
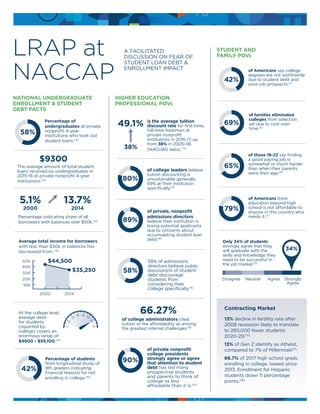
- 1. %LOANS %LOANS HIGHER EDUCATION PROFESSIONAL POVs STUDENT AND FAMILY POVs NATIONAL UNDERGRADUATE ENROLLMENT & STUDENT DEBT FACTS The average amount of total student loans received by undergraduates in 2015-16 at private nonprofit 4-year institutions.(12) 42% $9300 58% Percentage of undergraduates at private nonprofit 4-year institutions who took out student loans.(12) 5.1% 13.7% 2000 2014 Percentage indicating share of all borrowers with balances over $50k.(14) Average total income for borrowers with less than $50k in balances has decreased from: (14) $44,500 $35,250 2000 2014 10K 20K 30K 40K 50K At the college level, average debt for students (reported by college) covers an enormous range of $4600 - $59,100.(13) Percentage of students from longitudinal study of 9th graders indicating financial reasons for not enrolling in college.(16) 30 40 50 60 70 20 10 0 80% 58% of college leaders believe tuition discounting is unsustainable generally, 59% at their institution specifically.(11) 89% of private, nonprofit admissions directors believe their institution is losing potential applicants due to concerns about accumulating student loan debt.(8) 90% of private nonprofit college presidents strongly agree or agree that attention to student debt has led many prospective students and parents to think of college as less affordable than it is.(10) 58% of admissions directors believe public discussions of student debt discourage students from considering their college specifically.(8) 66.27% of college administrators cited tuition or fee affordability as among the greatest internal challenges.(9) 49.1% 38% is the average tuition discount rate for first-time, full-time freshmen at private nonprofit institutions in 2016-17, up from 38% in 2005-06 (NACUBO data). (11) 42% 69% of Americans say college degrees are not worthwhile due to student debt and poor job prospects.(1) 65% of Americans think education beyond high school is not affordable to anyone in this country who needs it.(7) 79% Only 34% of students strongly agree that they will graduate with the skills and knowledge they need to be successful in the job market.(5) of families eliminated colleges from selection set due to cost over time.(2) of those 18-22 say finding a good paying job is somewhat or much harder than when their parents were their age.(6) Disagree Neutral Agree Strongly Agree 34% LRAP at NACCAP A FACILITATED DISCUSSION ON FEAR OF STUDENT LOAN DEBT & ENROLLMENT IMPACT Contracting Market 13% decline in fertility rate after 2008 recession likely to translate to 280,000 fewer students 2020-29.(15) 13% of Gen Z identify as Atheist, compared to 7% of Millennials(17) 66.7% of 2017 high school grads enrolling in college, lowest since 2013. Enrollment for Hispanic students down 11 percentage points.(18)
- 2. %LOANS %LOANS LRAP at NACCAP A FACILITATED DISCUSSION ON FEAR OF STUDENT LOAN DEBT & ENROLLMENT IMPACT • 72% Percentage of 9th graders in longitudinal study who had enrolled in postsecondary education between completing or leaving high school and February 2016. 36% enrolled at a public 2-year college, 41% at a public 4-year college, only 16% at a private nonprofit 4-year college.(16) • 54.4% Percentage of undergraduates at private nonprofit 4-year institutions who took out federal Direct Loans, $6900 average amount borrowed. (12) • 47.4% Percentage of undergraduates at private nonprofit 4-year institutions who took out Direct Subsidized Loans, $4000 average amount borrowed.(12) • 47.8% Percentage of undergraduates at private nonprofit 4-year institutions who took out Direct Unsubsidized Loans, $3900 average amount borrowed.(12) • 57.2% Percentage of undergraduates at private nonprofit 4-year institutions who received aid funded by the postsecondary institution they attended, $16,200 average amount funded.(12) • 64% of admissions directors believe public discussions of student debt discourage students from considering higher education.(8) • 85% of private nonprofit college presidents are very or somewhat concerned about enrolling target numbers of undergraduates.(10) • 85% say they were very (55%) or moderately (30%) concerned about reaching their institution’s enrollment goals this year.(8) • 69.48% of college administrators cited competition for prospective students as among the greatest external challenges.(9) • 54.62% of college administrators cited public uncertainty about the value of higher education as among the greatest external challenges.(9) • 99% of private nonprofit college presidents think concerns about college affordability and student debt are somewhat or very responsible for declining public support of higher education.(10) • 80% of college leaders believe tuition discounting is unsustainable generally, 59% at their institution specifically.(11) • 58% of families who eliminated a college from a selection set due to cost, did so before research.(2) • 39% of Americans who are dissatisfied with four-year programs cited the cost as a leading concern.(1) • 20% of families who eliminated a college from selection set due to cost, did so before applying, 12% before aid award, and 10% after aid award.(2) • 22% of education consumers say access or affordability motivated them toward their specific institution.(3) • 44% of students in one poll rejected a school based on published sticker price.(4) • 36% of students strongly agree that they will graduate with the skills and knowledge they need to be successful in the workplace after finding employment.(5) • 53% of students strongly agree that their major will lead to a good job.(5) HIGHER EDUCATION PROFESSIONAL POVs STUDENT AND FAMILY POVs NATIONAL UNDERGRADUATE ENROLLMENT & STUDENT DEBT FACTS Sources 1. 2017 Civis Analytics Poll 2. 2017 How America Pays for College: Sallie Mae’s 10th National Study of College Students & Parents 3. Strada/Gallup 2018 Survey on Top Reasons US Consumers Choose Educational Pathways 4. Education Value Proposition Study by Longmire and Company in 2013 5. Strada/Gallup 2018 Student Survey Report 6. New America’s Annual Survey on Higher Education 2017 7. Gallup/Lumina 2014 study 8. 2017 IHE Survey of Admissions Directors 9. 2017 STAMATS National Poll of College Administrators For links to primary sources and more information visit LRAP.ORG/NACCAP 10. 2018 IHE Survey of College Presidents 11. 2017 Chronicle of Higher Education Tuition Pricing Crisis 12. NPSAS:16 (National Postsecondary Student Aid Study 2015-16) 13. TICAS – Student Debt and the Class of 2016 14. Brookings Study on Borrowers with Large Balances 2018 15. Demographics and the Demand for Higher Education, Nathan D. Grawe, 2017 16. NCES Results of Long Term Longitudinal Study on 9th graders 17. Barna Group 2018 research on Gen. Z & Millennials 18. US Labor Department Statistics Notes ________________________________ ________________________________ ________________________________ ________________________________ ________________________________ ________________________________ ________________________________ ________________________________ ________________________________ ________________________________