![What do your excel results tell you?
The graphs on the last pages represent the time per order and time per board based on the
standard process flow information in exhibit 2. The order sizes used are 1, 10, 100, 500, and 1000.
In graph 1 there is positive correlation between order size and the time it takes to complete the
order. As the order size increases more time is needed to complete the order.
In graph 2 there correlation between time spent per board and order size is negative. The larger
the order, the less time spent per board is due to avoiding extra setup time along with using the CNC Drill
and CNC Router for the fastest production time.
Donner Company currently promises delivery in three weeks for order less than 1000 boards and
five weeks for larger orders. Graph 1 shows an order of 1000 boards taking approximately 6000 minutes,
(or 100 hours) to complete production. Donner does not consider the time spent per board when
estimating delivery dates and taking large orders. Graph 2 shows for orders larger than 100 the time spent
per board is greatly reduced. Orders greater than 500 boards take less than 7 minutes per board while
orders of 10 boards can take over 380 minutes due to setup time. While Donner Company considers the
number of board per order when estimating the delivery date they also need to consider what other orders
the currently have, the size of their other current orders, and what machinery is being used for the current
productions. Donner Company needs to improve its order scheduling and sync it with the production
process. They need to focus on eliminating idle time and having orders on schedule, ready to be shipped
by the customer delivery date.
Utilization of Operations
To asses a process’s utilization, one must first figure out the amount of time the facility is
available for operations. Second, the amount of time the process is used must be present. In the Donner
Case study we are given data for the total process of manufactured printed circuit boards in September of
1987. In that month there were a total of 30 days, but only 22 were part of the typical work week. Of
those 22 days one was a federal holiday, the 7th was “Labor Day”, leaving 21 days of operations for the
facility.
As per the case study, it is mentioned that there are 22 production employees. With these 22
employees operating in 3 departments with a total of 13 subset process’ it can be assumed that this
company is only operating on a 1 shift schedule, approximately 8 hours a day. The case study explicitly
states that many of employees are “crossed-trained” in multiple departments, so we can also assume that
there are supplement employees to cover during break times. This leads us to conclude that they are fully
functioning the whole 8 hours of each available work day. As previously stated, there were 21 work days
in September of 1987 and with 8 hours of a functioning facility we can calculate that there were 168
hours of availability (21days x 8hr/day).
The usage time of each processes is stated in Exhibit 2 Standard Process Flow of the case study.
To find the utilization of the artwork generation we would simply take the total hours of usage (24.2hrs)
and divide it by the total hours available for the facility (168), [24.2/168=.14404 or about 14.4%]. Now
finding the utilization of the CNC Drill might prove to be a little harder. Since the setup time is “almost
entirely made up of required computer control” we can’t actually uses the total hours figure given to us,
instead we must take the Run Time (9,650mins) and translate it into hours. This gives us a look at the
actual time excluding the initial computer setup [9,650/60 = 160.83 hours]. To find its utilization one
must take the time of use (160.83hrs) and divide it by the total available hours for the month (168hrs). We
can conclude that the CNC Drill operates at a utilization rate of 95.7% [160.83/168]. Similarly, to find the](data:image/gif;base64,R0lGODlhAQABAIAAAAAAAP///yH5BAEAAAAALAAAAAABAAEAAAIBRAA7)
Recomendados
Más contenido relacionado
La actualidad más candente
La actualidad más candente (20)
Destacado
Destacado (9)
Similar a Order Process Flow Optimization
Similar a Order Process Flow Optimization (20)
Order Process Flow Optimization
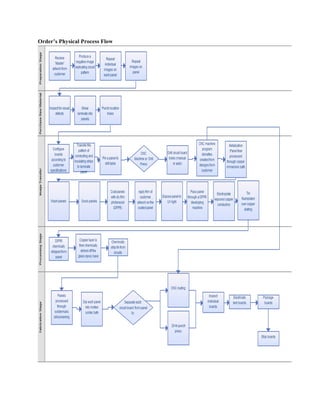
- 1. Order’s Physical Process Flow
- 2. What do your excel results tell you? The graphs on the last pages represent the time per order and time per board based on the standard process flow information in exhibit 2. The order sizes used are 1, 10, 100, 500, and 1000. In graph 1 there is positive correlation between order size and the time it takes to complete the order. As the order size increases more time is needed to complete the order. In graph 2 there correlation between time spent per board and order size is negative. The larger the order, the less time spent per board is due to avoiding extra setup time along with using the CNC Drill and CNC Router for the fastest production time. Donner Company currently promises delivery in three weeks for order less than 1000 boards and five weeks for larger orders. Graph 1 shows an order of 1000 boards taking approximately 6000 minutes, (or 100 hours) to complete production. Donner does not consider the time spent per board when estimating delivery dates and taking large orders. Graph 2 shows for orders larger than 100 the time spent per board is greatly reduced. Orders greater than 500 boards take less than 7 minutes per board while orders of 10 boards can take over 380 minutes due to setup time. While Donner Company considers the number of board per order when estimating the delivery date they also need to consider what other orders the currently have, the size of their other current orders, and what machinery is being used for the current productions. Donner Company needs to improve its order scheduling and sync it with the production process. They need to focus on eliminating idle time and having orders on schedule, ready to be shipped by the customer delivery date. Utilization of Operations To asses a process’s utilization, one must first figure out the amount of time the facility is available for operations. Second, the amount of time the process is used must be present. In the Donner Case study we are given data for the total process of manufactured printed circuit boards in September of 1987. In that month there were a total of 30 days, but only 22 were part of the typical work week. Of those 22 days one was a federal holiday, the 7th was “Labor Day”, leaving 21 days of operations for the facility. As per the case study, it is mentioned that there are 22 production employees. With these 22 employees operating in 3 departments with a total of 13 subset process’ it can be assumed that this company is only operating on a 1 shift schedule, approximately 8 hours a day. The case study explicitly states that many of employees are “crossed-trained” in multiple departments, so we can also assume that there are supplement employees to cover during break times. This leads us to conclude that they are fully functioning the whole 8 hours of each available work day. As previously stated, there were 21 work days in September of 1987 and with 8 hours of a functioning facility we can calculate that there were 168 hours of availability (21days x 8hr/day). The usage time of each processes is stated in Exhibit 2 Standard Process Flow of the case study. To find the utilization of the artwork generation we would simply take the total hours of usage (24.2hrs) and divide it by the total hours available for the facility (168), [24.2/168=.14404 or about 14.4%]. Now finding the utilization of the CNC Drill might prove to be a little harder. Since the setup time is “almost entirely made up of required computer control” we can’t actually uses the total hours figure given to us, instead we must take the Run Time (9,650mins) and translate it into hours. This gives us a look at the actual time excluding the initial computer setup [9,650/60 = 160.83 hours]. To find its utilization one must take the time of use (160.83hrs) and divide it by the total available hours for the month (168hrs). We can conclude that the CNC Drill operates at a utilization rate of 95.7% [160.83/168]. Similarly, to find the
- 3. utilization of the CNC Router we ignore the initial computer setup time (for the same reason) and translate the actual setup time into hours [2,166mins/60 = 36.1hrs]. With the new accurate number of usage hours (36.1hrs) we can find the utilization rate by dividing that by the total hours of operations in September of 1987 (168) to find the rate of 21.5% [36.1/168]. For an ideal performance a company should be using whichever process is best suited for each specific type of order. In this process there are 2 steps that allow us to choose a process to fit an order’s needs, they are CNC Drill versus the Manual process and CNC Router versus the Punch Press. To be most effective Donner should be picking the best option from each group, respectively. So we must figure out at what order sizes the company should choose to use the newer CNC technology. To compare we need to set up an equation using fixed and variable times. For the Manual drill, there is a setup of 15min and a run time per hole of .080 (.08 x 500 holes/per board = 40mins/per board). For the CNC Drill there is a set up time of 240min and run time of .004 per hole (.004 x 500 holes/per board = 2mins/per board). Next we set the two equations together leaving the variable of order size(x) [240 + 2*x = 15 + 40*x] → [225 = 38*x] → [225/38 = x] → 5.921 = x. This tells us that if the order size is about 5.921 or ≈ 6 Donner should use the CNC Drill. But, they are only using it on orders with sizes over 140 boards totaling 4,825 boards. This leaves a range of order sizes 6-136 totaling 26 orders and 871 boards that would be better suited using the CNC Drill process. Unfortunately, as previously discussed the CNC drill is operating at a 95.7% utilization rate, since it is already the bottleneck of the process, anymore activity would not be advantageous to the company. So due to the bottleneck effect we can’t possibly functioning at the most efficient rate. Next we can compare the CNC Router to the Punch Press method in a similar fashion. For the CNC Router there is a set up time of 150mins and Run Time of .5min per board. The Punch Press operates with a setup time of 50mins and a Run Time of 1min per board. We must compare these two equations using the variable of order size (x) [150 +.5*x = 50 +1*x] → [100 = .5*x] → [100/.5 = x] → 200=x. This would imply that we should be using the CNC Router on orders larger than 200 to function at the highest efficiency. Currently Donner is using the CNC Router process on 6 orders, the smallest at 229 boards, totaling 4,331 boards. It would not be advantageous for Donner to produces the next smallest order size (200) using the CNC Router, since 200 isn’t greater than the point of indifference of 200 (as solved previously). What is your explanation for each of the problems mentioned by Plummer? Operating Problems Management had a hard time finding where the main bottleneck was specifically in their system because there would be a different problem every day in a different operation. All these different setbacks were happening at random places in the system because each circuit board order was different. Each customer had special requirements that were different from other orders. Because he had no way of predicting where the next bottleneck would happen, Flaherty, the shop supervisor, moved his workers accordingly to the top priority of work. For example, if three works had finished their manual drilling, he would move them to another task until there were more boards to be drilled. So essentially if all three workers were busy working on a different task, boards that were waiting to be drilled had to wait. Productivity Problems
- 4. Plummer, the president of the company, had noticed that some machines were idle more than he expected them to be. This shows that there is a bottleneck somewhere in production that causes machines to be idle. Also the Donner Company wasn’t even using their own goals, or time standards for their operations. This is not a good sign because they need to be using their own numbers and times to create the company’s own goals. Under the plating operation, the president noticed that a platter would be inspecting panels and then would have to walk 18’ to place the panels in the tanks. Altmeyer, the design engineer, concluded that the walk from her desk to the tanks took up 15% of her time. Plummer stressed his concern that he thought job improvements would not be beneficial for the company. He thought it would just create more pileups at other stations. This is not a positive way of thinking when wanting to grow and develop a company. Quality Problems Inspecting the circuit boards is difficult because there is not a specific standard of what a board should look like because each customer’s order is different. Treating the boards in a careful manner is one problem, but not meeting the correct qualifications that the customer asked for is a bigger problem because on the order sheet (which top management writes up along with a blueprint), it lists everything that is needed for the order to be complete. About 90% the company’s returns are because the customer’s requirements were not met. 10% of the returns are from damaged boards. Delivery Problems In august of 1987, shipments had average nine days late. Lloyd Searby, the sales manager, had calculated that if The Donner Company had changed its small order deliveries from 3 weeks to 4 weeks, the company would barely make $2 million, instead of $3 million if they keep the deliveries at 3 weeks. Plummer had a goal of clearing all work possible out of the shop by the end of every month. This created a pattern in which the beginning of the month had fewer orders to fulfill than that of the end of the month, because the goal made people try to rush and get the shop cleared out. What specific actions should Mr. Plummer take to solve these problems? Mr. Plummer should focus on what his company does best. This is serving his customers with exactly what they want, ranging from order size to special requirements for their orders. Mr. Plummer needs to realize that if there are multiple orders in the system, small orders and big orders, the big orders are the ones that will take up most of the time, pushing the time back for the small orders. If the size of orders is substantially different, then there needs to be two separate productions lines so the lines keep moving. This way each order will essentially take up the same time even if they do have different qualifications because they will be the same size. By having two productions lines, one for small orders and one for big orders, machines will rarely be idle and workers will remain busy, because there will be no stop and start periods. By keeping the main variable constant, order size, it will be easy for management to spot a bottleneck. Now that there are two productions lines, running at their own speeds, Plummer needs to find time goals that are fit yet still demanding for the process. He needs to base these goals from his own lines of production, not from competing firms, because most likely they have a completely different way of doing things than the Donner Company. This new way of creating the circuit boards can increase delivery time depending on the order size. Also, now the company can begin to look for job improvements and workers can master their own skill with this new layout.
- 5. 0 1000 2000 3000 4000 5000 6000 7000 0 100 200 300 400 500 600 700 800 900 1000 Time Per Order (Minutes) Order Size Donner Company-‐ Graph 1 0 50 100 150 200 250 300 350 400 0 100 200 300 400 500 600 700 800 900 1000 Time Per Board (minutes) Order Size Donner Company-‐ Graph 2