SeedEZ 3D cell culture application notes - microplate reads

SeedEZ 3D cell culture application notes - microplate reads. The users of 3D cell cultures often wonder how to read and how to interpret readout results obtained with microplate readers. Understanding a microplate optical system may be complex. Lena Biosciences provides simple explanations that any cell culture user interested in using a plate reader, whether with 2D or 3D cell cultures, understands. Rest assured, reading from a three-dimensional (3D) cell culture is not too different than reading it from a cell monolayer. 3D cell cultures are compliant with most plate readouts and detection methods when cell lysates, extracted proteins, metabolic products or other solutions are transferred into another plate and read. We refer to these reads as the post-transfer reads, as they are obtained following the transfer of cell lysates, excreted molecules etc., into a new multi-well plate in which the cells are not present. For the most consistent results, you may want to shake the microplate with a 3D cell culture prior to solution transfer. Provided that a reasonable intra-3D-cell-culture mass transport takes place, most post-transfer reads allow for direct comparison between 2D and 3D cell culture models. Today, frequently used cytotoxicity, viability, proliferation and chemo-sensitivity assays with 3D cell cultures are Alamar Blue, CellTiter-Glo, Neutral Red and Sulforhodamine B (SRB) assay. An advantage of Alamar Blue assay is that it is not terminal. If you are interested in assessing delayed cell death for the period of days following toxic compound withdrawal, non-cytotoxic and non-terminal cell metabolic activity assays may be appropriate. For the in situ reads, with 3D cell culture present in the plate wells, an absorbance read may be less appropriate than a fluorescence read or a luminescence read. Next, the plate reader illumination and detection optics arrangement may favor one cell culture model vs. the other. For example, the top epifluorescence reads often provide better signal-to-noise ratio for solution-based assays. The bottom reads may provide better results when working with an adherent layer of cells. This complicates direct comparison between in situ reads with cells in 2D and 3D cell cultures. Please refer to this application note to learn more. It provides step-by-step instructions, comparisons and results for different optical arrangements and teaches what should be taken into consideration when comparing 2D and 3D in situ cell culture reads. As always, setup suitable controls; avoid using outer wells in 96-well plates and higher - fill them with water or media to prevent evaporative losses; and always compare results obtained only with the identical microplates and the identical readout conditions.

Recomendados
Recomendados
Más contenido relacionado
Último
Último (20)
Destacado
Destacado (20)
SeedEZ 3D cell culture application notes - microplate reads
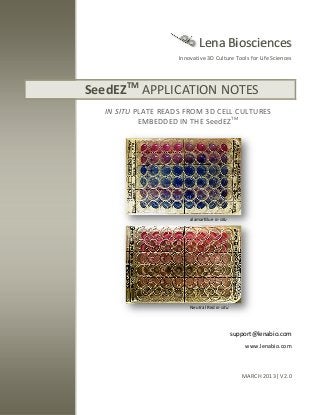
- 1. Lena Biosciences Innovative 3D Culture Tools for Life Sciences SeedEZ TM APPLICATION NOTES IN SITU PLATE READS FROM 3D CELL CULTURES EMBEDDED IN THE SeedEZ TM alamarBlue in situ Neutral Red in situ support@lenabio.com www.lenabio.com MARCH 2013| V2.0
- 2. SeedEZ IS A TRADEMARK OF LENA BIOSCIENCES, INC. FOR IN VITRO RESEARCH USE ONLY. NOT FOR USE IN DIAGNOSTIC OR THERAPEUTIC PROCEDURES. NOT FOR USE IN ANIMALS OR HUMANS. SeedEZ IS PROTECTED BY ONE OR MORE ISSUED PATENTS AND PATENT PENDING APPLICATIONS. PURCHASE DOES NOT INCLUDE OR IMPLY ANY RIGHT TO RESELL THIS PRODUCT EITHER AS A STAND-ALONE PRODUCT OR AS A COMPONENT OF ANY OTHER PRODUCT, EITHER IN PART OR AS A WHOLE. A LICENSE IS REQUIRED TO USE THIS PRODUCT IN COMMERCIAL FOR FEE SERVICES. INFORMATION AND DATA CONTAINED IN THIS DOCUMENT ARE FOR GUIDANCE ONLY AND SHOULD NOT BE CONSTRUED AS A WARRANTY. ALL IMPLIED WARRANTIES ARE EXPRESSLY DISCLAIMED. ALL BUYERS OF THE PRODUCT ARE RESPONSIBLE FOR ENSURING THAT IT IS SUITABLE FOR THEIR END USE. THIS PUBLICATION IS A PUBLICATION OF LENA BIOSCIENCES, INC. THE INFORMATION AND DATA CONTAINED IN THIS DOCUMENT ARE SUBJECT TO CHANGE WITHOUT PRIOR NOTICE. WHILE EVERY PRECAUTION HAS BEEN TAKEN IN PREPARING THIS DOCUMENT, LENA BIOSCIENCES ASSUMES NO RESPONSIBILITY FOR ERRORS, OMISSIONS OR DAMAGES RESULTING FROM THE USE OF DATA AND INFORMATION CONTAINED IN THIS DOCUMENT. NO PART OF THIS PUBLICATION MAY BE REPRODUCED, TRANSMITTED, OR USED IN ANY OTHER MATERIAL IN ANY FORM OR BY ANY MEANS WITHOUT PRIOR WRITTEN PERMISSION FROM LENA BIOSCIENCES. ©2013 LENA BIOSCIENCES, INC. ALL RIGHTS RESERVED.
- 3. In situ Plate Reads from 3D Cultures Embedded in the SeedEZTM March 2013 TABLE OF CONTENTS INTRODUCTION _____________________________________________________________________ 2 USER GUIDELINES AND RECOMMENDATIONS _____________________________________________ 2 Post-transfer reads _________________________________________________________________________ 4 In situ reads _______________________________________________________________________________ 4 Common absorbance probes validated as fluorescent probes for in situ detection _____________________________ Neutral Red Uptake (NRU) or Neural Red Release (NRR) assay ___________________________________________ alamarBlue assay _____________________________________________________________________________ Why are the in situ reads necessary? _________________________________________________________________ 4 4 5 6 HOW TO COMPARE THE IN SITU READS between a 2D CELL layer AND a 3D CELL CULTURE? ________ 6 EXAMPLE: alamarBlue®fluorescence reads in different 2D and 3D culture conditions ____________________ 7 alamarBlue assay principle and applications ___________________________________________________________ 7 Materials _______________________________________________________________________________________ 7 Equipment ______________________________________________________________________________________ 7 Methods _______________________________________________________________________________________ 7 Reduction of alamarBlue_________________________________________________________________________ 8 48-well plate layout for the testing of different 2D and 3D culture conditions ______________________________ 8 Fluorescence readout parameters for BioTek Synergy H4 microplate reader _______________________________ 9 Expected outcomes of the experiment design _________________________________________________________ 10 Medium controls ______________________________________________________________________________ 10 Top and bottom epifluorescence reads ____________________________________________________________ 10 Dual wavelength measurements _________________________________________________________________ 10 Acellular results _________________________________________________________________________________ 11 Medium controls ______________________________________________________________________________ 11 Differences between the top and bottom reads _____________________________________________________ 14 The variation in reads with wavelength ____________________________________________________________ 17 Emission spectrum for various culturing conditions at 545 nm excitation _________________________________ 19 Statistical significance of acellular results __________________________________________________________ 21 2D and 3D cell cuture results with brain cells _________________________________________________________ 22 Calcein AM assay vs alamarBlue assay with 10 day cultured astrocytes ___________________________________ 22
- 4. Lena Biosciences Innovative 3D Culture Tools for Life Sciences SeedEZTM Application Notes www.lenabio.com alamarBlue assay with 10 day cultured primary cortical neurons and 1X passaged glia ______________________ 27 SeedEZTM In situ Plate Reads| 1
- 5. Lena Biosciences Innovative 3D Culture Tools for Life Sciences SeedEZTM Application Notes www.lenabio.com INTRODUCTION Plate reads are commonly used to assess cell count, viability, proliferation, apoptosis, metabolic activity, P450 enzyme activity, intracellular Ca2+ concentration, protein and nucleic acid quantification etc. The readouts typically provide for an average cell result from the whole cell population, unless plated cell sub-populations were labeled selectively or transfected to investigate specific outcomes. Common detection methods for microplate assays are absorbance, fluorescence intensity, luminescence, time-resolved fluorescence, and fluorescence polarization. This Application Note provides general guidelines and recommendations for in situ detection of cell activity and function in live cells embedded and cultured in the SeedEZ substrates using plate reads. USER GUIDELINES AND RECOMMENDATIONS The following guidelines may assist in optimizing or troubleshooting your current protocols: A. Choose the right readout method. When sensitivity is required, fluorescence measurements are preferred. Sensitivity may be an order of magnitude higher than that of the absorbance measurements. FOR IN SITU READS FROM CELLS, LABELED EXTRACELLULAR PRODUCTS OR OTHER MOLECULES EMEBEDDED IN THE SeedEZ, FLUORESCENCE READS ARE RECOMMENDED. B. When necessary, gather well reads as “area scan” rather than a single point focused read per well. Fluorescence and absorbance reads are typically “focused” reads, with one point per well. Some instruments allow for multi-point spatially distributed measurements per well. While the latter readout takes longer, it may provide for a more accurate result. C. Setup appropriate background controls. Molecules used in coatings, hydrogels, or those present in extracellular matrix constituents; components of media and buffers, test compounds, and even intracellular constituents may produce a detectable intrinsic absorbance or intrinsic fluorescence which level differs with the wavelength used. This may interfere with the absorbance and fluorescence measurements and suitable background controls are necessary. D. Understand how your microplate reader works. Depending on optics arrangement, microplate readers may illuminate from the bottom or the top and read from the bottom, top or both. More complex instruments may illuminate from the bottom and the top. Fluorescence reads are epifluorescence reads. The absorbance reads are based on diascopic (transmitted) light detection which is then related to absorbance using Beer-Lambert law. Luminescence may be captured at the top or bottom, depending on instrument design. Top reading sophisticated instruments allow adjustment of the focal height to provide for the best signal-to-noise, signal-to-background, and minimal cross-talk results for both solution-based assays and cell-based assays and for detection of fluorescence intensity, fluorescence polarization, time-resolved fluorescence, and luminescence. SeedEZTM In situ Plate Reads| 2
- 6. Lena Biosciences Innovative 3D Culture Tools for Life Sciences SeedEZTM Application Notes www.lenabio.com For epifluorescence reads, the top reads usually provide better signal-to-noise ratio for solution-based assays. The bottom reads may provide better results when working with an adherent layer of cells. E. For the best results, ensure that you are using the full dynamic range of the instrument and adjust sensitivity. F. Choose the right plate. When needed, use opaque-walled plates. Use black-walled plates for fluorescence reads to reduce the background noise and cross-talk, and white-walled plates for luminescence. However, for bottom illumination and detection ensure that the well bottom is clear. Readings below 350 nm require specialty plates with UV transparent bottom, while high-content confocal imagers may require thin-glass-bottom plates for the best results. G. Evaporative losses may be significant during culturing and screening, especially for small wells (96-wells or higher), where surface to volume ratio is high. For the best assay results do not use outer wells due to edge effects contributing to higher evaporative losses; rather, fill them with sterile DI water to prevent evaporative losses of the inner wells used for assaying. H. Do not use media and buffers containing Phenol Red. If media or buffers contain Phenol red, use controls at appropriate pH and subtract it from your measurement. I. Lids or well caps influence reads. For a given reader, given microplate, and a given assay, do not compare the reads between microplates which had the lids on and the lids off regardless of detection method used. Compare only the lid-on reads with the lid-on reads, and the lid-off reads with the lid-off reads. J. An assay may require that the lid be present, e.g. to maintain sterility, and condensation appears influencing the measurement. It might be possible to compensate for condensation if a two-wavelength measurement is used. For example, by subtracting the absorbance at a reference wavelength from that at the reading wavelength, where the reference wavelength is the wavelength at which the absorbance of the molecule of interest is negligible or low. K. For a given reader, given microplate, and a given assay, do not compare the top and bottom reads regardless of detection method used. Compare only the bottom reads with the bottom reads, and the top reads with the top reads. The signal-to-noise, signal-to-background and well-to-well cross-talk depend on optics arrangement. Even for the top and bottom epifluorescence measurements, detected fluorescence intensity may be different due to different focusing points in the sample, different order of well-bottom-sample or sample-well-bottom on the optical path of both the excitation and the emitted wavelengths, and different sample distances from detector, among other factors inherent to differences in the instrument top- and bottom optics arrangement. L. Do not compare assay results obtained with different multi-well formats. Always compare 96-well plate result with a 96-well plate result, or a 48-well plate result with a 48-well plate result, using the exact same plate. SeedEZTM In situ Plate Reads| 3
- 7. Lena Biosciences Innovative 3D Culture Tools for Life Sciences SeedEZTM Application Notes www.lenabio.com POST-TRANSFER READS The SeedEZ is compatible with most plate detection methods when cell lysates, extracted proteins, metabolic products or other solutions are transferred into another plate and read. We refer to these reads as the post-transfer reads, as they are obtained following the transfer of lysates, excreted molecules etc., into a new multi-well plate in which the cells and the SeedEZ are not present. For post-transfer microplate readouts, please continue to use a detection method you commonly use, whether absorbance, fluorescence or any other method used. IN SITU READS FOR IN SITU DETECTION, IN THE PRESENCE OF CELLS (OR CELLS AND THE HYDROGEL) EMBEDDED IN UNCOATED OR COATED SeedEZ SUBSTRATES, FLUORESCENCE READS ARE RECOMMENDED. In addition to fluorescent probes, many dyes and molecules used for the absorbance assays also generate fluorescence signal which makes them suitable for the in situ fluorescence reads. The absorbance reads have lower sensitivity and are typically based on an average absorption coefficient. The absorbance by the SeedEZ substrate, extracellular matrix gel (if present), coating (if present) and cells may be too high to distinguish the absorbance by the molecule in question beyond the absorbance in suitable controls. COMMON ABSORBANCE PROBES VALIDATED AS FLUORESCENT PROBES FOR IN SITU DETECTION The following dyes commonly used in the absorbance assays have been validated with the in situ fluorescence assays and signal detection in the presence of cells and Matrigel embedded in the SeedEZ using BioTek Synergy H4 microplate reader: NEUTRAL RED UPTAKE (NRU) OR NEURAL RED RELEASE (NRR) ASSAY The fluorescence reads were done in situ from an initially 3D cell culture of brain cells embedded in 8 mg/ml GFR Matrigel in the SeedEZ following NR extraction from cells under the following conditions: A. Plate temperature: 37oC B. Plate type: Costar 48 well C. Fluorescence endpoint Read: D. Excitation: 530 ± 10 nm Emission: 645 ± 10 nm E. Optics: Bottom F. Gain: AutoScale G. Light Source: Xenon Flash SeedEZTM In situ Plate Reads| 4
- 8. Lena Biosciences Innovative 3D Culture Tools for Life Sciences H. Measurements/Data Point: 10 I. SeedEZTM Application Notes www.lenabio.com None Pathlength correction: Using these parameters the approximate signal loss was 10%-20% between the in situ and post-transfer results. All general culture trends were captured for all vehicle treated cultures, all (vehicle + drug) treated cultures, and for two sets of 3D cell cultures in Matrigel: (a) primary neurons, and (b) secondary astrocytes. This demonstrated that the NRU assay can be read in situ in the SeedEZ and even in the presence of Matrigel embedded in the SeedEZ. Neutral Red is a vital stain which stains lysosomes of intact cells red. It is commonly used to assess end point cell survival, viability, cytotoxicity, intracellular pH, and membrane damage using both absorbance and fluorescence reads.NRU1-NRU2 Neutral Red Uptake (NRU) assay is based on the ability of viable cells to incorporate and bind the dye intracellularly by an active metabolic process. After the cells have been allowed to incorporate the dye, they are briefly washed or fixed. The dye is then released from cells in an acidified ethanol de-staining solution. An increase or decrease in the number of cells or their physiological state results in the corresponding change in the amount of the dye incorporated by the cells in the culture. This indicates the degree of cytotoxicity caused by applied test compound or leached from the tested material. In contrast with Neutral Red Uptake (NRU), the Neutral Red Release (NRR) measures cellular membrane integrity. In this assay, cells are preloaded with the dye and if the membranes are damaged, then the accumulated intracellular Neutral Red is released into the extracellular environment. References for Neutral Red application for fluorescence detection: NRU1. Rat P, Korwin-Zmijowska C, Warnet JM, Adolphe M. New in vitro fluorimetric microtitration assays for toxicological screening of drugs. Cell Biol Toxicol. 1994, 10(5-6):329-37. NRU2. Essig-Marcello JS, Van Buskirk RG. A double in situ cytotoxicity assay using the fluorescent probes Neutral Red and BCECF-AM. Toxicol. In vitro 1990, 3:219-27. alamarBlue ASSAY alamarBlue is a non-toxic REDOX indicator measuring mitochondrial reduction of blue Resazurin (oxidized, non-fluorescent reagent) applied to cells in culture into a red Resorufin, live-cell-reduced fluorescent reagent which cells expel. alamarBlue® is highly water soluble which eliminates time consuming wash and extraction steps. It is an easy to do cell survival, viability, proliferation and cytotoxicity assay requiring only the addition of a single reagent in a mix and measure format to live cells in culture, followed by plate reads. Since the dye is non-toxic, it is also applied for kinetic monitoring of culture health in numerous systems. According to the supplier, alamarBlue is a safe, convenient, and versatile assay that has been shown to effectively measure innate metabolic activity in animal, fungal and bacterial cells. References: aB1. Rampersad SN. Multiple applications of Alamar Blue as an indicator of metabolic function and cellular health in cell viability bioassays. SeedEZTM In situ Plate Reads| 5
- 9. Lena Biosciences Innovative 3D Culture Tools for Life Sciences SeedEZTM Application Notes www.lenabio.com Sensors (Basel). 2012, 12(9):12347-60. aB2. Niles AL, Moravec RA, Riss TL. In vitro viability and cytotoxicity testing and same-well multi-parametric combinations for high throughput screening. Curr Chem Genomics. 2009, 3:33-41. WHY ARE THE IN SITU READS NECESSARY? For a vast majority of molecules, the in situ reads may not be necessary. Still, they are more convenient to do as they do not require the extra step of solution transfer into a new plate. The in situ reads are common for those assays which are relatively non-toxic to cells and allow for post-assay culture growth and repeated assaying; for example, in post-drug treatments. An example of such assay is Calcein AM, alamarBlue assay, and similar fluorometric substrates (with Resorufin metabolites) for induction of cytochromes P450 by xenobiotics. The in situ reads are suggested when molecules remain “trapped” inside a gel in the SeedEZ and you are comparing results between 2D and 3D cell cultures. For 3D gel cell cultures in the SeedEZ, supernatants transferred into a new plate for posttransfer reads may be less concentrated if molecules of interest remained “trapped” in a gel due to steric hinderance or in case of continuous cell reduction of extracellular reagents, cell reduced products present in the gel did not equilibrate with the same in the supernatant. Under said conditions, one strategy is to aspirate all liquid from all wells (this leaves the gel dry in those wells which had cells in the gel), and transfer the solutions into corresponding wells of the new plate for reads. For the best results, any well-to-well differences in liquid volume should be compensated for. The second strategy is to gently shake the plate and read in situ, especially if the assay is non-toxic to the cells, and the continuation of cell culture growth is the objective. In what follows, are the guidelines and recommendations for in situ detection of cell activity and function in live cells embedded and cultured in the SeedEZ substrates. HOW TO COMPARE THE IN SITU READS BETWEEN A 2D CELL LAYER AND A 3D CELL CULTURE? If the objective is to compare cellular outcomes between 2D and 3D cell cultures then setting up appropriate controls is necessary for each group. Different types of cultures may be: • Cell monolayer cultures or 2D cell cultures A 2D culture is one layer of dissociated cells adhered to a coated or an uncoated plastic dish. • Overlaid cultures or sandwich cultures A “sandwich” culture is a layer of dissociated cells adhered to a coated dish and overlaid by a layer of extracellular matrix gel. • 3D gel-based cell cultures 3D gel cell culture is a culture of dissociated cells embedded within a gel or extracellular matrix. • 3D cell cultures in the SeedEZ SeedEZTM In situ Plate Reads| 6
- 10. Lena Biosciences Innovative 3D Culture Tools for Life Sciences SeedEZTM Application Notes www.lenabio.com Dissociated cells adhered to and embedded in the SeedEZ substrate, where the SeedEZ substrate is coated with cell adhesive ligands, if needed. • 3D gel cell cultures in the SeedEZ Dissociated cells embedded in a hydrogel in the SeedEZ, where the SeedEZ is coated or uncoated, and the gel is an extracellular matrix gel, a synthetic gel, or a naturally delivered gel of non-animal or animal origin. EXAMPLE: alamarBlue®FLUORESCENCE READS IN DIFFERENT 2D AND 3D CULTURE CONDITIONS It is important to understand how the presence of different materials in the well influence plate reads before analyzing cellular outcomes. Multiwell plate, well coating, gel, SeedEZ substrate, and the coating applied to the SeedEZ substrate all contribute to “background” fluorescence and suitable controls should be used both in 2D and 3D cell culture configurations. This will be demonstrated using alamarBlue assay® in a 48-well plate. alamarBlue ASSAY PRINCIPLE AND APPLICATIONS alamarBlue® is water soluble, stable in culture, and non-toxic. Metabolically active cells convert blue (oxidized) reagent into a red fluorescent and colorimetric indicator. According to the supplier, it is a safe and non-toxic dye for quantitative analysis of cell viability and cell proliferation, for cytokine bioassays and in vitro cytotoxicity studies. EXPERIMENTAL DETECTION Fluorometry: By excitation at 530 – 560 nm and emission at 590 nm Spectrophotometry: By absorbance measurements at 570 nm and 600 nm MATERIALS • Culture medium • Hank's Balanced Salt Solution (HBSS) • Poly-D-lysine Hydrobromide MW >300 kDa lyophilized powder, γ-irradiated; Sigma-Aldrich Product No. P7405 • Growth Factor Reduced Matrigel, High Concentration; BD Biosciences Product No. 354263 • alamarBlue; Life Technologies Product No. DAL1025 • Disposables: SeedEZ substrates SC-C048, a 48-well plate, and micropipette tips EQUIPMENT • Steam autoclave to prepare reduced form of alamarBlue (red Resorufin) • Plate reader capable of reading fluorescence reads METHODS SeedEZTM In situ Plate Reads| 7
- 11. Lena Biosciences SeedEZTM Application Notes www.lenabio.com Innovative 3D Culture Tools for Life Sciences REDUCTION OF ALAMARBLUE The reduced form of alamarBlue is unstable in water but very stable in medium. 1. Use alamarBlue stock solution and make 1:10 dilution in medium. 2. Transfer the solution to an autoclavable glass bottle. 3. Autoclave for 15-25 minutes. Keep the bottle top barely open during autoclaving to prevent evaporation. The autoclaving time depends on the solution volume. The solution should be red (reduced) upon autoclaving. 4. Use heat resistant autoclave gloves and transfer the bottle to the sink. Cool rapidly with tap water. 48-WELL PLATE LAYOUT FOR THE TESTING OF DIFFERENT 2D AND 3D CULTURE CONDITIONS 1. Mark and prepare the 48-well plate as shown below. Col 1 Col 2 MEDIUM Col 4 MEDIUM Row A Col 3 Col 5 alamarBlue alamarBlue alamarBlue MEDIUM MEDIUM Col 8 MEDIUM MEDIUM MEDIUM Row C alamarBlue alamarBlue alamarBue alamarBlue alamarBlue alamarBlue alamarBlue alamarBlue Row D alamarBlue alamarBlue alamarBue alamarBlue alamarBlue alamarBlue alamarBlue alamarBlue Row E alamarBlue alamarBlue alamarBue alamarBlue alamarBlue alamarBlue alamarBlue alamarBlue MEDIUM MEDIUM Col 7 Row B Row F MEDIUM Col 6 alamarBlue alamarBlue alamarBlue 30 µl of HBSS Plain well HBSS PDL-coated well Matrigel MG in a plain well HBSS SC in a plain well Matrigel (SC + MG) in a plain well Matrigel MG in a PDL-coated well HBSS SC in a PDL-coated well Abbreviations: Matrigel (SC+MG) in a PDL-coated well MG GFR Matrigel 7.5 mg/ml in HBSS HBSS PDL-coated (well + SC) PDL Poly-D-Lysine coating Matrigel [PDL-coated (well + SC)] + MG SC SeedEZ substrates SC-C048 SeedEZTM In situ Plate Reads| 8
- 12. Lena Biosciences SeedEZTM Application Notes www.lenabio.com Innovative 3D Culture Tools for Life Sciences 2. To wells designated for Poly-D-Lysine (PDL) coating with or without the SeedEZ, add at least 250 µl of 100 µg/ml PDL solution and incubate overnight in a 5% CO2 37oC incubator. 3. Following overnight coat, rinse the PDL-coated wells and the PDL-coated (wells + SeedEZ) 2X with sterile DI water. 4. After you aspirate the last rinse, dry the SeedEZ substrate by placing pipette tip on the substrate and aspirating any remaining liquid from the SeedEZ. You will notice the color change from transparent to white when dried. 5. In wells designated for Matrigel with or without SeedEZ, dispense 30 µl of 7.5 mg/ml GFR Matrigel. 6. Place the lid and transfer to a 5% CO2 37oC incubator for 45 minutes for Matrigel to gel. 7. Transfer the plate to hood and supplement the extra volume of Matrigel in those wells that do not have the gel by adding 30 µl of HBSS. 8. Add 250 µl of reduced alamarBlue to each well. 9. Gently swirl the plate and wait for solution to equilibrate with the gel. 10. Transfer the plate to a plate reader for fluorescence reads. FLUORESCENCE READOUT PARAMETERS FOR BIOTEK SYNERGY H4 MICROPLATE READER The top and bottom reads were taken at two excitation and respective emission wavelengths: A. Plate temperature: 37oC B. Plate type: 48 well plate C. Fluorescence endpoint Read: D. Filter set: 1 Excitation: Emission: Filter set: 585 ±4.5 nm Optics: E. 565 ± 4.5 nm Top 2 Excitation: Emission: Filter set: 585 ± 4.5 nm Optics: F. 565 ± 4.5 nm Bottom 3 Excitation: 545 ± 4.5 nm SeedEZTM In situ Plate Reads| 9
- 13. Lena Biosciences SeedEZTM Application Notes www.lenabio.com Innovative 3D Culture Tools for Life Sciences Emission: Optics: G. Filter set: 590 ± 4.5 nm Top 4 Excitation: 545 ± 4.5 nm Emission: 590 ± 4.5 nm Optics: Bottom H. Gain: AutoScale I. Light Source: Xenon Flash J. Measurements/Data Point: 10 K. Read Height: 8 mm L. Plate lid: Absent EXPECTED OUTCOMES OF THE EXPERIMENT DESIGN MEDIUM CONTROLS Medium controls served to indicate that the alamarBlue assay worked. It was expected that medium controls would yield negligible fluorescence relative to that of alamarBlue reduced by autoclaving. The medium was Neurobasal + 2% B-27+ 1% G-5 + 0.5 mM Glutamax. Medium controls also served as reference measurements with respect to alamarBlue detection. It was expected that the background fluorescence generated by wells and different materials in the wells could be compensated for by subtracting the reference measurement from the assay measurement. TOP AND BOTTOM EPIFLUORESCENCE READS The top and bottom reads served to indicate the differences in detection condition on measured fluorescence intensity. Typically, bottom reads are focused on the sample near the well bottom. Top reads are focused on the sample at an inner point of the well volume. Bottom reads were expected to be influenced by autofluorescence, light refraction and reflection at the bottom of the well more so than the top reads. However, the top reads were expected to be more influenced by autofluorescence, light reflection and refraction through the SeedEZ than the bottom reads. For most instruments, bottom reads may provide better results when working with an adherent cell layer. The top reads frequently provide better signal-to-noise ratio for solution-based assays. Here, both reads were taken to examine the assay outcomes under conditions studied. DUAL WAVELENGTH MEASUREMENTS SeedEZTM In situ Plate Reads| 10
- 14. Lena Biosciences Innovative 3D Culture Tools for Life Sciences SeedEZTM Application Notes www.lenabio.com For both, the top and the bottom reads, two excitation and emission wavelengths were used to confirm general trends and confirm the following: 1. Relative differences in culturing conditions were expected to be found for both Ex565/Em585 and Ex545/Em590 in the respective top and bottom reads. 2. It was expected that in all groups the magnitude of detected fluorescence would be higher for Ex545/Em590 than for Ex565/Em585 because the former was closer to the peak fluorescence of reduced alamarBlue. 3. Considering 1 and 2 above, it was expected that corresponding relative differences in culturing conditions would be higher in Ex545/Em590 reads for both the top and the bottom reads than in respective Ex565/Em585 reads. ACELLULAR RESULTS MEDIUM CONTROLS As expected, the background fluorescence in medium controls (Figs. 1-2) was negligible. For each condition, the alamarBlue fluorescence (Figs. 3-4) was 3 orders of magnitude higher than the corresponding background fluorescence in medium controls for both the top and the bottom reads, and for the two excitation and respective emission wavelengths. For all conditions, the background fluorescence was no more than 0.5% of the corresponding alamarBlue readout; and most commonly under 0.1%. Assuming that the medium fluorescence was negligible: 1. In the top read (Fig. 1), autofluorescence, light reflection and refraction from the surfaces of a plain well was lower than in the bottom read (Fig. 2). 2. In the top read (Fig. 1), autofluorescence, light reflection and refraction from the surfaces of the SeedEZ in a plain (PDL-uncoated) well was higher than in the bottom read (Fig. 2). In top reads (Fig. 1), the PDL-coating, gelled Matrigel and the SeedEZ substrate all gave higher background than was the corresponding background of a plain well. SeedEZ generally gave higher background than either the gelled Matrigel or the PDL coating. Still, the SeedEZ background fluorescence in medium was negligible; below 0.5% of the corresponding alamarBlue read (Figs. 3-4). In the bottom read (Fig. 2), the PDL-coating and Matrigel gave higher background than was the corresponding background of the plain well, while the SeedEZ generally reduced the background fluorescence. Although the medium control measurements were taken from one sample per condition here, the above conclusions are consistent with the general findings from a number of assays with medium controls run previously. SeedEZTM In situ Plate Reads| 11
- 15. Lena Biosciences SeedEZTM Application Notes www.lenabio.com Innovative 3D Culture Tools for Life Sciences Note that measured background fluorescence intensity for each condition is valid only for the excitation and the emission wavelengths studied here. For different excitation/emission wavelengths, the reference controls and reads are necessary. Top reads - Medium controls 5.5×10 1 Ex545/Em590 Top read Ex565/Em585 Top read 5.0×10 1 4.5×10 1 Fluorescence (a.u.) 4.0×10 1 3.5×10 1 3.0×10 1 2.5×10 1 2.0×10 1 1.5×10 1 1.0×10 1 5.0×10 0 Pl ai n PD w el Ll co at ed M G w el in l a pl ai n SC w el in (S l a C pl + ai M n G w )i el n M l a G pl in ai a n PD w el LSC l co at in (S ed a C PD w + el M Ll G co )i at n ed a PD w el Ll PD co at L[P ed co D at w Lel ed co l (S at ed C + (S w C el + l) w el l)] + M G 0 Fig. 1 Background fluorescence in top reads as a function of different 2D and 3D cell culturing conditions. Ex545/Em590 was expected to yield higher fluorescence signal than Ex565/Em585. The reads were taken in the same run as those in Figs. 3-6. Abbreviations: PDL = Poly-D-Lysine coating, MG = Matrigel, SC = SeedEZ SC-C048 substrate. SeedEZTM In situ Plate Reads| 12
- 16. Lena Biosciences SeedEZTM Application Notes www.lenabio.com Innovative 3D Culture Tools for Life Sciences Bottom reads - Medium controls 5.5×10 1 Ex545/Em590 Bottom read Ex565/Em585 Bottom read 5.0×10 1 4.5×10 1 Fluorescence (a.u.) 4.0×10 1 3.5×10 1 3.0×10 1 2.5×10 1 2.0×10 1 1.5×10 1 1.0×10 1 5.0×10 0 Pl ai n PD w el Ll co at ed M G w el in l a pl ai n SC w el in (S l a C pl + ai M n G w )i el n M l a G pl in ai a n PD w el LSC l co at in (S ed a C PD w + el M Ll G co )i at n ed a PD w el Ll PD co at L[P ed co D at w Lel ed co l (S at ed C + (S w C el + l) w el l)] + M G 0 Fig. 2 Background fluorescence in bottom reads as a function of different 2D and 3D cell culturing conditions. Ex545/Em590 was expected to yield higher fluorescence signal than Ex565/Em585. The reads were taken in the same run as those in Figs. 3-6. Abbreviations: PDL = Poly-D-Lysine coating, MG = Matrigel, SC = SeedEZ SC-C048 substrate. RECOMMENDATION USE SUITABLE CONTROLS FOR YOUR STUDY. MOLECULES SERVING AS A COATING, A COMPONENT OF THE COATING, A HYDROGEL, A HYDROGEL CONSTITUENT, COMPONENTS OF MEDIA AND BUFFERS, TEST COMPOUNDS, AND EVEN THE INTRACELLULAR CONSTITUENTS MAY BE ABLE TO PRODUCE A DETECTABLE LEVEL OF INTRINSIC FLUORESCENCE AT SPECIFIC EXCITATION WAVELENGTHS. SeedEZTM In situ Plate Reads| 13
- 17. Lena Biosciences Innovative 3D Culture Tools for Life Sciences SeedEZTM Application Notes www.lenabio.com For example, Collagen, Elastin and other proteins and molecules present in the extracellular matrices or synthetic peptide matrices may produce detectable fluorescence under suitable excitation wavelengths. While low, the intrinsic fluorescence of Matrigel may be detected by UV excitation. Often, lower purity (and less expensive) polymer grades used for preparing coating solutions fluoresce; for example, less pure Poly-D-Lysine fluoresces in red. Intracellular sources of fluorescence are also present; for example, NAD(P)H. Other sources of intrinsic fluorescence are vitamins and other molecules present in media or buffers. All this necessitates use of suitable controls for conclusive interpretation of results. DIFFERENCES BETWEEN THE TOP AND BOTTOM READS Consistent with medium controls (Figs. 1-2), the alamarBlue fluorescence (Figs. 3-4) was: 1. Lower in top reads than in the bottom reads in a plain well. 2. Higher in top reads than in the bottom reads with the SeedEZ in a plain (PDL-uncoated) well. For a fixed solution in the well, the differences between the top and bottom reads in the plain well (Figs. 3-4) were significantly higher than the corresponding differences between the top and bottom reads with the SeedEZ in a plain (PDLuncoated) well. CONSIDERING THAT AN IDENTICAL SAMPLE WAS READ, 3D CELL CULTURE RESULTS USING SeedEZ MAY BE LESS SENSITIVE TO THE ORIENTATION OF EPIFLUORESCENCE READS, WHEREAS PLANAR CELL MONOLAYER (2D CULTURE) RESULTS MAY BE MORE SENSITIVE. In general, the reads in the presence of SeedEZ in an uncoated-well differed from the corresponding reads in the plain well by approximately 10% -15%. These differences were statistically significant. In general, the reads in the presence of gelled Matrigel in an uncoated-well differed from the corresponding reads in the plain well by less than 10%. These differences were not statistically significant. When comparing the in situ 2D cell culture outcomes with 3D gel cell culture outcomes, suitable controls are necessary to compensate for the differences in background fluorescence. WHEN COMPARING THE 2D CULTURE RESULTS WITH THE 3D CELL CULTURE RESULTS IN THE SeedEZ, SETUP SUITABLE CONTROLS AS YOU NORMALLY WOULD IF YOU HAD A 2D CULTURE AND A 3D GEL CELL CULTURE. The above is especially true for gel cell cultures in the SeedEZ where the epifluorescence reads may be reduced by as much as 30% from the nominal plain well result. SeedEZTM In situ Plate Reads| 14
- 18. Lena Biosciences SeedEZTM Application Notes www.lenabio.com Innovative 3D Culture Tools for Life Sciences alamarBlue - Ex545/Em590 Ex545/Em590 Top read 5.5×10 4 Ex545/Em590 Bottom read 5.0×10 4 4.5×10 4 Fluorescence (a.u.) 4.0×10 4 3.5×10 4 3.0×10 4 2.5×10 4 2.0×10 4 1.5×10 4 1.0×10 4 5.0×10 3 Pl ai n PD w el Ll co at ed M G w el in l a pl ai n SC w el in (S l a C pl + ai M n G w )i el n M l a G pl in ai a n PD w el LSC l co at in (S ed a C PD w + el M Ll G co )i at n ed a PD w el Ll PD co at L[P ed co D at w Lel ed co l (S at ed C + (S w C el + l) w el l)] + M G 0 Fig. 3 The differences between the top and bottom acellular alamarBlue assay reads Ex545/Em590 as a function of different 2D and 3D cell culturing conditions. There were 3 replicates per condition. For each replicate, the read was an averaged value of 10 reads. The data is shown as mean ± SD. Abbreviations: PDL = Poly-D-Lysine coating, MG = Matrigel, SC = SeedEZ SC-C048 substrate. SeedEZTM In situ Plate Reads| 15
- 19. Lena Biosciences SeedEZTM Application Notes www.lenabio.com Innovative 3D Culture Tools for Life Sciences alamarBlue - Ex565/Em585 5.5×10 4 Ex565/Em585 Top read Ex565/Em585 Bottom read 5.0×10 4 4.5×10 4 Fluorescence (a.u.) 4.0×10 4 3.5×10 4 3.0×10 4 2.5×10 4 2.0×10 4 1.5×10 4 1.0×10 4 5.0×10 3 Pl ai n PD w el Ll co at ed M G w el in l a pl ai n SC w el in (S l a C pl + ai M n G w )i el n M l a G pl in ai a n PD w el LSC l co at in (S ed a C PD w + el M Ll G co )i at n ed a PD w el Ll PD co at L[P ed co D at w Lel ed co l (S at ed C + (S w C el + l) w el l)] + M G 0 Fig. 4 The differences between the top and bottom acellular alamarBlue assay reads Ex565/Em585 as a function of different 2D and 3D cell culturing conditions. There were 3 replicates per condition. For each replicate, the read was an averaged value of 10 reads. The data is shown as mean ± SD. Abbreviations: PDL = Poly-D-Lysine coating, MG = Matrigel, SC = SeedEZ SC-C048 substrate. SeedEZTM In situ Plate Reads| 16
- 20. Lena Biosciences SeedEZTM Application Notes www.lenabio.com Innovative 3D Culture Tools for Life Sciences THE VARIATION IN READS WITH WAVELENGTH Taking measurements at two distinct excitation and emission wavelengths served to confirm general trends of measured fluorescence intensity with respect to culturing conditions. In both, the top (Fig. 5) and the bottom reads (Fig.6) detected fluorescence was generally higher for Ex545/Em590 than for Ex565/Em585, as expected, because the former was closer to the excitation and emission peaks of the reduced alamarBlue. For spectral readouts, please see the Emission Spectrum. To find out which culturing conditions produced statistically significant differences in fluorescence intensity measurements, please see Statistical Significance. alamarBlue - Top reads 5.5×10 4 Ex545/Em590 Top read Ex565/Em585 Top read 5.0×10 4 4.5×10 4 Fluorescence (a.u.) 4.0×10 4 3.5×10 4 3.0×10 4 2.5×10 4 2.0×10 4 1.5×10 4 1.0×10 4 5.0×10 3 Pl ai n PD w el Ll co at ed M G w el in l a pl ai n SC w el in (S l a C pl + ai M n G w )i el n M l a G pl in ai a n PD w el LSC l co at in (S ed a C PD w + el M Ll G co )i at n ed a PD w el Ll PD co at L[P ed co D at w Lel ed co l (S at ed C + (S w C el + l) w el l)] + M G 0 Fig. 5 Top reads of an acellular alamarBlue assay as a function of different 2D and 3D cell culturing conditions. Ex545/Em590 was expected to yield higher fluorescence signal than Ex565/Em585. There were 3 replicates per condition. For each replicate, the read was an averaged value of 10 reads. The data is shown as mean ± SD. Abbreviations: PDL = Poly-D-Lysine coating, MG = Matrigel, SC = SeedEZ SC-C048 substrate. SeedEZTM In situ Plate Reads| 17
- 21. Lena Biosciences SeedEZTM Application Notes www.lenabio.com Innovative 3D Culture Tools for Life Sciences alamarBlue - Bottom reads Ex545/Em590 Bottom read 5.5×10 4 Ex565/Em585 Bottom read 5.0×10 4 4.5×10 4 Fluorescence (a.u.) 4.0×10 4 3.5×10 4 3.0×10 4 2.5×10 4 2.0×10 4 1.5×10 4 1.0×10 4 5.0×10 3 Pl ai n PD w el Ll co at ed M G w el in l a pl ai n SC w el in (S l a C pl + ai M n G w )i el n M l a G pl in ai a n PD w el LSC l co at in (S ed a C PD w + el M Ll G co )i at n ed a PD w el Ll PD co at L[P ed co D at w Lel ed co l (S at ed C + (S w C el + l) w el l)] + M G 0 Fig. 6 Bottom reads of an acellular alamarBlue assay as a function of different 2D and 3D cell culturing conditions. Ex545/Em590 was expected to yield higher fluorescence signal than Ex565/Em585. There were 3 replicates per condition. For each replicate, the read was an averaged value of 10 reads. The data is shown as mean ± SD. Abbreviations: PDL = Poly-D-Lysine coating, MG = Matrigel, SC = SeedEZ SC-C048 substrate. SeedEZTM In situ Plate Reads| 18
- 22. Lena Biosciences SeedEZTM Application Notes www.lenabio.com Innovative 3D Culture Tools for Life Sciences EMISSION SPECTRUM FOR VARIOUS CULTURING CONDITIONS AT 545 NM EXCITATION TOP READS Fig. 7 Top read emission spectrum of the acellular alamarBlue assay as a func tion of different 2D and 3D cell culturing conditions. The excitation wavelength was fixed at 545 nm. Vertical axis for each plot: Fluorescence (a.u.). Horizontal axis for each plot: Wavelength 575 nm to 750 nm with 10 nm increment. Well arrangement corresponds to that shown in a 48-well plate layout in Methods. Wells showing negligible fluorescence were medium controls. SeedEZTM In situ Plate Reads| 19
- 23. Lena Biosciences SeedEZTM Application Notes www.lenabio.com Innovative 3D Culture Tools for Life Sciences BOTTOM READS Fig. 8 Bottom read emission spectrum of the acellular alamarBlue assay as a function of different 2D and 3D cell culturing conditions. The excitation wavelength was fixed at 545 nm. Vertical axis for each plot: Fluorescence (a.u.). Horizontal axis for each plot: Wavelength 575 nm to 750 nm with 10 nm increment. Well arrangement corresponds to that shown in a 48-well plate layout in Methods. Wells showing negligible fluorescence were medium controls. SeedEZTM In situ Plate Reads| 20
- 24. Lena Biosciences SeedEZTM Application Notes www.lenabio.com Innovative 3D Culture Tools for Life Sciences STATISTICAL SIGNIFICANCE OF ACELLULAR RESULTS Statistical analysis was done using general linear model ANOVA (95% confidence interval) followed by post-hoc Tukey’s pair-wise comparisons; p < 0.05 was required for statistical significance in either test. 545/590 Top read 545/590 Bottom read Top read 565/585 Bottom read P<0.0001 Yes 10 68.1 0.9684 P<0.0001 Yes 10 23.55 0.9138 P<0.0001 Yes 10 50.37 0.9577 P<0.0001 Yes 10 60.16 0.9644 P value P value P value P value Plain well vs PDL-coated well Plain well vs MG in a plain well Plain well vs SC in a plain well Plain well vs (SC + MG) in a plain well P > 0.05 P > 0.05 P < 0.001 P < 0.001 P > 0.05 P > 0.05 P < 0.01 P < 0.001 P > 0.05 P > 0.05 P < 0.001 P < 0.001 P > 0.05 P < 0.05 P < 0.001 P < 0.001 PDL-coated well vs MG in a PDL-coated well PDL-coated well vs SC in a PDL-coated well PDL-coated well vs (SC + MG) in a PDL-coated well PDL-coated well vs PDL-coated (SC + well) PDL-coated well vs [PDL-coated (SC + well)] + MG P > 0.05 P < 0.001 P < 0.001 P < 0.001 P < 0.001 P > 0.05 P < 0.05 P < 0.001 P > 0.05 P < 0.001 P > 0.05 P < 0.001 P < 0.01 P < 0.001 P < 0.001 P > 0.05 P > 0.05 P < 0.001 P > 0.05 P < 0.001 MG in a plain well vs SC in a plain well MG in a plain well vs (SC + MG) in a plain well MG in a plain well vs MG in a PDL-coated well P < 0.001 P < 0.001 P > 0.05 P > 0.05 P < 0.001 P > 0.05 P < 0.001 P < 0.001 P > 0.05 P > 0.05 P < 0.001 P > 0.05 SC in a plain well vs (SC + MG) in a plain well SC in a plain well vs SC in a PDL-coated well SC in a plain well vs PDL-coated (SC + well) P > 0.05 P > 0.05 P < 0.05 P > 0.05 P > 0.05 P < 0.05 P > 0.05 P > 0.05 P < 0.001 P < 0.001 P > 0.05 P < 0.01 (SC + MG) in a plain well vs (SC + MG) in a PDL-coated well (SC + MG) in a plain well vs [PDL-coated (SC + well)] + MG P > 0.05 P > 0.05 P > 0.05 P > 0.05 P > 0.05 P < 0.05 P > 0.05 P > 0.05 MG in a PDL-coated well vs SC in a PDL-coated well MG in a PDL-coated well vs (SC + MG) in a PDL-coated well MG in a PDL-coated well vs [PDL-coated (SC + well)] + MG P < 0.001 P < 0.001 P < 0.001 P > 0.05 P < 0.001 P < 0.001 P < 0.001 P < 0.001 P < 0.001 P > 0.05 P < 0.001 P < 0.001 SC in a PDL-coated well vs (SC + MG) in a PDL-coated well SC in a PDL-coated well vs PDL-coated (SC + well) SC in a PDL-coated well vs [PDL-coated (SC + well)] + MG P > 0.05 P > 0.05 P > 0.05 P < 0.05 P > 0.05 P < 0.001 P > 0.05 P < 0.01 P > 0.05 P < 0.001 P > 0.05 P < 0.001 (SC + MG) in a PDL-coated well vs PDL-coated (SC + well) (SC + MG) in a PDL-coated well vs [PDL-coated (SC + well)] + MG P < 0.05 P > 0.05 P < 0.001 P > 0.05 P < 0.001 P < 0.01 P < 0.001 P > 0.05 PDL-coated (SC + well) vs [PDL-coated (SC + well)] + MG P > 0.05 P < 0.001 P > 0.05 P < 0.001 alamarBlue assay 565/585 One-way analysis of variance P value Are means significantly different? (P < 0.05) Number of groups F R squared Tukey's Multiple Comparison Test SeedEZTM In situ Plate Reads| 21
- 25. Lena Biosciences SeedEZTM Application Notes www.lenabio.com Innovative 3D Culture Tools for Life Sciences THE SeedEZ There were significant differences between reads comprising SeedEZ in a plain (uncoated) well versus the plain well. There were significant differences between the SeedEZ in a PDL-coated well and the PDL-coated well. In top reads, there was a significant difference between PDL-coated (SeedEZ + well) vs. PDL-coated well. In bottom reads, there was a significant difference between Matrigel in a plain well and the SeedEZ in a plain well. There were significant differences between Matrigel in a plain well vs. (SeedEZ + Matrigel) in a plain well. GELLED MATRIGEL Generally, there were no significant differences between gelled Matrigel in a plain (uncoated) well vs. the plain well. There were no significant differences between Matrigel in a PDL-coated well vs. the PDL-coated well. POLY-D-LYSINE COATING There were no significant differences between PDL-coated well versus the plain well. However, there was a significant difference between SeedEZ in a plain well versus PDL-coated (SeedEZ + well). 2D AND 3D CELL CUTURE RESULTS WITH BRAIN CELLS Calcein AM ASSAY VS alamarBlue ASSAY WITH 10 DAY CULTURED ASTROCYTES CELL CULTURING CONDITIONS P0-harvested and 4X passaged astrocytes were seeded at 75,000 cells/well for all culturing conditions. Cells were cultured for 10 days in respective 2D and 3D cell culturing conditions by exchanging approximately half the medium every 2-3 days. The medium was Neurobasal + 2% B-27 + 1% G-5 + 0.5 mM GlutaMAX. The following conditions were tested: Culture type at seeding Culturing conditions Expected morphology and cell distribution 2D 2D 3D 3D Cell monolayer in a PDL-coated well PDL-cell-Matrigel sandwich cultures Cells in gelled Matrigel in the SeedEZ Cells in gelled Matrigel in PDL-coated SeedEZ Flat cell morphology and one cell layer More round cells typically in a layer Round cells in 3D (multiple cell layers) Round cells in 3D (multiple cell layers) Plate preparation materials: Poly-D-Lysine: Sigma-Aldrich Product No. P7405 (MW >300 kDa lyophilized powder, γ-irradiated). Matrigel: BD Biosciences Product No. 354263 (Growth Factor Reduced Matrigel, High Concentration). Disposables: 48-well plate, SeedEZ SC-C048 substrates, pipet tips, conical tubes Poly-D-Lysine coating: All wells and SeedEZ substrates designated for PDL-coating were coated overnight in a 5% CO2 37oC incubator using 100 µg/ml sterile Poly-D-Lysine in DI water. SeedEZTM In situ Plate Reads| 22
- 26. Lena Biosciences SeedEZTM Application Notes www.lenabio.com Innovative 3D Culture Tools for Life Sciences Matrigel: Matrigel overlay for sandwich cultures and 3D cell cultures in Matrigel in SeedEZ SC-C048 received 7.5 mg/ml GFR Matrigel. As received from the manufacturer, Matrigel was first aliquoted to 15 mg/ml followed by further dilution for use in cell culture applications at 7.5 mg/ml final concentration either as an overlay for adhered cells, or as a sol-state cell suspension at seeding. EXPERIMENTAL CAVEATS A. Astrocyte is a cell type which grows well in 2D. B. Astrocytes in vitro prefer stiffer substrates for growth and proliferation. C. When cultured in 2D, astrocytes are in a more reactive state than when cultured in 3D. A. In a more reactive state, astrocytes are more activated than they are in the in vivo brain. B. Injury, aging, and other circumstances may contribute to a more reactive astrocyte state in vivo. References: Georges PC, Miller WJ, Meaney DF, Sawyer ES, Janmey PA. Matrices with compliance comparable to that of brain tissue select neuronal over glial growth in mixed cortical cultures. Biophys J. 2006, 90(8):3012-8. http://www.ncbi.nlm.nih.gov/pubmed/16461391 Flanagan LA, Ju YE, Marg B, Osterfield M, Janmey PA. Neurite branching on deformable substrates. Neuroreport. 2002, 13(18):2411-5. http://www.ncbi.nlm.nih.gov/pubmed/12499839 East E, Golding JP, Phillips JB.Georges PC, Miller WJ, Meaney DF, Sawyer ES, Janmey PA. A versatile 3D culture model facilitates monitoring of astrocytes undergoing reactive gliosis. J Tissue Eng Regen Med. 2009, 3(8):634-46. http://www.ncbi.nlm.nih.gov/pubmed/19813215 Georges PC, Janmey PA. Cell type-specific response to growth on soft materials. J Appl Physiol. 2005, 98(4):1547-53. http://www.ncbi.nlm.nih.gov/pubmed/15772065 Wells RG. The role of matrix stiffness in regulating cell behavior. Hepatology. 2008, 47(4):1394-400 http://www.ncbi.nlm.nih.gov/pubmed/18307210 SeedEZTM In situ Plate Reads| 23
- 27. Lena Biosciences SeedEZTM Application Notes www.lenabio.com Innovative 3D Culture Tools for Life Sciences alamarBlue ASSAY TOP READS 10 Day astrocytes - Top in situ reads minus reduced alamarBlue controls Ex545/Em590 2.5×10 4 Fluorescence difference (a.u.) 2.0×10 4 1.5×10 4 1.0×10 4 5.0×10 3 ) L( SC SC PD in G in M G in -c el ls in M -c el ls 3D Q ua si 3 3D D 2D -c el ls in PD Lce llM G a PD L -5.0×10 3 sa nd w ic h w el l 0 Fig. 9 alamarBlue assay with P0-harvested and 4X passaged astrocytes after 10 days in culture for different 2D and 3D cell culturing conditions. For each condition, the respective autoclave-reduced alamarBlue control reads were subtracted from the in situ measurements. The data is shown as mean ± SD. For 2D cell cultures and for quasi-3D Poly-D-Lysine-cells-Matrigel sandwich cultures there were 5 replicates. For 3D cell culturing conditions there were 4 replicates per condition. In quasi-3D cultures, the cells were first plated in a PDL-coated well and then overlaid with a layer of Matrigel when adhered. Abbreviations: PDL = Poly-D-Lysine coating, MG = Matrigel, SC = SeedEZ SC-C048 substrate. STATISTICAL ANALYSIS OF THE CELLULAR alamarBlue ASSAY RESULTS Statistical analysis was done using general linear model ANOVA (95% confidence interval) followed by post-hoc Tukey’s pair-wise comparisons; p < 0.05 was required for statistical significance in either test. alamarBlue assay: 10 Day Astrocytes - Top read Ex545/Em590 One-way analysis of variance P value P<0.0001 Are means significantly different? (P < 0.05) Yes Number of groups 4 SeedEZTM In situ Plate Reads| 24
- 28. Lena Biosciences SeedEZTM Application Notes www.lenabio.com Innovative 3D Culture Tools for Life Sciences F 46.19 R squared 0.9082 Tukey's Multiple Comparison Test P value 2D - cells in a PDL well vs Quasi 3D PDL-cell-MG sandwich P > 0.05 2D - cells in a PDL well vs 3D - cells in MG in SC P < 0.001 2D - cells in a PDL well vs 3D - cells in MG in PDL(SC) P < 0.001 Quasi 3D PDL-cell-MG sandwich vs 3D - cells in MG in SC P < 0.001 Quasi 3D PDL-cell-MG sandwich vs 3D - cells in MG in PDL(SC) P < 0.001 3D - cells in MG in SC vs 3D - cells in MG in PDL(SC) P > 0.05 Calcein AM ASSAY TOP READS 10 Day astrocytes - Top in situ reads Calcein AM assay Ex494/Em517 1.6×10 4 1.4×10 4 Fluorescence (a.u.) 1.2×10 4 1.0×10 4 8.0×10 3 6.0×10 3 4.0×10 3 2.0×10 3 ) L( SC SC PD in G in M G in M el ls 3D -c el ls in -c 3D Q ua s i3 D 2D -c el ls in PD Lce llM G a PD L sa nd w ic h w el l 0 STATISTICAL ANALYSIS OF THE Calcein AM ASSAY RESULTS Statistical analysis was done using general linear model ANOVA (95% confidence interval) followed by post-hoc Tukey’s pair-wise comparisons; p < 0.05 was required for statistical significance in either test. SeedEZTM In situ Plate Reads| 25
- 29. Lena Biosciences SeedEZTM Application Notes www.lenabio.com Innovative 3D Culture Tools for Life Sciences Calcein AM assay: 10 Day Astrocytes - Top read Ex494/Em517 One-way analysis of variance P value P<0.0001 Are means significantly different? (P < 0.05) Yes Number of groups 4 F 41.29 R squared 0.8985 Tukey's Multiple Comparison Test P value 2D - cells in a PDL well vs Quasi 3D PDL-cell-MG sandwich P > 0.05 2D - cells in a PDL well vs 3D - cells in MG in SC P < 0.001 2D - cells in a PDL well vs 3D - cells in MG in PDL(SC) P < 0.001 Quasi 3D PDL-cell-MG sandwich vs 3D - cells in MG in SC P < 0.001 Quasi 3D PDL-cell-MG sandwich vs 3D - cells in MG in PDL(SC) P < 0.001 3D - cells in MG in SC vs 3D - cells in MG in PDL(SC) P > 0.05 RESULTS SHOW THE FOLLOWING: I. In situ reads can be done. II. Two different cell-based assays showed the same trends in cellular outcomes for different culturing conditions. III. 3D cultures have higher mitochondrial metabolism (measured in situ by the alamarBlue assay) than 2D cultures. IV. 3D cultures have higher live cell density (measured by Calcein AM intracellular fluorescence) than 2D cultures. V. If cultured in the SeedEZ, astrocytes grow well in 3D. SeedEZTM In situ Plate Reads| 26
- 30. Lena Biosciences SeedEZTM Application Notes www.lenabio.com Innovative 3D Culture Tools for Life Sciences alamarBlue ASSAY WITH 10 DAY CULTURED PRIMARY CORTICAL NEURONS AND 1X PASSAGED GLIA CELL CULTURING CONDITIONS A 2:1 cell ratio of E-18 primary cortical neurons and P0-harvested and 1X passaged glial cells was seeded at 120,000 cells per well. There was approximately 15% of microglia in a total glial (astrocyte and microglia) population at seeding. Cells were cultured for 10 days. During the first 3 days in culture the medium composition was Neurobasal + 2% B-27 + 1% G-5 + 0.5 mM GlutaMAX. At day 4 in culture the medium composition was changed to Neurobasal + 2% B-27 + 0.5 mM GlutaMAX. Cultures were fed every 2-3 days by exchanging approximately half the medium. The following culturing conditions were tested: Culture type at seeding Culturing conditions Expected morphology/cell distribution 2D 3D 3D 3D Cell monolayer on a PDL-coated well Cells in gelled Matrigel Cells in gelled Matrigel in the SeedEZ Cells in gelled Matrigel in PDL-coated (SeedEZ+well) Flat cells in one cell layer Round cells in 3D (multiple cell layers) Round cells in 3D (multiple cell layers) Round cells in 3D (multiple cell layers) Plate preparation materials: Poly-D-Lysine: Sigma-Aldrich Product No. P7405 (MW >300 kDa lyophilized powder, γ-irradiated). Matrigel: BD Biosciences Product No. 354263 (Growth Factor Reduced Matrigel, High Concentration). Disposables: 48-well plate, SeedEZ SC-C048 substrates, pipet tips, conical tubes Poly-D-Lysine coating: All wells and SeedEZ substrates designated for PDL-coating were coated overnight in a 5% CO2 37oC incubator using 100 µg/ml sterile Poly-D-Lysine in DI water. Matrigel: Matrigel cultures and Matrigel cultures in the SeedEZ SC-C048 received 7.5 mg/ml GFR Matrigel sol-state cell suspension at seeding. EXPERIMENTAL CAVEATS Neurons tend to grow better in a gel than on rigid substrata and astrocytes vice versa. SeedEZTM In situ Plate Reads| 27
- 31. Lena Biosciences SeedEZTM Application Notes www.lenabio.com Innovative 3D Culture Tools for Life Sciences amarBlue ASSAY TOP READS 10 Day 2:1 Neurons:Glia - Top in situ reads minus reduced alamarBlue controls Ex545/Em590 Fluorescence difference (a.u.) 1.0×10 4 8.0×10 3 6.0×10 3 4.0×10 3 2.0×10 3 +w el l) SC L( SC PD )i n +M G 3D (c el ls 3D el ls -c 3D -( ce lls +M G in L PD a in el ls -c 2D )i n M w el l G 0 Fig. 11 alamarBlue assay with E-18 primary cortical neurons and P0-harvested and 1X passaged mixed glia at a 2:1 neuron to glial cell ratio at seeding for different 2D and 3D culturing conditions. Glial cells were a mixed population of astrocytes and microglia. For each condition, respective autoclave-reduced alamarBlue control reads were subtracted from the in situ measurements. The data is shown as mean ± SD. There were 5 replicates per condition at seeding. One 3D Matrigel culture without the SeedEZ peeled off during media exchanges; thus, leaving 4 replicates for the assay. Abbreviations: PDL = Poly-D-Lysine coating, MG = Matrigel, SC = SeedEZ SC-C048 substrate. STATISTICAL ANALYSIS OF THE CELLULAR alamarBlue ASSAY RESULTS Statistical analysis was done using general linear model ANOVA (95% confidence interval) followed by post-hoc Tukey’s pair-wise comparisons; p < 0.05 was required for statistical significance in either test. alamarBlue assay: 10 Day 2:1 Neurons:Glia - Top read Ex545/Em590 One-way analysis of variance P value P<0.0001 Are means significantly different? (P < 0.05) Yes Number of groups 4 F 41.02 SeedEZTM In situ Plate Reads| 28
- 32. Lena Biosciences SeedEZTM Application Notes www.lenabio.com Innovative 3D Culture Tools for Life Sciences R squared 0.8914 Tukey's Multiple Comparison Test P value 2D - cells in a PDL well vs 3D - cells in MG P > 0.05 2D - cells in a PDL well vs 3D - (cells+MG) in SC P < 0.001 2D - cells in a PDL well vs 3D (cells+MG) in PDL(SC+well) P < 0.001 3D - cells in MG vs 3D - (cells+MG) in SC P < 0.001 3D - cells in MG vs 3D (cells+MG) in PDL(SC+well) P < 0.001 3D - (cells+MG) in SC vs 3D (cells+MG) in PDL(SC+well) P > 0.05 RESULTS SHOW THE FOLLOWING: I. In situ reads can be done. II. 3D cell cultures in the SeedEZ had the highest metabolic activity, higher than cells in a 2D culture and higher than Matrigel 3D cell cultures without the SeedEZ. Note: Neurons were considered post-mitotic. Under conditions studied, they generally grow better in a gel. Under conditions studied, it was expected that astrocyte differentiation and proliferation would be higher in a planar rigid well. Cytoskeletal organization, cell-substrate adhesion, traction force and mechanotransduction are different for a spread cell on a planar rigid substrate and a round cell embedded in a tissue-soft gel. IN SeedEZ CELLS ARE ROUND AS IN VIVO IN SeedEZ CELLS MAKE PHYSIOLOGICALLY CLOSER CELL-CELL AND CELL-ECM CONTACTS WITH SeedEZ, 3D CELL CULTURES BECOME CONSISTENT CULTURES IN HIGH THROUGHPUT IN SeedEZ, CULTURES CANNOT BE ACCIDENTALLY ASPIRATED OR DETACHED SeedEZTM consistent 3D cultures SeedEZTM In situ Plate Reads| 29