Portfolio perspectives greatest_lesson_part3_0913
•
1 recomendación•575 vistas

Part 3 of a 3 part series that discusses 6 lessons from the Great Recession.

Recomendados
Más contenido relacionado
La actualidad más candente
La actualidad más candente (20)
Destacado
Destacado (10)
Similar a Portfolio perspectives greatest_lesson_part3_0913
Similar a Portfolio perspectives greatest_lesson_part3_0913 (20)
Más de Better Financial Education
Más de Better Financial Education (20)
Último
Último (20)
Portfolio perspectives greatest_lesson_part3_0913
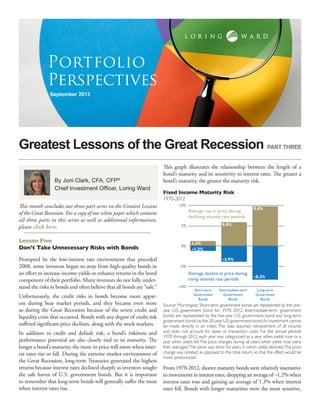
- 1. Greatest Lessons of the Great Recession September 2013 Portfolio Perspectives By Joni Clark, CFA, CFP® Chief Investment Officer, Loring Ward This month concludes our three-part series on the Greatest Lessons of the Great Recession. For a copy of our white paper which contains all three parts in this series as well as additional information, please click here. Lesson Five Don’t Take Unnecessary Risks with Bonds Prompted by the low-interest rate environment that preceded 2008, some investors began to stray from high-quality bonds in an effort to increase income yields or enhance returns in the bond component of their portfolio. Many investors do not fully under- stand the risks in bonds and often believe that all bonds are “safe.” Unfortunately, the credit risks in bonds become more appar- ent during bear market periods, and they became even more so during the Great Recession because of the severe credit and liquidity crisis that occurred. Bonds with any degree of credit risk suffered significant price declines, along with the stock markets. In addition to credit and default risk, a bond’s riskiness and performance potential are also closely tied to its maturity. The longer a bond’s maturity, the more its price will move when inter- est rates rise or fall. During the extreme market environment of the Great Recession, long-term Treasuries generated the highest returns because interest rates declined sharply as investors sought the safe haven of U.S. government bonds. But it is important to remember that long-term bonds will generally suffer the most when interest rates rise. This graph illustrates the relationship between the length of a bond’s maturity and its sensitivity to interest rates. The greater a bond’s maturity, the greater the maturity risk. Fixed Income Maturity Risk 1970-2012 Source: Morningstar. Short-term government bonds are represented by the one- year U.S. government bond for 1970–2012. Intermediate-term government bonds are represented by the five-year U.S. government bond and long-term government bonds by the 20-year U.S.government bond.An investment cannot be made directly in an index. The data assumes reinvestment of all income and does not account for taxes or transaction costs. For the annual periods 1970 through 2012, each year was categorized as a year when yields rose or a year when yields fell.The price changes during all years when yields rose were then averaged.The same was done for years in which yields declined.The price change was isolated,as opposed to the total return,so that the effect would be more pronounced. From 1970-2012, shorter maturity bonds were relatively insensitive to movements in interest rates, dropping an average of –1.2% when interest rates rose and gaining an average of 1.3% when interest rates fell. Bonds with longer maturities were the most sensitive, PART THREE 1.3% 5.9% -3.9% 9.8% -8.3% -1.2% 10% 5% 0% -5% -10% Average decline in price during rising interest rate periods Average rise in price during declining interest rate periods Short-term Government Bonds Intermediate-term Government Bonds Long-term Government Bonds
- 2. Portfolio Perspectives dropping an average of –8.3% when interest rates rose and gaining an average of 9.8% when interest rates fell. We believe the primary role of bonds in a long-term portfolio is to reduce the portfolio’s overall volatility. That is why we rec- ommend high-quality, short-term bonds. We believe that other bonds do not offer an attractive risk reward profile over longer periods of time. Bonds and fixed income funds will decrease in value as interest rates rise. Lesson Six Rebalance Your Portfolio Regularly Rebalancing should be a part of any investor’s long-term portfolio; it helps ensure that your portfolio remains aligned with your goals and risk tolerance. Because of the movements in markets, portfolios tend to change or “drift” over time and move away from their original asset allocation — unless they are rebalanced. Asset classes associated with high degrees of risk tend to have higher rates of return than less volatile asset classes. For this reason, a portfolio that is not rebalanced periodically may become more volatile (riskier) over time. So rebalancing may help to minimize the losses from bear markets. Please note, there may be tax consequences associated with rebalancing a portfolio. Importance of Rebalancing 1992-2012 Source:Morningstar.Small stocks are represented by the Ibbotson® Small Com- pany Stock Index. Large stocks are represented by the Standard & Poor’s 500® index, which is an unmanaged group of securities and considered to be repre- sentative of the U.S. stock market in general. Intermediate-term government bonds are represented by the five-year U.S. government bond.An investment cannot be made directly in an index.The data assumes reinvestment of income and does not account for taxes or transaction costs.©2013 Morningstar,Inc.All rights reserved. This chart illustrates the effect of different growth rates on a static (unbalanced) portfolio over a 20-year period. At year-end 1992, the target asset mix began with a 50% allocation to stocks and a 50% allocation to bonds. The proportion of stocks in the portfolio grew from 1992 to 1997, when it accounted for 64% of the portfolio. Subsequent market fluctuations caused the stock allocation to drop to 57% by 2002, rise again to 69% in 2007, and drop again to 67% in 2012. This allocation is drastically different from the 50/50 portfolio the investor started out with. Losses on the more aggressive asset mix would have been even more severe than on the original portfolio allocation. Rebalancing will not benefit your portfolio every time or in every market environment, but diligent rebalancing on a set schedule can help keep emotions out of the process. For most people, it may make only a marginal difference. But unless you’re really good or really lucky at calling turning points in the business cycle, then it is probably the best you can do. However, it will help ensure that your portfolio stays close to your stated risk tolerance so that you aren’t taking less, or more, risk than you are comfortable with. Past performance does not guarantee future results and the principal value of an investment will fluctuate so that an investor’s shares,when redeemed,may be worth more or less than their original cost.Stock investing involves risks,including increased volatility (up and down movement in the value of your assets) and loss of principal. Fixed income securities are subject to interest rate risk because the prices of fixed income securities tend to move in the opposite direction of interest rates.In general,fixed income securities with longer maturities are more sensitive to these price changes and may experience greater fluctuation in returns.80% 60% 40% 20% 0% Stock Allocation Bond Allocation 50% 50% 36% 64% 43% 57% 31% 69% 67% 33% 1997Year End 1992 2002 2007 2012 © 2013 LWI Financial Inc.All rights reserved. LWI Financial Inc. (“Loring Ward”) is an investment adviser registered with the Securities and Exchange Commission. Securities transactions are offered through its affiliate, Loring Ward Securities Inc., member FINRA/SIPC. R 13-293 (Exp 8/15)