
Recommended
More Related Content
What's hot
What's hot (20)
Viewers also liked
Viewers also liked (20)
Similar to Forsale
Similar to Forsale (12)
More from Linda Twining
More from Linda Twining (20)
Forsale
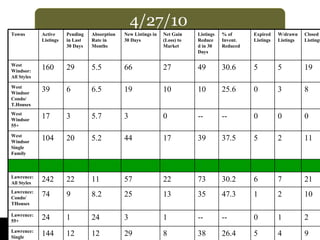
- 1. 4/27/10 Towns Active Listings Pending in Last 30 Days Absorption Rate in Months New Listings in 30 Days Net Gain (Loss) to Market Listings Reduced in 30 Days % of Invent. Reduced Expired Listings W/drawn Listings Closed Listings West Windsor: All Styles 160 29 5.5 66 27 49 30.6 5 5 19 West Windsor Condo/ T.Houses 39 6 6.5 19 10 10 25.6 0 3 8 West Windsor 55+ 17 3 5.7 3 0 -- -- 0 0 0 West Windsor Single Family 104 20 5.2 44 17 39 37.5 5 2 11 Lawrence: All Styles 242 22 11 57 22 73 30.2 6 7 21 Lawrence: Condo/ THouses 74 9 8.2 25 13 35 47.3 1 2 10 Lawrence: 55+ 24 1 24 3 1 -- -- 0 1 2 Lawrence: Single Family 144 12 12 29 8 38 26.4 5 4 9
- 2. 4/27/10 Towns Active Listings Pending in Last 30 Days Absorption Rate in Months New Listings in 30 Days Net Gain (Loss) to Market Listings Reduced in 30 Days % of Invent. Reduced Expired Listings W/drawn Listings Closed Listings PlainsboroAll Styles 77 19 4 33 7 12 15% 7 0 10 Plainsboro Condo/ THouses 40 10 4 17 2 8 20% 5 0 8 Plainsboro 55+ 11 0 11 7 6 1 9% 1 0 0 Plainsboro Single Family 26 9 2.8 9 -1 3 11% 1 0 2 Cranbury: All Styles 29 0 99 9 7 6 20% 2 0 0 Cranbury: 55+ 1 0 99 1 1 -- -- 0 0 0 Cranbury: Single Family 28 0 99 8 6 6 21% 2 0 0
- 3. 4/27/10 Towns Active Listings Pending in Last 30 Days Absorption Rate in Months New Listings in 30 Days Net Gain (Loss) to Market Listings Reduced in 30 Days % of Invent. Reduced Expired Listings W/drawn Listings Closed Listings Ewing: All Styles 258 21 12.3 74 30 65 25.2% 16 7 21 Ewing : Condo/ T.Houses 43 3 14.3 13 7 9 20.9% 1 2 4 Ewing 55+: 6 0 99 1 1 -- -- 0 0 0 Ewing: Single Family 209 18 116 60 22 56 26.8% 15 5 17 East Windsor: All Styles 195 10 19.5 41 22 40 20.5% 5 4 17 East Windsor: Condo/ THouses 107 5 21.4 27 17 21 19.6% 2 3 10 East Windsor: 55+ 22 0 99 2 2 -- -- 0 0 0 East Windsor: Single Family 66 5 13.2 12 3 19 28.8% 3 1 7
- 4. 4/27/10 Towns Active Listings Pending in Last 30 Days Absorption Rate in Months New Listings in 30 Days Net Gain (Loss) to Market Listings Reduced in 30 Days % of Invent. Reduced Expired Listings W/drawn Listings Closed Listings Hopewell Twp. All Styles 183 30 6 59 29 39 21% 7 12 11 Hopewell Twp. Condo/ T.Houses 19 9 2 15 6 8 42% 1 2 1 Hopewell Twp.: 55+ 9 1 9 Hopewell Twp Single Family 155 20 8 44 24 31 20% 6 10 10 Hamilton: All Styles 606 96 6 159 63 183 30% 30 14 57 Hamilton: Condo/ THouses 124 20 6 39 19 49 40% 5 3 21 Hamilton: Single Family 441 72 6 120 48 134 30% 25 11 36 Hamilton: 55+ 40 4 10
- 5. 4/27/10 Towns Active Listings Pending in Last 30 Days Absorption Rate in Months New Listings in 30 Days Net Gain (Loss) to Market Listings Reduced in 30 Days % of Invent. Reduced Expired Listings W/drawn Listings Closed Listings Robbinsville All Styles 133 24 6 47 23 42 32% 6 5 6 Robbinsville Condo/ T.Houses 68 17 4 24 7 24 35% 1 3 5 Single Family 65 7 9 23 16 18 28% 5 2 1 Hightstown Boro: All Styles 75 1 75 13 12 20 27% 4 5 2 Pennington 27 4 7 11 7 4 15% 0 2 5 Hopewell Boro 22 2 11 6 4 6 27% 1 0 3
- 6. 4/27/10 Towns Active Listings Pending in Last 30 Days Absorption Rate in Months New Listings in 30 Days Net Gain (Loss) to Market Listings Reduced in 30 Days % of Invent. Reduced Expired Listings W/drawn Listings Closed Listings Princeton Boro: All Styles 55 3 18.3 18 15 8 14.5 0 0 4 Pton -Boro Condo/ Thouses 22 1 22 7 6 3 13.6 0 0 1 Pton-Boro Single Family 33 2 16.5 1 9 5 15.6 0 0 3 Pton Twp: All Styles 135 9 15 35 21 29 21.5 0 5 8 Pton Twp: Condo/ Thouses 14 3 4.7 2 -2 2 14.3 0 1 3 Pton Twp: Single Family 121 6 20.2 33 23 27 22.3 0 4 5
- 7. 4/27/10 Towns Active Listings Pending in Last 30 Days Absorption Rate in Months New Listings in 30 Days Net Gain (Loss) to Market Listings Reduced in 30 Days % of Invent. Reduced Expired Listings W/drawn Listings Closed Listings South Brunswick All Styles 216 21 11 69 48 47 21% 15 2 29 South BrunswickCondo/ T.Houses 67 11 76 31 20 17 6% 7 0 13 South Brunswick 55+ 27 0 27 3 3 2 2% 4 1 6 South Brunswick Single Family 122 10 12 32 22 27 22% 5 1 10 Monroe: All Styles 441 33 13 109 76 63 14% 32 5 48 Monroe: 55+ 262 23 12 71 48 32 12% 13 2 36 Monroe: Single Family 179 10 17 38 2 31 17% 19 3 12
- 8. 4/27/10 Towns Active Listings Pending in Last 30 Days Absorption Rate in Months New Listings in 30 Days Net Gain (Loss) to Market Listings Reduced in 30 Days % of Invent. Reduced Expired Listings W/drawn Listings Closed Listings Montgomery All Styles 158 19 8.3 60 38 39 25% 5 5 12 Montgomery Condo/Twnhms 27 4 6.7 16 9 6 22% 1 3 3 Single Family 131 15 8.7 44 28 33 25% 4 2 9 Hillsborough All Styles 228 41 5.5 71 30 57 25% 9 6 26 Hillsborough Condo/Twnhms 93 13 7.1 36 20 17 18% 2 1 13 Hillsborough Single Family 135 28 4.8 35 10 40 29% 7 5 13
Editor's Notes
- Populate this table to show the local absorption rate in the various price ranges that are appropriate for your market area. Please add or delete rows as necessary to adequately reflect local conditions.
- Populate this table to show the local absorption rate in the various price ranges that are appropriate for your market area. Please add or delete rows as necessary to adequately reflect local conditions.
- Populate this table to show the local absorption rate in the various price ranges that are appropriate for your market area. Please add or delete rows as necessary to adequately reflect local conditions.
- Populate this table to show the local absorption rate in the various price ranges that are appropriate for your market area. Please add or delete rows as necessary to adequately reflect local conditions.
- Populate this table to show the local absorption rate in the various price ranges that are appropriate for your market area. Please add or delete rows as necessary to adequately reflect local conditions.
- Populate this table to show the local absorption rate in the various price ranges that are appropriate for your market area. Please add or delete rows as necessary to adequately reflect local conditions.
- Populate this table to show the local absorption rate in the various price ranges that are appropriate for your market area. Please add or delete rows as necessary to adequately reflect local conditions.
- Populate this table to show the local absorption rate in the various price ranges that are appropriate for your market area. Please add or delete rows as necessary to adequately reflect local conditions.