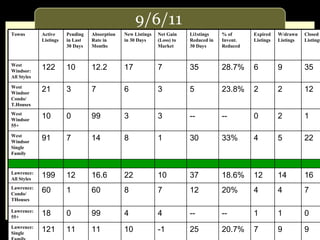
1. 9/6/11 Towns Active Listings Pending in Last 30 Days Absorption Rate in Months New Listings in 30 Days Net Gain (Loss) to Market Li1stings Reduced in 30 Days % of Invent. Reduced Expired Listings W/drawn Listings Closed Listings West Windsor: All Styles 122 10 12.2 17 7 35 28.7% 6 9 35 West Windsor Condo/ T.Houses 21 3 7 6 3 5 23.8% 2 2 12 West Windsor 55+ 10 0 99 3 3 -- -- 0 2 1 West Windsor Single Family 91 7 14 8 1 30 33% 4 5 22 Lawrence: All Styles 199 12 16.6 22 10 37 18.6% 12 14 16 Lawrence: Condo/ THouses 60 1 60 8 7 12 20% 4 4 7 Lawrence: 55+ 18 0 99 4 4 -- -- 1 1 0 Lawrence: Single Family 121 11 11 10 -1 25 20.7% 7 9 9
2. 9/6/11 Towns Active Listings Pending in Last 30 Days Absorption Rate in Months New Listings in 30 Days Net Gain (Loss) to Market Listings Reduced in 30 Days % of Invent. Reduced Expired Listings W/drawn Listings Closed Listings PlainsboroAll Styles 111 7 16 28 21 17 15% 11 0 14 Plainsboro Condo/ THouses 64 3 21.33 19 17 6 9% 8 0 8 Plainsboro 55+ 14 2 7 1 (1) 2 14% 0 0 1 Plainsboro Single Family 33 2 16.5 8 6 9 27% 3 0 5 Cranbury: All Styles 24 1 24 4 3 2 8% 2 0 2
3. 9/6/11 Towns Active Listings Pending in Last 30 Days Absorption Rate in Months New Listings in 30 Days Net Gain (Loss) to Market Listings Reduced in 30 Days % of Invent. Reduced Expired Listings W/drawn Listings Closed Listings Ewing: All Styles 293 13 22.5 33 20 72 25% 18 7 24 Ewing : Condo/ T.Houses 39 3 13 4 1 13 33% 2 1 5 Ewing 55+: 11 0 999 0 0 --- --- 1 0 1 Ewing: Single Family 243 10 24.3 29 19 59 24% 15 6 18 East Windsor: All Styles 236 11 21.5 38 28 47 20% 18 6 21 East Windsor: Condo/ Thouses 139 6 23.2 24 18 28 20% 10 4 10 East Windsor: 55+ 11 0 999 1 1 --- --- 0 0 1 East Windsor: Single Family 86 5 17.2 13 8 19 22% 8 2 10
4. 9/6/11 Towns Active Listings Pending in Last 30 Days Absorption Rate in Months New Listings in 30 Days Net Gain (Loss) to Market Listings Reduced in 30 Days % of Invent. Reduced Expired Listings W/drawn Listings Closed Listings Hopewell Twp. All Styles 175 7 25 24 17 33 19% 9 6 21 Hopewell Twp. Condo/ T.Houses 14 1 14 5 4 5 36% 0 0 5 Hopewell Twp.: 55+ 9 2 4.5 0 -2 -- -- 0 0 0 Hopewell Twp Single Family 152 4 38 19 15 28 18% 9 6 16 Hamilton: All Styles 676 42 16 92 50 148 22% 33 24 49 Hamilton: Condo/ THouses 111 7 16 14 7 29 26% 7 3 8 Hamilton: 55+ 54 6 6 12 6 -- -- 0 0 1 Hamilton: Single Family 511 29 18 66 37 119 23% 26 21 40
5. 9/6/11 Towns Active Listings Pending in Last 30 Days Absorption Rate in Months New Listings in 30 Days Net Gain (Loss) to Market Listings Reduced in 30 Days % of Invent. Reduced Expired Listings W/drawn Listings Closed Listings Robbinsville All Styles Robbinsville Condo/ T.Houses Single Family Hightstown Boro: All Styles Pennington Hopewell Boro
6. 9/6/11 Towns Active Listings Pending in Last 30 Days Absorption Rate in Months New Listings in 30 Days Net Gain (Loss) to Market Listings Reduced in 30 Days % of Invent. Reduced Expired Listings W/drawn Listings Closed Listings Princeton Boro: All Styles 46 3 15.3 8 5 12 26.1% 5 7 6 Pton -Boro Condo/ Thouses 19 1 19 5 4 5 26.3% 1 6 2 Pton-Boro Single Family 27 2 13.5 3 1 7 25.9% 4 1 4 Pton Twp: All Styles 145 6 24.2 6 0 21 14.5% 6 13 20 Pton Twp: Condo/ Thouses 20 2 10 1 -1 7 35% 1 2 0 Pton Twp: Single Family 125 4 31.3 5 1 14 11.2% 5 11 20
7. 9/6/11 Towns Active Listings Pending in Last 30 Days Absorption Rate in Months New Listings in 30 Days Net Gain (Loss) to Market Listings Reduced in 30 Days % of Invent. Reduced Expired Listings W/drawn Listings Closed Listings South Brunswick All Styles 276 7 39.4 43 36 54 19.5 42 2 52 South BrunswickCondo/ T.Houses 87 3 29 16 13 15 17.2 20 1 22 South Brunswick 55+ 32 0 99 3 3 2 6.3 4 0 2 South Brunswick Single Family 157 4 39.25 24 20 37 23.6 18 1 28 Monroe: All Styles 531 26 20.4 88 62 89 16.7 45 13 78 Monroe: 55+ 318 21 15.1 50 29 54 17 26 5 57 Monroe: Single Family 213 5 426 38 33 35 16.4 19 8 21
8. 9/6/11 Towns Active Listings Pending in Last 30 Days Absorption Rate in Months New Listings in 30 Days Net Gain (Loss) to Market Listings Reduced in 30 Days % of Invent. Reduced Expired Listings W/drawn Listings Closed Listings Montgomery All Styles 153 18 8.5 18 0 17 11% 9 13 25 Montgomery Condo/Twnhms 25 4 6.2 3 -1 1 .25% 2 4 6 Single Family 128 14 9.1 15 +1 16 12% 7 9 19 Hillsborough All Styles 295 33 8.9 48 +15 53 18% 25 11 26 Hillsborough Condo/Twnhms 116 12 9.7 18 +6 18 15% 5 6 6 Hillsborough Single Family 179 21 8.5 30 +9 35 19% 20 5 20
Notas del editor
Populate this table to show the local absorption rate in the various price ranges that are appropriate for your market area. Please add or delete rows as necessary to adequately reflect local conditions.
Populate this table to show the local absorption rate in the various price ranges that are appropriate for your market area. Please add or delete rows as necessary to adequately reflect local conditions.
Populate this table to show the local absorption rate in the various price ranges that are appropriate for your market area. Please add or delete rows as necessary to adequately reflect local conditions.
Populate this table to show the local absorption rate in the various price ranges that are appropriate for your market area. Please add or delete rows as necessary to adequately reflect local conditions.
Populate this table to show the local absorption rate in the various price ranges that are appropriate for your market area. Please add or delete rows as necessary to adequately reflect local conditions.
Populate this table to show the local absorption rate in the various price ranges that are appropriate for your market area. Please add or delete rows as necessary to adequately reflect local conditions.
Populate this table to show the local absorption rate in the various price ranges that are appropriate for your market area. Please add or delete rows as necessary to adequately reflect local conditions.
Populate this table to show the local absorption rate in the various price ranges that are appropriate for your market area. Please add or delete rows as necessary to adequately reflect local conditions.