SlideShare una empresa de Scribd logo
1 de 18
MapMap
ScaleScale
Lab ThreeLab Three
Map Scale
• The scale of a map
indicates how much
the Earth has been
reduced for
reproduction on that
map.
• In practical terms, scale is the relationship
between the distance shown on a map
and the actual distance that it represents
on the Earth.
Map Scale
Ways to Indicate Scale
1. Graphic scales
– See figure 1 in lab
manual
2. Fractional scales
– Example 1:24,000
Graphic Scale
There are two common ways to indicate the scale of a map:
Graphic Scales
• The graphic scale of a
map is a bar graph
graduates by
distance.
– Figure one in the lab
manual shows the
graphic map scale
from a U.S. Geological
Survey topographic
map.
• To use a graphic scale, simply measure a
distance on the map (or mark off the
distance on the edge of a piece of paper),
then compare the measured distance to
the bar graph to determine the actual
distance represented.
Graphic Scales
On some graphic scales, “zero” is not at the far left, this
is to make it easier to read fractions.
Graphic Scales
• Graphic scales are useful since they
remain accurate even if the map is
enlarged or reduced.
Graphic Scales
Fractional Scale
• The fractional scale or
the representative
scale expresses the
scale of a map as a
fraction or ratio.
– 1/24,000 or 1:24,000
Fractional Scale: 1/24,000 or
1:24,000
• This scale, which is read “one to twenty-
four thousand”, says that one unit of
measurement on the map represents
24,000 units of measurement on the
Earth.
• At this scale, one centimeter on the map
represents an actual distance of 24,000
centimeters on the Earth, and one inch on
the map equals 24,000 inches on the
map.
– Units of measurement must be the same in
both the numerator and the denominator.
Fractional Scale: 1/24,000 or
1:24,000
Computing Distances with
Fractional Scales
1. Use a ruler to measure the
distance on the map in inches
(or centimeters). This is the
measured distance.
2. Multiply the measured distance
by the map’s fractional scale
denominator. This will give you
the actual distance in inches (or
centimeters).
3. To convert your actual distance
in inches (or centimeters) to
other units, use the following
formulas:
To determine distances represented on a map by
using the fractional scale:
Conversions
• To determine the distance in feet, actual
distance in inches / 12
• To determine the distance in miles, actual
distance in inches / 63,360
• To determine the distance in meters,
actual distance in centimeters / 100
• To determine the distance in kilometers,
actual distance in centimeters / 100,000
English Measurements
• 1 mile = 5280 ft
• 1 mile = 63360 inches
• 1 foot = 12 inches
Metric Measurements
• 1 Kilometer (Km) = 1,000 meters (m)
• 1 Kilometer (Km) = 100,000 cm
• 1 Kilometer (Km) = 1,000,000 mm
• 1 meter = 100 centimeters (cm)
• 1 centimeter = 10 millimeters (mm)
Examples
• If a map has a scale of 1/24,000, a
measured distance of 8.25 inches on the
map represents an actual distance of
198,000 inches
– 8.25 X 24,000 = 198,000 inches
– 198,000 inches / 12 = 16,500 feet
– 198,000 inches / 63,360 = 3.1 miles
Examples
• If a map has a scale of 1/50,000, a
measured distance of 22 centimeters on
the map represents an actual distance of
1,100,000 cm
– 22 cm X 50,000 = 1,100,000 cm
• To calculate the actual distance in meters
and kilometers:
– 1,100,000 cm / 100 = 11,000 meters
– 1,100,000 cm / 100,000 = 11 kilometers
Large Versus Small Scale Maps
• Large scale maps refer to maps with a relatively large
representative fraction such as 1/10,000.
– Large scale maps show a small area of the Earth in great detail.
• Small scale maps refer to maps with a relatively small
representative fraction like 1/1,000,000.
– Small scale maps show large areas in less detail.
Small Scale Medium Scale Large Scale

Más contenido relacionado

La actualidad más candente

Lab three map scale
Lab three map scaleLab three map scale
Lab three map scalelschmidt1170
 
Topographic maps presentation_mine
Topographic maps presentation_mineTopographic maps presentation_mine
Topographic maps presentation_minemisterbatroms
 
Components of Remote Sensing
Components of Remote SensingComponents of Remote Sensing
Components of Remote SensingAbby Varghese
 
The universal transverse mercator system
The universal transverse mercator systemThe universal transverse mercator system
The universal transverse mercator systemMenga Bhaskar
 
Chain survey_Surveying, Civil Engineering
Chain survey_Surveying, Civil EngineeringChain survey_Surveying, Civil Engineering
Chain survey_Surveying, Civil EngineeringA Makwana
 
Scale and distance
Scale and distanceScale and distance
Scale and distanceSteven Heath
 
THE COMMAND AREA DEVELOPMENT PROGRAMME.ppt
THE COMMAND AREA DEVELOPMENT PROGRAMME.pptTHE COMMAND AREA DEVELOPMENT PROGRAMME.ppt
THE COMMAND AREA DEVELOPMENT PROGRAMME.pptpavik13
 
Quantitative techniques in geography
Quantitative techniques in geographyQuantitative techniques in geography
Quantitative techniques in geographyDalbirAntil
 
GIS.INTRODUCTION TO GIS PACKAGES &GEOGRAPHIIC ANALYSIS
GIS.INTRODUCTION TO GIS PACKAGES &GEOGRAPHIIC ANALYSISGIS.INTRODUCTION TO GIS PACKAGES &GEOGRAPHIIC ANALYSIS
GIS.INTRODUCTION TO GIS PACKAGES &GEOGRAPHIIC ANALYSISTessaRaju
 
6. lecture 5 cadastral maps
6. lecture 5 cadastral maps6. lecture 5 cadastral maps
6. lecture 5 cadastral mapsFenTaHun6
 

La actualidad más candente (20)

Map projections
Map projectionsMap projections
Map projections
 
History of cartography
History of cartographyHistory of cartography
History of cartography
 
Lab three map scale
Lab three map scaleLab three map scale
Lab three map scale
 
Topographic maps presentation_mine
Topographic maps presentation_mineTopographic maps presentation_mine
Topographic maps presentation_mine
 
Map symbols
Map symbolsMap symbols
Map symbols
 
Components of Remote Sensing
Components of Remote SensingComponents of Remote Sensing
Components of Remote Sensing
 
Types of maps
Types of maps Types of maps
Types of maps
 
Introduction to Maps
Introduction to MapsIntroduction to Maps
Introduction to Maps
 
The universal transverse mercator system
The universal transverse mercator systemThe universal transverse mercator system
The universal transverse mercator system
 
Chain survey_Surveying, Civil Engineering
Chain survey_Surveying, Civil EngineeringChain survey_Surveying, Civil Engineering
Chain survey_Surveying, Civil Engineering
 
Map Reading
Map ReadingMap Reading
Map Reading
 
Scale and distance
Scale and distanceScale and distance
Scale and distance
 
THE COMMAND AREA DEVELOPMENT PROGRAMME.ppt
THE COMMAND AREA DEVELOPMENT PROGRAMME.pptTHE COMMAND AREA DEVELOPMENT PROGRAMME.ppt
THE COMMAND AREA DEVELOPMENT PROGRAMME.ppt
 
Map algebra
Map algebraMap algebra
Map algebra
 
Contour lines
Contour linesContour lines
Contour lines
 
Quantitative techniques in geography
Quantitative techniques in geographyQuantitative techniques in geography
Quantitative techniques in geography
 
Map reading
Map readingMap reading
Map reading
 
GIS.INTRODUCTION TO GIS PACKAGES &GEOGRAPHIIC ANALYSIS
GIS.INTRODUCTION TO GIS PACKAGES &GEOGRAPHIIC ANALYSISGIS.INTRODUCTION TO GIS PACKAGES &GEOGRAPHIIC ANALYSIS
GIS.INTRODUCTION TO GIS PACKAGES &GEOGRAPHIIC ANALYSIS
 
Bhuvan
BhuvanBhuvan
Bhuvan
 
6. lecture 5 cadastral maps
6. lecture 5 cadastral maps6. lecture 5 cadastral maps
6. lecture 5 cadastral maps
 

Similar a Lab three map scale

Measurement and Scale
Measurement and ScaleMeasurement and Scale
Measurement and ScaleJohn Reiser
 
Latitude, Longitude, And Scale
Latitude, Longitude, And ScaleLatitude, Longitude, And Scale
Latitude, Longitude, And Scaleacavis
 
Scale And Distance
Scale And DistanceScale And Distance
Scale And Distanceigrant
 
INTRODUCTION TO SURVEYING
INTRODUCTION TO SURVEYINGINTRODUCTION TO SURVEYING
INTRODUCTION TO SURVEYINGfarhana saiyed
 
M09U01_ppt_cartograph.ppt
M09U01_ppt_cartograph.pptM09U01_ppt_cartograph.ppt
M09U01_ppt_cartograph.pptRalphNavelino3
 
Mapwork skills.pptx
Mapwork skills.pptxMapwork skills.pptx
Mapwork skills.pptxKarl Mberema
 
map reading unit 1.pdf
map reading unit 1.pdfmap reading unit 1.pdf
map reading unit 1.pdfwarkisafile1
 
Digital image & linear stretching
Digital image & linear stretchingDigital image & linear stretching
Digital image & linear stretchingKamlesh Kumar
 
Cartography lec #4
Cartography lec #4Cartography lec #4
Cartography lec #4Nazir Ahmed
 
geographic techniques.ppt
geographic techniques.pptgeographic techniques.ppt
geographic techniques.pptssuser2350ae
 
Social Science Grade 8 Maps and Globes.pptx
Social Science Grade 8 Maps and Globes.pptxSocial Science Grade 8 Maps and Globes.pptx
Social Science Grade 8 Maps and Globes.pptxAntonHartman
 
SOLAR IMPULSE - LAB WORK - MODELS (ENG)
SOLAR IMPULSE - LAB WORK - MODELS (ENG)SOLAR IMPULSE - LAB WORK - MODELS (ENG)
SOLAR IMPULSE - LAB WORK - MODELS (ENG)Solar Impulse
 
8.Charts
8.Charts8.Charts
8.ChartsAmenBAL
 
Chapter 2 - Topo Map Reading
Chapter 2 - Topo Map ReadingChapter 2 - Topo Map Reading
Chapter 2 - Topo Map ReadingGeographyByTian
 

Similar a Lab three map scale (20)

Measurement and Scale
Measurement and ScaleMeasurement and Scale
Measurement and Scale
 
Latitude, Longitude, And Scale
Latitude, Longitude, And ScaleLatitude, Longitude, And Scale
Latitude, Longitude, And Scale
 
Scale And Distance
Scale And DistanceScale And Distance
Scale And Distance
 
INTRODUCTION TO SURVEYING
INTRODUCTION TO SURVEYINGINTRODUCTION TO SURVEYING
INTRODUCTION TO SURVEYING
 
M09U01_ppt_cartograph.ppt
M09U01_ppt_cartograph.pptM09U01_ppt_cartograph.ppt
M09U01_ppt_cartograph.ppt
 
Mapwork skills.pptx
Mapwork skills.pptxMapwork skills.pptx
Mapwork skills.pptx
 
map reading unit 1.pdf
map reading unit 1.pdfmap reading unit 1.pdf
map reading unit 1.pdf
 
Area_Contour.ppt
Area_Contour.pptArea_Contour.ppt
Area_Contour.ppt
 
Digital image & linear stretching
Digital image & linear stretchingDigital image & linear stretching
Digital image & linear stretching
 
1 Introduction.pptx
1 Introduction.pptx1 Introduction.pptx
1 Introduction.pptx
 
Cartography lec #4
Cartography lec #4Cartography lec #4
Cartography lec #4
 
geographic techniques.ppt
geographic techniques.pptgeographic techniques.ppt
geographic techniques.ppt
 
Social Science Grade 8 Maps and Globes.pptx
Social Science Grade 8 Maps and Globes.pptxSocial Science Grade 8 Maps and Globes.pptx
Social Science Grade 8 Maps and Globes.pptx
 
06. map work
06. map work06. map work
06. map work
 
06. map work
06. map work06. map work
06. map work
 
Class 1_Surveying.pdf
Class 1_Surveying.pdfClass 1_Surveying.pdf
Class 1_Surveying.pdf
 
SOLAR IMPULSE - LAB WORK - MODELS (ENG)
SOLAR IMPULSE - LAB WORK - MODELS (ENG)SOLAR IMPULSE - LAB WORK - MODELS (ENG)
SOLAR IMPULSE - LAB WORK - MODELS (ENG)
 
8.Charts
8.Charts8.Charts
8.Charts
 
Scale and scale factor
Scale and scale factorScale and scale factor
Scale and scale factor
 
Chapter 2 - Topo Map Reading
Chapter 2 - Topo Map ReadingChapter 2 - Topo Map Reading
Chapter 2 - Topo Map Reading
 

Más de Lisa Schmidt

Chapter 1 A World Of Regions
Chapter 1 A World Of RegionsChapter 1 A World Of Regions
Chapter 1 A World Of RegionsLisa Schmidt
 
The giant ancient forest you cannot see coyote crossing
The giant ancient forest you cannot see   coyote crossingThe giant ancient forest you cannot see   coyote crossing
The giant ancient forest you cannot see coyote crossingLisa Schmidt
 
Summer geog lab 2016 schmidt
Summer geog lab 2016 schmidtSummer geog lab 2016 schmidt
Summer geog lab 2016 schmidtLisa Schmidt
 
Summer geog 101 2016 schmidt
Summer geog 101 2016 schmidtSummer geog 101 2016 schmidt
Summer geog 101 2016 schmidtLisa Schmidt
 
Summer 2016 geog 110 schmidt
Summer 2016 geog 110 schmidtSummer 2016 geog 110 schmidt
Summer 2016 geog 110 schmidtLisa Schmidt
 
Daylight saving time may have health costs la times
Daylight saving time may have health costs   la timesDaylight saving time may have health costs   la times
Daylight saving time may have health costs la timesLisa Schmidt
 
Daylight saving time could end in california the sacramento bee
Daylight saving time could end in california   the sacramento beeDaylight saving time could end in california   the sacramento bee
Daylight saving time could end in california the sacramento beeLisa Schmidt
 
Ch 3 worksheet edited
Ch 3 worksheet editedCh 3 worksheet edited
Ch 3 worksheet editedLisa Schmidt
 
Intro spring 2016 geog 101 l
Intro spring 2016 geog 101 lIntro spring 2016 geog 101 l
Intro spring 2016 geog 101 lLisa Schmidt
 
Syllabus geography 102 spring 2016
Syllabus geography 102 spring 2016Syllabus geography 102 spring 2016
Syllabus geography 102 spring 2016Lisa Schmidt
 
Could a great quake strike on the enigmatic san jacinto fault temblor
Could a great quake strike on the enigmatic san jacinto fault    temblorCould a great quake strike on the enigmatic san jacinto fault    temblor
Could a great quake strike on the enigmatic san jacinto fault temblorLisa Schmidt
 
Introspringonlinegeog110 14 wk
Introspringonlinegeog110 14 wkIntrospringonlinegeog110 14 wk
Introspringonlinegeog110 14 wkLisa Schmidt
 
Spring 2016 syllabus geog 110 sect 71
Spring 2016 syllabus geog 110 sect 71Spring 2016 syllabus geog 110 sect 71
Spring 2016 syllabus geog 110 sect 71Lisa Schmidt
 
Spring geog 101 mon 2016 schmid
Spring geog 101 mon 2016 schmidSpring geog 101 mon 2016 schmid
Spring geog 101 mon 2016 schmidLisa Schmidt
 
Geog lab syllabus wed spring 2016
Geog lab syllabus wed spring 2016Geog lab syllabus wed spring 2016
Geog lab syllabus wed spring 2016Lisa Schmidt
 
Will exxon have to pay for years of misleading the public bill moyers
Will exxon have to pay for years of misleading the public    bill moyersWill exxon have to pay for years of misleading the public    bill moyers
Will exxon have to pay for years of misleading the public bill moyersLisa Schmidt
 
Periodic table's 7th row completed with discovery of four new elements ifl ...
Periodic table's 7th row completed with discovery of four new elements   ifl ...Periodic table's 7th row completed with discovery of four new elements   ifl ...
Periodic table's 7th row completed with discovery of four new elements ifl ...Lisa Schmidt
 

Más de Lisa Schmidt (20)

Chapter 1 A World Of Regions
Chapter 1 A World Of RegionsChapter 1 A World Of Regions
Chapter 1 A World Of Regions
 
Eastern europe
Eastern europeEastern europe
Eastern europe
 
The giant ancient forest you cannot see coyote crossing
The giant ancient forest you cannot see   coyote crossingThe giant ancient forest you cannot see   coyote crossing
The giant ancient forest you cannot see coyote crossing
 
Summer geog lab 2016 schmidt
Summer geog lab 2016 schmidtSummer geog lab 2016 schmidt
Summer geog lab 2016 schmidt
 
Summer geog 101 2016 schmidt
Summer geog 101 2016 schmidtSummer geog 101 2016 schmidt
Summer geog 101 2016 schmidt
 
Summer 2016 geog 110 schmidt
Summer 2016 geog 110 schmidtSummer 2016 geog 110 schmidt
Summer 2016 geog 110 schmidt
 
Daylight saving time may have health costs la times
Daylight saving time may have health costs   la timesDaylight saving time may have health costs   la times
Daylight saving time may have health costs la times
 
Daylight saving time could end in california the sacramento bee
Daylight saving time could end in california   the sacramento beeDaylight saving time could end in california   the sacramento bee
Daylight saving time could end in california the sacramento bee
 
Ch 3 worksheet edited
Ch 3 worksheet editedCh 3 worksheet edited
Ch 3 worksheet edited
 
Intro spring 2016
Intro spring 2016Intro spring 2016
Intro spring 2016
 
Intro spring 2016 geog 101 l
Intro spring 2016 geog 101 lIntro spring 2016 geog 101 l
Intro spring 2016 geog 101 l
 
Syllabus geography 102 spring 2016
Syllabus geography 102 spring 2016Syllabus geography 102 spring 2016
Syllabus geography 102 spring 2016
 
Could a great quake strike on the enigmatic san jacinto fault temblor
Could a great quake strike on the enigmatic san jacinto fault    temblorCould a great quake strike on the enigmatic san jacinto fault    temblor
Could a great quake strike on the enigmatic san jacinto fault temblor
 
Introspringonlinegeog110 14 wk
Introspringonlinegeog110 14 wkIntrospringonlinegeog110 14 wk
Introspringonlinegeog110 14 wk
 
Spring 2016 syllabus geog 110 sect 71
Spring 2016 syllabus geog 110 sect 71Spring 2016 syllabus geog 110 sect 71
Spring 2016 syllabus geog 110 sect 71
 
Spring geog 101 mon 2016 schmid
Spring geog 101 mon 2016 schmidSpring geog 101 mon 2016 schmid
Spring geog 101 mon 2016 schmid
 
Geog lab syllabus wed spring 2016
Geog lab syllabus wed spring 2016Geog lab syllabus wed spring 2016
Geog lab syllabus wed spring 2016
 
Will exxon have to pay for years of misleading the public bill moyers
Will exxon have to pay for years of misleading the public    bill moyersWill exxon have to pay for years of misleading the public    bill moyers
Will exxon have to pay for years of misleading the public bill moyers
 
Periodic table's 7th row completed with discovery of four new elements ifl ...
Periodic table's 7th row completed with discovery of four new elements   ifl ...Periodic table's 7th row completed with discovery of four new elements   ifl ...
Periodic table's 7th row completed with discovery of four new elements ifl ...
 
Geography basics
Geography basicsGeography basics
Geography basics
 

Lab three map scale

  • 2. Map Scale • The scale of a map indicates how much the Earth has been reduced for reproduction on that map.
  • 3. • In practical terms, scale is the relationship between the distance shown on a map and the actual distance that it represents on the Earth. Map Scale
  • 4. Ways to Indicate Scale 1. Graphic scales – See figure 1 in lab manual 2. Fractional scales – Example 1:24,000 Graphic Scale There are two common ways to indicate the scale of a map:
  • 5. Graphic Scales • The graphic scale of a map is a bar graph graduates by distance. – Figure one in the lab manual shows the graphic map scale from a U.S. Geological Survey topographic map.
  • 6. • To use a graphic scale, simply measure a distance on the map (or mark off the distance on the edge of a piece of paper), then compare the measured distance to the bar graph to determine the actual distance represented. Graphic Scales
  • 7. On some graphic scales, “zero” is not at the far left, this is to make it easier to read fractions. Graphic Scales
  • 8. • Graphic scales are useful since they remain accurate even if the map is enlarged or reduced. Graphic Scales
  • 9. Fractional Scale • The fractional scale or the representative scale expresses the scale of a map as a fraction or ratio. – 1/24,000 or 1:24,000
  • 10. Fractional Scale: 1/24,000 or 1:24,000 • This scale, which is read “one to twenty- four thousand”, says that one unit of measurement on the map represents 24,000 units of measurement on the Earth.
  • 11. • At this scale, one centimeter on the map represents an actual distance of 24,000 centimeters on the Earth, and one inch on the map equals 24,000 inches on the map. – Units of measurement must be the same in both the numerator and the denominator. Fractional Scale: 1/24,000 or 1:24,000
  • 12. Computing Distances with Fractional Scales 1. Use a ruler to measure the distance on the map in inches (or centimeters). This is the measured distance. 2. Multiply the measured distance by the map’s fractional scale denominator. This will give you the actual distance in inches (or centimeters). 3. To convert your actual distance in inches (or centimeters) to other units, use the following formulas: To determine distances represented on a map by using the fractional scale:
  • 13. Conversions • To determine the distance in feet, actual distance in inches / 12 • To determine the distance in miles, actual distance in inches / 63,360 • To determine the distance in meters, actual distance in centimeters / 100 • To determine the distance in kilometers, actual distance in centimeters / 100,000
  • 14. English Measurements • 1 mile = 5280 ft • 1 mile = 63360 inches • 1 foot = 12 inches
  • 15. Metric Measurements • 1 Kilometer (Km) = 1,000 meters (m) • 1 Kilometer (Km) = 100,000 cm • 1 Kilometer (Km) = 1,000,000 mm • 1 meter = 100 centimeters (cm) • 1 centimeter = 10 millimeters (mm)
  • 16. Examples • If a map has a scale of 1/24,000, a measured distance of 8.25 inches on the map represents an actual distance of 198,000 inches – 8.25 X 24,000 = 198,000 inches – 198,000 inches / 12 = 16,500 feet – 198,000 inches / 63,360 = 3.1 miles
  • 17. Examples • If a map has a scale of 1/50,000, a measured distance of 22 centimeters on the map represents an actual distance of 1,100,000 cm – 22 cm X 50,000 = 1,100,000 cm • To calculate the actual distance in meters and kilometers: – 1,100,000 cm / 100 = 11,000 meters – 1,100,000 cm / 100,000 = 11 kilometers
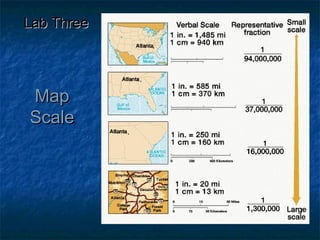
  • 18. Large Versus Small Scale Maps • Large scale maps refer to maps with a relatively large representative fraction such as 1/10,000. – Large scale maps show a small area of the Earth in great detail. • Small scale maps refer to maps with a relatively small representative fraction like 1/1,000,000. – Small scale maps show large areas in less detail. Small Scale Medium Scale Large Scale