LiveAction QoS Monitor Datasheet - Effortless quality of service (QoS) monitoring for live networks
•
1 recomendación•353 vistas

LiveAction QoS Monitor provides quality of service (QoS) monitoring and troubleshooting for Cisco routers and switches.

Recomendados
Recomendados
Más contenido relacionado
Último
Último (20)
Destacado
Destacado (20)
LiveAction QoS Monitor Datasheet - Effortless quality of service (QoS) monitoring for live networks
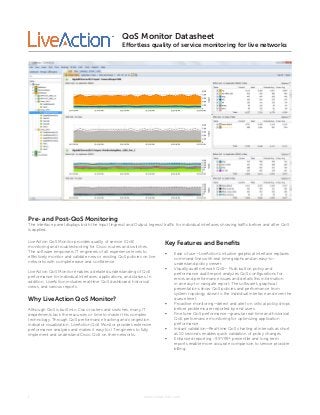
- 1. www.liveaction.com1 QoS Monitor Datasheet Effortless quality of service monitoring for live networks Pre- and Post-QoS Monitoring The interface panel displays both the Input (ingress) and Output (egress) traffic for individual interfaces showing traffic before and after QoS is applied. LiveAction QoS Monitor provides quality of service (QoS) monitoring and troubleshooting for Cisco routers and switches. The software empowers IT engineers of all experience levels to effectively monitor and validate new or existing QoS policies on live networks with complete ease and confidence. LiveAction QoS Monitor enables a detailed understanding of QoS performance for individual interfaces, applications, and classes. In addition, LiveAction includes real-time QoS dashboard, historical views, and various reports. Why LiveAction QoS Monitor? Although QoS is built into Cisco routers and switches, many IT departments lack the resources or time to master this complex technology. Through QoS performance tracking and congestion indicator visualization, LiveAction QoS Monitor provides extensive performance analyses and makes it easy for IT engineers to fully implement and understand Cisco QoS on their networks. Key Features and Benefits • Ease of use—LiveAction’s intuitive graphical interface replaces command lines with real time graphs and an easy-to- understand policy viewer. • Visually audit network QoS— Push button policy and performance audit report analyzes QoS configurations for errors and performance issues and details this information in an easy-to- navigate report. The software’s graphical presentations show QoS policies and performance from system topology down to the individual interface and even the queue level. • Proactive monitoring—detect and alert on critical policy drops before problems are reported by end users. • Fine tune QoS performance—granular real-time and historical QoS performance monitoring for optimizing application performance. • Instant validation—Real-time QoS charting at intervals as short as 10 seconds enables quick validation of policy changes. • Enhanced reporting - 95th /99th percentile and long term reports enable more accurate comparison to service provider billing.
- 2. www.liveaction.com2 Features and Specifications QoS Monitoring • Rate-based NBAR graphs • Pre- and post-QoS graphs • Hardware QoS stats and information • Peak and average rate statistics • Class and interface drop graphs • Congestion indicators across network topology • Built in CBQoS MIB viewer • Detailed graphical policy viewer (displays settings for classification, marking, queueing, policing, shaping, compression and WRED) • Custom NBAR definitions • Hierarchical policy graphs • NBAR unknown port debugging • GRE tunnel visualization • Automatic QoS graph resync on policy changes • Layer 2 QoS monitoring support for Catalyst 6500 and • 7600 • Nexus 7K monitoring Additional Reporting • Historical views and reporting • Very detailed graphs of CBQoS statistics • 24-hr, 48-hr, and snapshot HTML reports • Visual, audible, and email alerts on interface and class drops • QoS scheduler, email notification of report • Performance analysis based thresholds • True end-to-end workflow with alerts, visualization, analysis, and control • NBAR2 MIB graphs • 95th /99th percentile and long term reports Troubleshooting • Push-button policy and performance audit report • Unknown port discovery • View QoS graphs across routers • Topology-based QoS state • Graphically view and understand policies deployed across the network • Drill down from alerts to applicable flows • QoS policy viewer, CLI preview • Instant validation of QoS policy changes Devices Supported Cisco Series Routers • 800, 1700, 1800, 1900, 2600, 2600XM, 2800, 2900, 3600, 3700, 3800, 3900, 4000, 7200, 7600, ASR 1000, CSR 1000V • Recommended IOS versions 12.3 or higher or 15.0 or higher for use with the software. (IOS XE 2.6.0 or higher for ASR 1000 series). Earlier IOS versions may work but are not officially supported. • General release IOS versions are recommended, although early and limited release versions will also work. Cisco Series Switches • Catalyst 2960, 2960-X, 3560, 3650, 3750, 3850, 4500, and 6500 series switches • Nexus 7000 • Some aspects of QoS can be set up on Layer 3-routable interfaces and VLANs (no Layer 2 QoS configuration) • NetFlow can be used with Catalyst 3650, 3850, 6500 and 4500 switches. NetFlow Lite on 2960-X/XR. Please consult Cisco’s feature navigator for specific hardware requirements. Cisco Security Devices • ASA 5500 Series running 8.3 (NetFlow support only) • ASR 1000 Zone-Based Firewall High-Speed Logging Cisco Other • NetFlow Generation Appliance (NGA) Non-Cisco Devices (Flow analysis only) • Alcatel, Extreme, Brocade, Hewlett-Packard, Juniper, NetVanta, nProbe, Gigamon, Ixia System Requirements Client • Windows 7, Windows 8 or Mac OSX 64-bit OS • 4 Cores • 8 GB RAM Server/Node • Windows Server 64 bit 2012, 2008 • Windows 7 64 bit • Linux RHEL/CENTOS 6.4 or 6.5 with GNOME UI installed • For less than 100 devices or less than 100K flows/sec ° 8 Core 2+ GHz CPU ° 8 GB RAM ° 2-6 TB 7,200 RPM HD1 • For 100-500 devices or less than 200K flows/sec ° 12 Core, 2+ GHz CPU ° 16 GB RAM ° 3-10 TB 7,200 RPM HD1 • For 500-1,000 devices ° 2x12 Core, 2+GHz CPU ° 16 GB RAM ° 5-10 TB, 7,200+ RPM HD1 1 Depending on network traffic pattern. For higher performance use RAID 10 or RAID 0 if redundancy is not required QoS Monitor Datasheet
- 3. Large circles indicate devices (routers, switches) Small circles indicate individual interfaces • Dark green color indicates QoS policy is applied to interface • Amber color indicates congestion • LiveAction displays input and output bandwidth for each interface. www.liveaction.com3 Features and Specifications QoS Topology View LiveAction automatically generates a live topology view when you use the system to monitor network devices. It also identifies the interfaces in each of the devices and their network IP connections. LiveAction QoS displays congestion and bandwidth usage from a live system level topology and allows users to drill down to view individual device and interface performance and policies. Contact LiveAction LiveAction 3945 Freedom Circle, Suite 360 Santa Clara, CA 95054 Phone and eFAX: +1 888-881-1116 Email: sales@liveaction.com Web site: www.liveaction.com Copyright © 2014 LiveAction, Inc. All rights reserved. LiveAction, the LiveAction logo and LiveAction Software are trademarks of LiveAction, Inc. Information subject to change without notice. QoS Monitor Datasheet