26 - Tupa et al. 2013. Simple organocatalytic route for the synthesis of starch esters
•
1 recomendación•173 vistas

This document summarizes a study on the organocatalytic synthesis of starch esters. Starch acetates and butyrates were prepared using a solvent-free method with tartaric acid as the catalyst. The degree of substitution was controlled by varying the reaction time and was characterized using FTIR, SEM, TGA and XRD. FTIR showed ester groups on modified starches. SEM showed the granular structure was maintained after modification. TGA showed a reduction in water content and changes in thermal properties with increasing degree of substitution. XRD showed lower crystallinity at higher degrees of substitution.

Recomendados
Recomendados
Más contenido relacionado
La actualidad más candente
La actualidad más candente (20)
Similar a 26 - Tupa et al. 2013. Simple organocatalytic route for the synthesis of starch esters
Similar a 26 - Tupa et al. 2013. Simple organocatalytic route for the synthesis of starch esters (20)
Más de Lorena Maldonado
Más de Lorena Maldonado (7)
26 - Tupa et al. 2013. Simple organocatalytic route for the synthesis of starch esters
- 1. Carbohydrate Polymers 98 (2013) 349–357 Contents lists available at SciVerse ScienceDirect Carbohydrate Polymers journal homepage: www.elsevier.com/locate/carbpol Simple organocatalytic route for the synthesis of starch esters Maribel Tupaa , Lorena Maldonadoa , Analía Vázqueza,b , María L. Forestia,b,∗ a Polymer and Composite Material Group, Technology and Engineer Science Institute (INTECIN), School of Engineering, University of Buenos Aires, Las Heras 2214 (CP 1127AAR), Buenos Aires, Argentina b Consejo Nacional de Investigaciones Científicas y Técnicas (CONICET), Argentina a r t i c l e i n f o Article history: Received 7 March 2013 Received in revised form 28 May 2013 Accepted 29 May 2013 Available online xxx Keywords: Starch Acylation Organocatalysis Characterization a b s t r a c t Starch acetates and starch butyrates with degree of substitution (DS) in the range of 0.06–1.54 were prepared by a simple direct solvent-free organocatalytic methodology of starch acylation. The starch esters synthesized have important applications in the food and pharmaceutical industries, among others. The acylation methodology used involves a non-toxic biobased ␣-hydroxycarboxylic acid as catalyst, and proceeds with high efficiency in absence of solvents. The effect of reaction time on the advance of starch modification was studied as a simple way to control the level of substitution achieved, when all other reaction parameters were kept constant. Starch esters were characterized by means of Fourier transform infrared spectroscopy (FTIR), scanning electron microscopy (SEM), thermogravimetric analysis (TGA) and X-ray diffraction (XRD). FTIR spectroscopy qualitatively confirmed the esterification of starch by the appearance of bands which are associated with esters groups. Scanning electron microscopy showed that the granular structure of the polysaccharide was preserved upon acylation, although acylated granules had rougher surfaces; and wrinkles, grooves and deformed zones appeared in some granules at high DS. Thermogravimetric analysis showed a gradual reduction in the water content of acylated starches, as well as noticeable changes in their thermal properties at increasing DS. X-ray diffraction analysis showed that the acetylation treatment led to lower crystallinity at increasing DS, although characteristic corn starch A-type patterns could be identified even at the highest DS achieved (DS = 1.23). Specific bands and weight losses derived from FTIR and TGA data could be very well correlated with the substitution degree achieved in acetylated starches at DS lower/equal than 0.6. The organocatalytic methodology described for the synthesis of starch acetates and butyrates has the potential to be easily extended to the synthesis of other starch esters using a variety of anhydrides or carboxylic acids as acylating agents © 2013 Elsevier Ltd. All rights reserved. 1. Introduction Starch is a natural, renewable, and biodegradable polymer pro- duced by many plants as a source of stored energy (Le Corre, Bras, & Dufresne, 2010). It is the most important digestible complex carbo- hydrate in human diets and it is the major constituent of many foods (López-Rubio, Clarke, Scherer, Topping, & Gilbert, 2009). Starch is found in plant roots, stalks, crop seeds, and staple crops such as rice, corn, wheat, tapioca, and potato (Buléon, Colonna, Planchot, & Ball, 1998). Starch is commercialized both as native and modified starch. The latter refers to starches that have been chemically mod- ified aiming to give them specific properties. Although native and modified starches have mainly been used in the food sector, there are plenty of non-food uses, such as adhesives for the papermak- ing process and the production of corrugated boards, binders for the pharmaceutical industry, laundering of clothes, as additives to ∗ Corresponding author. Tel.: +54 11 45143010; fax: +54 11 45143010. E-mail address: mforesti@fi.uba.ar (M.L. Foresti). adjust the viscosity of drilling fluids used in petroleum extraction, as substitutes for talcum powder and other beauty, health prod- ucts, etc. Moreover, in the last decades, starch has received much interest for its use as a renewable, abundant and eco-compatible biopolymer source (Mose & Maranga, 2011; Vilpoux & Avérous, 2004). In spite of its abundance, low cost, natural origin, and biodegrad- ability, the hydrophilic nature of starch seriously limits the application of starch-based materials. Native starch has some disadvantages such as poor mechanical properties, hydrophilic character, and low dimensional stability especially in humid envi- ronments. Moreover, the polarity of starch results in high water adsorption. Esterification of starch by replacement of hydroxyl groups with ester groups makes starch more hydrophobic, reduces the water sorption, and it can result in materials with bet- ter tensile property retention in aqueous environment (Cyras, Tolosa Zenklusen, & Vazquez, 2006; Parandoosh & Hudson, 1993). Derivatization of the hydroxyl groups of starch may also reduce its tendency to form strongly hydrogen-bonded networks and increase the flexibility of starch-based films (Shogren, 1996). The 0144-8617/$ – see front matter © 2013 Elsevier Ltd. All rights reserved. http://dx.doi.org/10.1016/j.carbpol.2013.05.094
- 2. 350 M. Tupa et al. / Carbohydrate Polymers 98 (2013) 349–357 uses of esterified starches are multiple, ranging from many appli- cations in the food industry (mainly for starch acetate) such as an additive used as thickener, stabilizer, emulsifier and binder of frozen foods, dry mixes, flavoured toppings and sauces; and also non-food uses such as filler, superdisintegrant and matrix former in capsules and tablet formulations, controlled release applications, hot melt adhesives, cigarette filters, coatings, etc. (Chowdary & Radha, 2011; Phillips, Huijum, Duohai, & Harold, 1999). Also in the field of medicine, starch esters are of much interest, as it is the case of starches acylated with specific short chain fatty acids which may contribute to maintaining human colonic function and preventing colonic disease (López-Rubio et al., 2009). A recent clini- cal trial showed that cooked butyrylated starch delivered esterified butyrate to the human colon effectively, and had the potential to improve human bowel health (Clarke et al., 2011). Acetate and pro- pionate starch esters have also been attracting considerable inter- est for their potential ability to maintain the normal physiological function of the large bowel (Bajka, Topping, Cobiac, & Clarke, 2006). Currently, most commercial starch esters are produced by reac- tion of starch in aqueous medium with anhydrides and NaOH (catalyst) at pH 7–9. Recently, Luo and Shi (2012) studied the preparation of acetylated waxy, normal, and high-amylose maize starches in aqueous solution with 20% (w/w) sodium hydroxide as a catalyst, and compared the properties of three acetylated maize starches by use of SEM, XRD, Differential Scanning Calorimetry (DSC) and pasting properties. Methodologies based in esterifica- tions catalyzed by pyridine are also well-known, although the required pre-treatment of starch and the cost and manipulation difficulties of the catalyst, has limited the commercial develop- ment of this technology (Xu, Miladinov, & Hanna, 2004). Other systems catalyzed by mineral acids, bases, iodine, enzymes and strong Lewis acid catalysts have also been studied (Shogren, 2008). Acylation of starch in ionic liquids has also been reported (Luo & Zhou, 2012; Shogren & Biswas, 2010). In the current manuscript, acylation of corn starch with a selected anhydride (acetic anhy- dride), and a carboxylic acid (butyric acid), were performed by use of a solvent-free operationally simple and environmentally benign methodology. Derivatization of starch was accomplished by use of an organic-acid-catalyzed heterogeneous route inspired in a recent work on cellulose derivatization (Hafrén & Córdova, 2005). The methodology relays on the use of a non-toxic green catalyst such as tartaric acid, and the esterification is performed in absence of sol- vents at moderate reaction conditions. The possibilities that some naturally occurring ␣-hydroxycarboxylic acids such as tartaric acid may provide as organocatalysts for ring-opening polymerizations and esterification of polysaccharides such as cellulose in bulk condi- tions, have recently been reviewed by Domínguez de María (2010). The starch esters obtained with different substitution degrees were characterized by means of FTIR, SEM, TGA and XRD in order to study the effect of organocatalytic esterification on particular properties of the esters obtained. 2. Materials and methods 2.1. Materials Commercial native corn starch was kindly donated by Ingre- dion (Argentina). Acetic anhydride (97%) was bought from BioPack (Argentina), whereas butyric acid (≥99%) was bought from Sigma Aldrich (Argentina). Hydrochloric acid (36.5–38%) and sodium hydroxide were reagent grade chemicals purchased from Ane- dra and BioPack, respectively. Potassium hydrogen phthalate and sodium carbonate were bought from Laboratorios Cicarelli and Mallinckrodt, respectively. L (+) tartaric acid was bought from Biopack. 2.2. Organocatalytic esterification Acetic anhydride (25 mL), tartaric acid (3.7 g) and previously dried (40 ◦C, 24 h) corn starch (2 g) were mixed in an oven-dried 100 mL glass flask equipped with a magnetic stir bar, and a reflux condenser to prevent the loss of the anhydride. The mixture was heated to 120 ◦C under continuous agitation in a thermostatized oil bath. When the mixture achieved the target temperature, all tartaric acid dissolved and this was considered as the beginning of reaction. Esterification was run for different reaction times (0.5, 1, 3, 5 and 7 h), in order to inspect the reaction kinetics within this period. After the chosen reaction time, the mixture was allowed to cool down to room temperature, and the solid product was separated by vacuum filtration in a Buchner fun- nel. Several washings of the solid recovered with distilled water were performed in order to guarantee the removal of the cata- lyst and the unreacted acid. The solid was finally dried at 40–50 ◦C overnight. Esterification of corn starch by use of butyric acid was performed in a lower scale in oven-dried 20 mL glass vials sealed with screw caps. Butyric acid (5 mL), tartaric acid (0.74 g), and oven-dried corn starch (0.4 g), were mixed and heated to 120 ◦C in a thermostatized oil bath with constant magnetic stirring. Reaction was alternatively run for 1, 2.5, 5 and 7 h. Recovery operations were performed as described for organocatalytic acetylation. In all cases special care was taken in order to guarantee that the distilled water washings were not performed until the solid product had sufficiently lowered its temperature, in order to avoid partial gelatinization of the starch esters recovered. Controls without tartaric acid were performed under identical conditions aiming to evaluate the evolution of the uncatalyzed reactions. 2.3. Determination of acyl content and substitution degree Acyl content and substitution degree (DS) were determined by heterogeneous saponification and back titration with HCl. Briefly, approximately 0.11 g of each of the esterified starches were grinded, dried at 105 ◦C for 2 h, and left to cool down in a desic- cator. Dried samples were carefully weighted and transferred to 100 mL erlenmeyers to which 20 mL of ethyl alcohol (75%) was added. Flasks were heated loosely stoppered for 30 min at 50 ◦C. Afterwards, the suspensions were brought to slightly basic pH by addition of a few drops of 0.1 N NaOH using phenolphthalein as indicator. 20 mL of 0.1 N NaOH were then added to each flask, and heated again at 50 ◦C for 15 min. Erlenmeyers were finally allowed to stand tightly stoppered at room temperature for 48 h. At the end of this time, the excess NaOH present in the flasks was back titrated with 0.1 N HCl, using phenolphthalein as the end-point indicator. A blank determination (native corn starch) was carried through the complete procedure. NaOH and HCl solutions were standarized using previously dried standard potassium hydrogen phthalate and sodium carbonate, respectively. The acyl content was calculated by: Acyl (%) = (VB − VS) × NHCl × Macyl × 10−3 × 100 W (1) where VB (mL) is the volume of HCl required for titration of the blank; VS (mL) is the volume of HCl required to titrate the sample; NHCl is the normality of the HCl solution; Macyl is the molecular weight of the acyl group (43 for acetyl and 71 for butyryl), and W (g) is the mass of sample used. The DS of an acylated starch is defined as the number of hydroxyl (OH) groups substituted per anhydroglucose unit of the starch polymer. Since the anhydroglucose unit possesses three reactive
- 3. M. Tupa et al. / Carbohydrate Polymers 98 (2013) 349–357 351 hydroxyl groups, the maximum DS value is 3. The substitution degree of acylated starches was calculated by: DS = 162 × Acyl%) Macyl × 100 − ((Macyl − 1) × Acyl%) (2) where 162 is the molecular weight of the anhydroglucose units. 2.4. Characterization of starch esters Fourier transform infrared spectra of esterified starches were acquired on a IR Affinity-1 Shimadzu Fourier Transform Infrared Spectrophotometer in transmission mode. Carefully dried (105 ◦C, 1 h) powdered samples of native and acylated starches were mixed with KBr in the ratio 1:20, and spectra were collected with 40 scans in the range of 4000–700 cm−1 with a resolution of 4 cm−1. Drops of acylated starches/water suspensions were deposited on microscope glasses and dried at 40 ◦C for 15 min. Samples were then coated with gold using an ion sputter coater, and observed at a magnification range of 5K× and 10K× by use of a scanning electron microscope Zeiss Supra 40 with field emission gun operated at 3 kV. Thermogravimetric analysis of dried samples (8–9.5 mg, pre- viously dried at 105 ◦C during 1 h) was conducted in a TGA-50 Shimadzu instrument. Temperature programmes were run from 25 ◦C to 650 ◦C at a heating rate of 10 ◦C/min, under nitro- gen atmosphere (30 mL/min) in order to prevent thermoxidative degradation. Deconvolution of DTG peaks (first derivative of ther- mogravimetric signals) was performed by use of the PeakFit 4.12 software, using Lorentzian area functions to deconvolve overlapped peaks. The structure of dried samples (105 ◦C, 1 h) of native and acety- lated starches was analyzed with a D/Max-C Rigaku automated wide-angle powder X-ray diffractometer. The X-ray diffraction pat- tern was recorded in a 2Â angle range of 10–45◦ with a step of 0.02◦ and at a rate of 0.6◦/min. The wavelength of the Cu/Ka radi- ation source used was 0.154 nm, generated at accelerating voltage of 40 kV and a filament emission of 30 mA. 3. Results and discussion 3.1. Evolution of organocatalytic acylation Fig. 1a illustrates the evolution as a function of time of the acyl content and the substitution degree of acetylated starch. As it is shown, under the conditions chosen acetylation increased with reaction time during all the sampling period assayed, achieving a DS of 1.23 in 7 h of reaction. Most applications of acetylated starch are found in the food industry. Starch acetate with DS 0.01–0.2 is approved by the FDA (Food and Drug Administration) for food use to improve binding, thickening, stability and texturizing (de Graaf, Broekroelofs, & Janssen, 1998). For this particular uses, the organocatalytic route could provide the target product in 0.5 h. Fig. 1b shows the evolution of the esterification of starch with a carboxylic acid such as butyric acid as acylating agent. In this case, the reaction rate was higher, and in 2.5 h of reaction a substitution degree of 1.45 was achieved. Further increments in reaction time led only to marginal increments in starch substitution, reaching a DS of 1.54 after 7 h of esterification. According to the literature, to produce resistant starch with a DS which will deliver signifi- cant quantities of SCFA, starch needs to be acylated at a level of DS between 0.2 and 0.3 (Bajka, 2007; López-Rubio et al., 2009). The interval of DS required is thus higher than the DS currently used in the food industry, but lower than the one used in the preparation of plastics. Under the current conditions, data included in Fig. 1b suggest that starch butyrates with DS between 0.2 and 0.3 can be obtained in reaction times slightly higher than 1 h. a) b) 0 1 2 3 4 5 6 7 0 5 10 15 20 25 30 35 40 Acyl Acyl(%) time (h) 0,0 0,5 1,0 1,5 2,0 2,5 3,0 1.541.511.45 0.14 40.640.139.1 DS DS 5.7 0 1 2 3 4 5 6 7 0 2 4 6 8 10 12 14 16 18 20 22 24 26 Acyl Acyl(%) time (h) 0,0 0,5 1,0 1,5 2,0 2,5 3,0 1.23 24.8 0.06 1.6 20.7 13.0 7.6 0.98 0.56 DS DS 0.31 Fig. 1. Effect of time on the organocatalytic acylation of corn starch, 120 ◦ C. (a) Organocatalytic acetylation and (b) organocatalytic butyrylation. The reactivity of the three free OH groups of starch to acylation decreases in the following order: primary C(6) OH > secondary C(2) OH > secondary C(3) OH. The secondary hydroxyl groups are located within the interior surface of starch forming hydrogen bonds with the OH groups on the neigh-boring glucose units (Xu et al., 2004). The steric hindrance of the secondary OH results in lower reactivity, and are probably the ones that contribute the least to the increase of DS. Moreover, as the reaction was heterogeneous, it is likely that some anhydroglucose units were not accessible to the acylating agents, and some primary OH remained unacylated as well. As a result, the butyrylation reaction rate significantly decreased after 2.5 h, even if DS was lower than 3.0. 3.2. Fourier transform infrared spectroscopy (FTIR) The FTIR spectra of acetylated and butyrylated starches were obtained for increasing reaction times. Data are shown in Fig. 2a (acetylated starches) and b (butyrylated starches). The infrared spectrum of native starch is also included for comparison. Native starch shows characteristic bands of the polysaccharide including a broad band between 3700 and 3000 cm−1 assigned to the stretching of hydrogen bonded O H groups (Garg & Jana, 2011; Xu et al., 2004), a band in the region of 2800–3000 cm−1 attributed to C H stretch- ing modes (Diop, Li, Xie, & Shi, 2011; Santha, Sudha, Vijaykumari, Nayar, & Moorthy, 1990; Xu et al., 2004), and a band at 1645 cm−1 assignedto theO Hbendingvibrationof watermoleculesadsorbed in the amorphous regions of starch granules (Diop et al., 2011; Kizil, Irudayaraj, & Seetharaman, 2002; Santha et al., 1990). The region
- 4. 352 M. Tupa et al. / Carbohydrate Polymers 98 (2013) 349–357 a) b) 4000 3600 3200 2800 2400 2000 1600 1200 800 7 h - DS=1.23 0.5 h - DS=0.06 native starch 5 h - DS=0.98 3 h - DS=0.56 Absorbance Wavenumber (cm -1 ) 1 h - DS=0.31 3395 2934 1645 1244 1158 923 857 763 1748 1376 4000 3600 3200 2800 2400 2000 1600 1200 800 native starch Absorbance Wavenumber (cm -1 ) 7 h - DS=1.54 5 h - DS=1.51 2.5 h - DS=1.45 1 h - DS=0.14 3461 2928 1645 1158 923 857 763 1748 Fig. 2. FTIR spectra of acylated starches. (a) Acetylated starches and (b) butyrylated starches. Native starch spectrum is also included for comparison purposes. between 1500 and 1300 cm−1 shows highly overlapped bands, among which vibrations typical of C O H bending, CH2 twisting, CH2 bending and C O O stretch have been described (Cael, Koenig, & Blackwell, 1975; Cyras et al., 2006; Kizil et al., 2002). A small band appears at 1244 cm−1 which has been assigned to CH2OH (side chain) related mode, as well as to the C O H deformation mode (Cael, Koenig, & Blackwell, 1975). Native starch spectrum also shows the presence of bands at 1158, 1084 and 1055 cm−1 which could be assigned to the coupling mode of C O and C C stretch- ing, C O H bending mode, and C O band stretching, respectively (Cael et al., 1975; Garg & Jana, 2011). The absorption bands found in native starch spectrum at low wavenumbers are attributed to skele- tal mode vibrations of the ␣-1,4 glycosidic linkage (923 cm−1), C H and CH2 deformation (857 cm−1), and C C stretching (763 cm−1) (Kizil et al., 2002). Spectra of both acetylated and butyrylated starches provided evidence of esterification by appearance of bands characteristic of ester groups. The most important one is the band found at 1748 cm−1 which is assigned to the stretching of the ester car- bonyl group (C O). As shown in Fig. 2a and b, the intensity of the C O ester bands increased with the measured DS, whereas the broad bands centred at around 3400 cm−1, and assigned to the stretching of hydroxyl groups of starch, gradually decreased 0,0 0,2 0,4 0,6 0,8 1,0 1,2 1,4 0,0 0,1 0,2 0,3 0,4 0,5 0,6 0,7 0,8 I 1748 =0.882 DS +0.020 r 2 =0.9956 I1244 I1748 I1244 ,I1748 (cm -1 ) DS I 1244 =0.566 DS +0.284 r 2 =0.9717 Fig. 3. Correlation between characteristic IR ester bands intensity and DS measured by saponification for acetylated starches. indicating that OH groups were gradually replaced by ester groups. Moreover, acetylated starches also showed a clear increase of the bands centred at 1376 and 1244 cm−1 (Fig. 2a) for increasing DS. It has been reported that the mentioned bands are also related to esterification, and that their intensity increases as a function of DS (López-Rubio et al., 2009). Diop et al. (2011), also observed the increase of the bands centred at 1376 and 1244 cm−1 in acetylated starches with increasing DS, and attributed them to the methyl of the acetyl group. The mentioned bands were less defined in butyrylated starches spectra (Fig. 2b). Spectra of blank samples (uncatalyzed reactions) demonstrated the efficiency of the recov- ery operations designed to remove the unreacted acylating agents, since no band in the region of 1800–1700 cm−1 was observed (data not shown). FTIR spectra of acylated starches have traditionally been used mainly to give qualitative evidence of esterification. However, proper treatment of the IR spectra (i.e. construction of and adequate baseline, normalization with respect to a band that does not change with the target treatment, and comparison with a calibration curve constructed based on data from another reliable DS quantification technique (i.e. saponification)), has the potential to give quan- titative information on esterification based on the intensity of characteristic bands such as the C O band observed at 1748 cm−1. Alternatively, literature suggests that DS of esterified starches may be quantitatively determined by ATR FTIR spectroscopy by use of samples dissolved in ionic liquids. A novel analytic approach to determine the degree of substitution of esterified cellulose fibres dissolved in ionic liquids using ATR FTIR spectroscopy has been reported recently, and its suitability for other molecules and/or polymers as the one used in this contribution has been envisaged (Domínguez de María & Martinsson, 2009). Fig. 3 illustrates the evolution of the intensity of characteristic IR bands found at 1244 and 1748 cm−1 with increasing DS values obtained by saponification of starch acetates. As it is shown, at DS ≤ 0.56 very good linear correlations between the IR band inten- sities and DS were obtained for acetylated starches (r2 = 0.9717 for the intensity of the band centred at 1244 cm−1, and r2 = 0.9956 for the intensity of the band centred at 1748 cm−1). At DS higher than 0.56, the increase in the intensity of characteristic ester IR bands with increasing DS was relatively slower. Similar patterns were found by Ogawa et al. (1999) when they analyzed the FTIR spectra of starch acetate particles with increasing DS using a diffu- sion reflection method (DRIFT). Authors analyzed the evolution of the area of stretching vibrations found in the range of 1715–1750 and 1250–1300 cm−1, and found a biphasic pattern which was
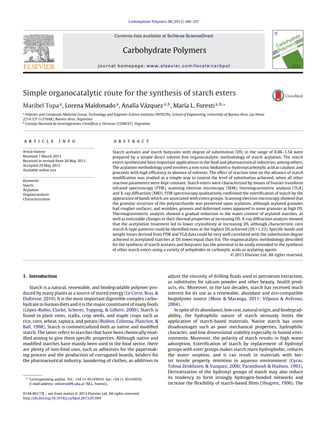
- 5. M. Tupa et al. / Carbohydrate Polymers 98 (2013) 349–357 353 Fig. 4. approximated to two distinct linear correlations, with the first one having the higher slope value (Ogawa et al., 1999). In the case of butyrylated starches, the linear correlation found for acetylated starches at low DS, predicted DS values much higher than the ones measured by saponification for butyrylated starches. On the other hand, at higher DS, the intensities of IR ester bands measured for butyrylated starches belonged to DS values higher than the ones expected for acetylated starches. The previous obser- vations indicate that the use of IR information for estimating DS values requires calibration for the particular ester under study. 3.3. Scanning electron microscopy (SEM) Field emission scanning electron microscopy of starch esters was performed aiming to examine the shape and morphology of the acylated granules. Scanning electron micrographs of native corn granules are shown in Fig. 4a and b for comparison with substituted starches. Fig. 4 also illustrates the evolution of the granules during acetylation (Fig. 4c–j) and butyrylation (Fig. 4k–n). Native corn starch granules (Fig. 4a and b) consisted of poliedric shape particles with diameters in the 2–20 m range. The granules surface was smooth, whereas some small pinholes/pores appeared in a few particles. Pores present in the surface of starch gran- ules have been attributed to natural processes that take place in plant tissue, to processes that occur during mechanical treatment of grains (Niemann & Whistler, 1992), and/or to the action of in situ amylases (Sujka & Jamroz, 2007). It has been proven that the pres- ence of pores, channels and cavities increases the granules surface which is potentially available for chemical and enzymatic reactions (Sujka & Jamroz, 2007). The surface of acetylated starch showed increased roughness with respect to native granules surface, and a higher tendency to form clusters. After the first hour of reaction (Fig. 4c and d, 1 h, DS = 0.31), granules showed a rougher surface and wrinkles appeared on the surface of some particles. The increment of rough- ness of the granules surface upon acylation is a common feature observed for acetylated starches (Singh, Chawla, & Singh, 2004). In reference to granules aggregation, it has been attributed to a fusion of granules caused by some disruption of the surface as a consequence of the chemical modification procedure (Singh, Kaur, & Singh, 2004a). It has been proposed that the increased roughness of granules found after acylation could improve adhesion of starch to synthetic polymers due to increased surface area for bonding and mechanical interlocking (Garg & Jana, 2011). With the advance of acylation, a fraction of granules showed deformation and/or the appearance of grooves and holes (Fig. 4e–j). Deformation of gran- ules has previously been reported for acetylated maize starches with lower DS (López-Rubio et al., 2009). On the other hand, and opposite to what has often been observed for acetylated starches with high DS obtained by the conventional NaOH-catalyzed acety- lation methodology (Garg & Jana, 2011; Xu et al., 2004), SEM images of the acetylated starches obtained herein evidenced no loss of the granular structure of starch. Organocatalytic derivatization of corn starch with butyric acid had a more pronounced effect on the granules morphology than acetylation, even at low DS (Fig. 4k and l). Starch granules gradually lost their initial shape and after 5 h of reaction, a high frac- tion turned into toroidal-shaped particles with increased rugosity Fig. 4. SEM micrographies of native and acylated corn starches. (a and b) native starch; (c and d) acetylated starch, 1 h – DS = 0.31; (e and f) acetylated starch, 3 h – DS = 0.56; (g and h) acetylated starch, 5 h – DS = 0.98; (i and j) acetylated starch, 7 h – DS = 1.23; (k and l) butyrylated starch, 1 h–DS = 0.14; (m and n) butyrylated starch, 5 h – DS = 1.51. Images on the left correspond to 5K×, whereas images on the right correspond to the same samples at 10K×.
- 6. 354 M. Tupa et al. / Carbohydrate Polymers 98 (2013) 349–357 a) b) 0 50 100 150 200 250 300 350 400 450 500 550 600 650 7 h - DS=1.23 5 h - DS=0.98 3 h - DS=0.56 0.5 h - DS=0.06 1 h - DS=0.31 native starch DTG Temperature (ºC) 0 50 100 150 200 250 300 350 400 450 500 550 600 650 7 h - DS = 1.54 5 h - DS = 1.51 2.5 h - DS = 1.45 1 h - DS = 0.14 native starch DTG Temperature (°C) Fig. 5. DTG curves for acylated starches. (a) Acetylated starches; and (b) butyrylated starches. Native starch spectrum is also included for comparison purposes. Baselines of the DTG curves have been moved up. (Fig. 4m and n). Fornal et al. (2012) also observed indented or doughnut-like forms in the granules of commercial food grade acetylated potato starch. Similar shapes have been observed upon hydroxypropylation of potato starch granules. Hydroxypropylated granules evidenced the formation of a deep groove in the central core region along the longitudinal axis, and appeared as folded structures with their outer sides drawn inwards, giving the appear- ance of a doughnut (Kaur, Singh, & Singh, 2004). At low DS, SEM images of butyrylated starches showed partial fusion of the granules which could be due to partial gelatinization of the sample during recovery operations (Fig. 4k and l). Fusion of granules upon acylation has previously been reported for acety- lated corn and potato starches (Singh et al., 2004a, 2004b). 3.4. Thermogravimetric analysis (TGA) Thermogravimetric analysis was performed in order to study the impact of organocatalytic esterification on the thermal properties of starch. Fig. 5 shows the results of thermogravimetric analysis for acetylated starch (Fig. 5a) and butyrylated starch (Fig. 5b) in terms of the first derivative of TG signals (DTG) normalized with respect to the initial sample mass. DTG data has been moved up in the y-axes for clarity purposes. DTG data for native starch is also included for comparison. Thermogravimetric data of native corn starch showed a two stage weight loss. The first one took place from room tempera- ture to 130 ◦C, and it is assigned to starch dehydration. Physically adsorbed and hydrogen bond linked water molecules can be lost at that first stage (Barud et al., 2007). The amount of adsorbed water for native starch is normally in the range of 9–11%. However, previ- ous conditioning of all samples at 105 ◦C during 1 h results in lower initial water content (5.8%). Once dehydrated, corn starch was sta- ble up to 250 ◦C, as also shown by Garg and Jana (2011). The second mass loss was observed from 250 to 450 ◦C, and it is assigned to thermal decomposition of starch. The decomposition of starch is a result of the inter- and intramolecular dehydration reactions of the starch molecules with water as a main product of decomposition (Thiebaud et al., 1997). The temperature of maximum weight loss rate (Tmax) of native starch was found at 323 ◦C as calculated from DTG data. Tmax indicates the point of greatest rate of change on the weight loss curve. In general, esterification of starch has been reported to result in increased thermal stability, which is characterized by single DTG peaks that occur at higher temperatures than the one found for native starch decomposition (Xu et al., 2004). The increase in ther- mal stability of acylated starches (mainly acetylated starches have been studied), has been frequently attributed to the lower num- ber of hydroxyl groups remaining after acylation (Fang, Fowler, Tomkinson, & Hill, 2002; Xu et al., 2004). Moreover, some authors have further explained their results based on the hypothesis that the described OH condensation reaction is slower after the hydroxyl groups are replaced by acyl groups (Xu et al., 2004). On the other hand, TG data from the herein organocatalytic acetylated starches, showed three weight loss stages, which tra- duced into three peaks in DTG data (Fig. 5a). The first stage (25–140 ◦C) corresponds to the release of physically adsorbed and hydrogen bond linked water. Integration of this low tempera- ture peak area showed that the mass of water lost in this first stage decreases with increasing DS (5.82% for native starch, 4.18% for DS = 0.31; 3.17% for DS = 0.56; 2.82 for DS = 0.98); which con- firms the gradual reduction in starch hydrophilicity when hydroxyl groups are progressively replaced by less hydrophilic acetyl groups. The following two overlapped peaks in Fig. 5a correspond to starch acetate decomposition. For acetylated starches, irrespec- tively of their DS, the first decomposition peak had the point of greatest rate of change on the weight loss curve, Tmax, in the range of 305–331 ◦C. The position of the mentioned DTG peak resembles that of native starch, which had its Tmax at 323 ◦C. As such, it can be attributed to the condensation of hydroxyl groups remaining after acylation. In fact, once deconvoluted, the area of the first decomposition peak in acetylated starches decreased with increas- ing DS, which correlates with a decreasing amount of remaining hydroxyl groups. On the other hand, for acetylated starches a second decomposition peak appeared at Tmax in the range of 378–384 ◦C, which was overlapped with the one just described. The same type of two-stage decomposition pattern was found by Elomaa et al. (2004), when they analyzed the DTG curves of ten standard acetylated starch samples with increasing DS. Actually, Elomaa et al. (2004) studied the suitability of a TGA/IR method for the analysis of the degree of substitution of the standard acetylated starch samples, in comparison with saponification and 1H NMR results. Authors demonstrated that the results of DS obtained by saponification/NMR correlated very well with DTG data (percentual coefficients of determination of 97.9–98.1), and even better correlation coefficients were found when the acetic acid evolving from the heated sample was analyzed by IR, by use of a IR gas cell (percentual coefficients of determination of 98.6–98.7) (Elomaa et al., 2004). In the mentioned contribution, the curves of
- 7. M. Tupa et al. / Carbohydrate Polymers 98 (2013) 349–357 355 Acetylated starch, 1h, DS = 0.31 Pk=Lorentz Area 2 Peaks Bg=Linear r^2=0.990953 SE=4.66067e-05 F=18127.1 314.62 378.63 200 250 300 350 400 450 -0.0005 0 0.0005 0.001 0.0015 0.002 0.0025 0 0.0005 0.001 0.0015 0.002 0.0025 Temperature (ºC) A 305-331 ºC A 378-384 ºC Fig. 6. Example of deconvolution of DTG data from starch acetate, 1 h, DS = 0.31. evolving acetic acid were observed at time/temperature intervals at which DTG curves of acetylated starches showed the presence of the second decomposition peak. In fact, authors referred to acetic acid as one of the major degradation products of acetylated starch. Mass spectroscopy of gases evolving from TG analysis of ethylene vinyl acetate, has also indicated that the peak centred at around 380 ◦C in the corresponding DTG thermogram corresponds to acetic acid (The Analysis of Ethylene Vinyl Acetate by TG-MS, Perkin Elmer, http://www.perkinelmer.com/CMSResources/Images/44- 74009ABR EVAbyTG-MS.pdf). From the previous discussion, it can be inferred that the second decomposition peak that appeared at 378–384 ◦C in Fig. 5a, corresponds to evolving acetic acid from starch acetates decomposition. To further analyze the DTG data, deconvolution of the area of the two overlapped decomposition peaks shown in Fig. 5a was per- formed. Different functions were tested for peak deconvolution, and the best results were found for the Lorentzian area function type. Fig. 6 exemplifies the deconvolution of DTG data achieved for starch acetate with DS = 0.31 (1 h). The area of the two decomposition overlapped peaks was taken as 100%, and results of the percentual contribution of the high tem- perature decomposition peak (A378–384 ◦C) were included in Fig. 7 as a function of DS. As it is shown in Fig. 7, a very good linear correla- tion could be found between the area of the second decomposition peak and DS values of acetylated starches (r2 = 0.9599). The results are interesting in view of the low amount of sample required for TG 0.0 0.2 0.4 0.6 0.8 1.0 1.2 1.4 0 10 20 30 40 50 60 70 A378-384ºC = 52.30 DS -3.27 r 2 = 0,9599 A378-384ºC (%) DS Fig. 7. Correlation between the percentual area of the high temperature decompo- sition peak of acetylated starches and DS measured by saponification. analysis, and the relatively short times involved in DS estimation by this technique when compared with traditional saponification protocols. In reference to DTG data of butyrylated starches, Fig. 5b shows that butyrylated starches decomposed in only two clear weight loss stages. The first weight loss was found in the 25–140 ◦C range and corresponds to water vaporization. The amount of water lost in this stage again decreased with the increase of DS. The second DTG peak is assigned to butyrylated starch decomposition, which in this case occurred in a single stage and at lower temperature values than native starch (Tmax = 276–278 ◦C compared with 323 ◦C for native starch). The exception was the butyrylated starch with the lowest DS (1 h, DS = 0.14), which showed a decomposition pattern very similar to that of native starch, with Tmax = 318 ◦C. The previous data suggest that at low butyrylation, the thermal properties of starch remained almost the same. On the other hand, at high DS (DS = 1.45 for 2.5 h, DS = 1.51 for 5 h, DS = 1.54 for 7 h), decomposition started at lower temperatures. Tmax was centred at 276–278 ◦C, which indicates that esterification with butyric acid reduced the thermal stability of starch. Although esterification of starch generally results in higher thermal sta- bility upon reduction of hydroxyl groups’ content, the behaviour observed could be attributed to a plausible reduction in the molec- ular weight of esterified starches induced by temperature, and/or a lower crystallinity value. Cyras et al. (2006) studied the ester- ification of starch with acetic anhydride and maleic anhydride, and found that esterified starches were less thermally stable than native starch. Authors explained their results based in the lower crystallinity of acylated starches caused by the addition of more voluminous groups in the chain. Different from acetylated starches, in terms of starch ester decomposition only one defined peak was observed in butyrylated starches thermograms. However, at high DS (DS ≥ 1.45 obtained after 2.5 h of reaction, Fig. 5b), the decom- position peak showed an important tailing at high temperatures, and a small peak overlapped with the previous gradually appeared at around 377 ◦C. Although less clear than in acetylated starches and only for the higher DS values measured, a second decomposi- tion peak attributed in this case to evolving butyric acid could be inferred from DTG data. Deconvolution of DTG peaks also showed the increase of this second decomposition peak with increasing DS, although with a much lower slope (data not shown). 3.5. X-ray diffraction (XRD) X-ray diffraction patterns of acetylated samples corresponding to increasing reaction times were obtained in order to determine
- 8. 356 M. Tupa et al. / Carbohydrate Polymers 98 (2013) 349–357 10 15 20 25 30 35 40 45 7 h - DS=1.23 5 h - DS=0.98 3 h - DS=0.56 1 h - DS=0.31 0.5 h - DS=0.06 native starch Intensity(u.a.) 2 Fig. 8. X-ray diffractograms of acetylated starches. For clarity purposes, baselines of XRD patterns have been moved up. whether organocatallytic acetylation altered the crystallinity of starch. Fig. 8 shows the X-ray patterns obtained for native and acetylated starches. Depending on their botanical origin and com- position starch granules may exhibit two different types of X-ray diffraction pattern which are associated with two crystalline poly- morphic forms: the A-type mainly found in cereal starches; and the B-type observed in tubers and high-amylose starches (López-Rubio et al., 2009). As it is shown in Fig. 8, native corn starch exhibited an A-type pattern characteristic of cereal starch, with reflections at 2Â of 14.9◦, 17.0◦, 17.8◦, 19.8◦ and 22.8◦. For acetylated starches, irrespectively of the DS achieved, the patterns obtained were very similar in terms of the number and position of the peaks, which means that the crystal morphology is not affected by acetylation (López-Rubio et al., 2009). However, the intensity of characteristic peaks showed a gradual reduction with increasing DS. The review of XRD data belonging to other methodologies of starch acetylation shows that normally with esterification processing, the crystalline structure of the native starch is destroyed (Diop et al., 2011; Han et al., 2012; Garg & Jana, 2011). The crystallinity in cereal starch has been largely attributed to the formation of double helices by intermolecular hydrogen bonds within the amylopectin segments. Thus, the reduction of crystallinity during acetylation is frequently explained in terms of a lower formation of inter and intramolecular hydrogen bonds, due to the partial replacement hydroxyl groups of starch with acetyl groups, resulting thereby in the destruction of the original ordered crystal structure (Diop et al., 2011; Zhang, Xie, Zhao, Liu, & Gao, 2009). Results obtained herein suggest that even at DS = 1.23 (the highest DS obtained under the chosen conditions), the remaining hydroxyl groups still had chance to form hydro- gen bonds, and thus the crystalline peaks, although with weaker intensities, still existed. Xu et al. (2004), found similar results in the acetylation of high-amylose starch catalyzed by NaOH. Authors found that when hydroxyl groups were replaced partially by acetyl groups (i.e. DS 0.57 and 1.11), the crystalline peaks of native corn starch existed but the intensities became weaker. However, when DS increased further to 2.23, the ordered crystalline structures were lost. Authors attributed this observation to the fact that the acetyl groups replaced most of the hydroxyl groups on starch, thus no intermolecular hydrogen bonds could be formed, and amorphous patterns with broad peaks were obtained (Xu et al., 2004). On the other hand, scarce modifications of XRD patterns at low DS – such as those observed in Fig. 8 for the first hour of reaction –, have been attributed to chemical modification taking place mainly in the amorphous regions of starch (López-Rubio et al., 2009; Ogawa et al., 1999). 4. Conclusion A non-conventional facile and direct organocatalytic method has been applied to the preparation of starch acetates and starch butyrates with different DS. The method showed its suitability to produce the target starch esters in a wide range of DS val- ues, controlling only reaction time while keeping all other reaction parameters constant. Starch esters were characterized in terms of their morphology, chemical structure and thermal stability. FTIR confirmed esterification by appearance/increase of characteristic esterification bands with increasing DS, as well as by the reduc- tion of intensity of the bands attributed to hydroxyl groups. The smooth surface of starch granules became rough with acetylation, and wrinkles, grooves and some deformation could be observed in a fraction of the starch acetates granules. In the case of butyry- lated starches, esterification showed a much higher effect on the granules morphology, which at high DS showed incipient toroidal shapes. However, no loss of the granules structure was observed. In reference to thermal properties of derivatized starches, DTG data of acetylated granules showed the appearance of a new sec- ond decomposition peak at high temperature intervals, whose area increased linearly with increasing DS. Butyrylated starches showed a main decomposition peak at lower temperatures than native starch. X-ray diffraction analysis of acetylated starches with increasing DS showed changes in the relative intensities of the diffraction peaks for the higher substitution degrees achieved, meaning that at high DS the incorporation of acyl groups affected the crystallinity of starch. However, at the highest DS assayed the crystalline peaks could still be clearly identified, which suggests that the organization of starch was not completely destroyed. In the case of acetylated starches, specific FTIR (DS ≤ 0.56) and TGA data could be very well correlated with between DS and both, characteristic IR ester bands and the area of DTG peaks accounting for the thermal decomposition of ester groups, appear as promising tools for a good and rapid estimation of DS. Further research on the effect of other reaction parameters used in the synthesis of starch acetate and starch butyrate (i.e. reac- tion temperature, acylating agent/substrate ratio, mass of catalyst, etc.) is currently being performed. The starch esters herein syn- thesized to illustrate the power of the organocatalytic route, were chosen based either on their wide current use in the food industry (starch acetate), or due to their recently demonstrated potential for medicine applications (starch acetate and butyrate). However, the methodology has the potential to be extended to the synthesis of a wide variety of starch esters by use of other acylating agents, being those carboxylic acids or anhydrides. Remarkable advantages of the methodology used include the absence of solvent, the use of non-toxic catalysts, the fact that no-pretreatment of the starch is needed, and the easiness of esters recovery due to the heterogeneity of the reaction system. Acknowledgements Authors acknowledge Consejo Nacional de Investigaciones Cien- tíficas y Técnicas (CONICET), University of Buenos Aires (UBACYT 20020090100065), and Agencia Nacional de Promoción Científica y Tecnológica for financial support (PICT 00223 2008 – PRESTAMO BID). References Bajka, B. H. (2007). The effects of increased butyrate delivered as butyrylated starch on large bowel physiology in the rat. University of Adelaide (Ph.D. Thesis) Bajka, B. H., Topping, D. L., Cobiac, L., & Clarke, J. M. (2006). Butyrylated starch is less susceptible to enzymic hydrolysis and increases large-bowel butyrate more than high-amylose maize starch in the rat. British Journal of Nutrition, 96, 276–282.
- 9. M. Tupa et al. / Carbohydrate Polymers 98 (2013) 349–357 357 Barud, H. S., Ribeiro, C. A., Crespi, M. S., Martines, M. A. U., Dexpert-Ghys, J., Marques, R. F. C., et al. (2007). Thermal characterization of bacterial cellulose–phosphate composite membranes. Journal of Thermal Analysis and Calorimetry, 87, 815–818. Buléon, A., Colonna, P., Planchot, V., & Ball, S. (1998). Starch granules: structure and biosynthesis. International Journal of Biological Macromolecules, 23, 85–112. Cael, J. J., Koenig, J. L., & Blackwell, J. (1975). Infrared and Raman spectroscopy of carbohydrates, part VI: Normal coordinate analysis of V-amylose. Biopolymers, 14, 1885–1903. Chowdary, K. P. R., & Radha, G. V. (2011). Synthesis, characterization and evalua- tion of starch acetate as rate controlling matrix former for controlled release of nifedipine. International Journal of Chemical Sciences, 9, 449–456. Clarke, J. M., Topping, D. L., Christophersen, C. T., Bird, A. R., Lange, K., Saunders, I., et al. (2011). Butyrate esterified to starch is released in the human gastrointesti- nal tract. American Journal of Clinical Nutrition, 94, 1276–1283. Cyras, V. P., Tolosa Zenklusen, M. C., & Vazquez, A. (2006). Relationship between structure and properties of modified potato starch biodegradable films. Journal of Applied Polymer Science, 101, 4313–4319. de Graaf, R. A., Broekroelofs, A., & Janssen, L. B. M. (1998). The acetylation of starch by reactive extrusion. Starch, 50, 198–205. Diop, C. I. K., Li, H. L., Xie, B. J., & Shi, J. (2011). Effects of acetic acid/acetic anhydride ratios on the properties of corn starch acetates. Food Chemistry, 126, 1662–1669. Domínguez de María, P. (2010). Minimal hydrolases: Organocatalytic ring-opening polymerizations catalyzed by naturally occurring carboxylic acids. Chem- CatChem, 2, 487–492. Domínguez de María, P., & Martinsson, A. (2009). Ionic-liquid-based method to determine the degree of esterification in cellulose fibers. Analyst, 134, 493–496. Elomaa, M., Asplund, T., Soininen, P., Laatikainen, R., Peltonen, S., Hyvärinen, S., et al. (2004). Determination of the degree of substitution of acetylated starch by hydrolysis, 1 H NMR and TGA/IR. Carbohydrate Polymers, 57, 261–267. Fang, J. M., Fowler, P. A., Tomkinson, J., & Hill, C. A. S. (2002). The preparation and characterisation of a series of chemically modified potato starches. Carbohydrate Polymers, 47, 245–252. Fornal, J., Sadowska, J., Błaszczak, W., Jelinski, T., Stasiak, M., Molenda, M., et al. (2012). Influence of some chemical modifications on the characteristics of potato starch powders. Journal of Food Engineering, 108, 515–522. Garg, A., & Jana, A. K. (2011). Characterization and evaluation of acylated starch with different acyl groups and degrees of substitution. Carbohydrate Polymers, 83, 1623–1630. Hafrén, J., & Córdova, A. (2005). Direct organocatalytic polymerization from cellulose fibers. Macromolecular Rapid Communications, 26, 82–86. Han, F., Liu, M., Gong, H., Lü, S., Ni, B., & Zhang, B. (2012). Synthesis, characterization and functional properties of low substituted acetylated corn starch. International Journal of Biological Macromolecules, 50, 1026–1034. Kaur, L., Singh, N., & Singh, J. (2004). Factors influencing the properties of hydrox- ypropylated potato starches. Carbohydrate Polymers, 55, 211–223. Kizil, R., Irudayaraj, J., & Seetharaman, K. (2002). Characterization of irradiated starches by using FT-Raman and FTIR spectroscopy. Journal of Agricultural and Food Chemistry, 50, 3912–3918. Le Corre, D., Bras, J., & Dufresne, A. (2010). Starch nanoparticles: a review. Biomacro- molecules, 11, 1139–1153. López-Rubio, A., Clarke, J. M., Scherer, B., Topping, D., & Gilbert, E. P. (2009). Structural modifications of granular starch upon acylation with short-chain fatty acids. Food Hydrocolloids, 23, 1940–1946. Luo, Z-G., & Shi, Y-C. (2012). Preparation of acetylated waxy, normal, and high- amylose maize starches with intermediate degrees of substitution in aqueous solution and their properties. Journal of Agricultural and Food Chemistry, 60, 9468–9475. Luo, Z., & Zhou, Z. (2012). Homogeneous synthesis and characterization of starch acetates in ionic liquid without catalysts. Starch, 64, 37–44. Mose, B. R., & Maranga, S. M. (2011). A review on starch based nanocomposites for bioplastic materials. Journal of Materials Science and Engineering B, 1, 239–245. Niemann, C., & Whistler, R. L. (1992). Effect of acid hydrolysis and ball milling on porous maize starch. Starch, 44, 409–414. Ogawa, K., Hirai, I., Shimasaki, C., Yoshimura, T., Ono, S., Rengakuji, S., et al. (1999). Simple determination method of degree of substitution for starch acetate. Bul- letin of the Chemical Society of Japan, 72, 2785–2790. Parandoosh, S., & Hudson, S. J. (1993). The acetylation and enzymatic degradation of starch films. Applied Polymer Science, 48, 787–791. Phillips, D. L., Huijum, L., Duohai, P., & Harold, C. (1999). General application of Raman spectroscopy for the determination of level of acetylation in modified starches. Cereal Chemistry, 76, 439–443. Santha, N., Sudha, K. G., Vijaykumari, K. P., Nayar, V. U., & Moorthy, S. N. (1990). Raman and Infrared spectra of starch samples of sweet potato and cas- sava. Proceedings of the Indian Academy of Sciences (Chemical Sciences), 102, 705–712. Shogren, R. (2008). Scandium triflate catalyzed acetylation of starch at low moderate temperatures. Carbohydrate Polymers, 72, 439–443. Shogren, R. L. (1996). Preparation, thermal properties, and extrusion of high-amylose starch acetates. Carbohydrate Polymers, 29, 57–62. Shogren, R. L., & Biswas, A. (2010). Acetylation of starch with vinyl acetate in imid- azolium ionic liquids and characterization of acetate distribution. Carbohydrate Polymers, 81, 149–151. Singh, J., Kaur, L., & Singh, N. (2004). Effect of acetylation on some properties of corn and potato starches. Starch, 56, 586–601. Singh, N., Chawla, D., & Singh, J. (2004). Influence of acetic anhydride on physico- chemical, morphological and thermal properties of corn and potato starch. Food Chemistry, 86, 601–608. Sujka, M., & Jamroz, J. (2007). Starch granule porosity and its changes by means of amylolysis. International Agrophysics, 21, 107–113. Thiebaud, S., Aburto, J., Alric, I., Borredon, E., Bikiaris, D., Prinos, J., et al. (1997). Properties of fatty-acid esters of starch and their blends with LDPE. Journal of Applied Polymer Science, 65, 705–721. Vilpoux, O., & Avérous, L. (2004). Starch-based plastics. In M. P. Cereda, & O. O. Vilpoux (Eds.), Technology, use and potentialities of Latin American starchy tubers. Collection latin american starchy tubers (pp. 521–553). São Paolo, Brazil: NGO Raízes and Cargill Foundation. Xu, Y., Miladinov, V., & Hanna, M. A. (2004). Synthesis and characterization of starch acetates with high substitution. Cereal Chemistry, 81, 735–740. Zhang, L. M., Xie, W. G., Zhao, X., Liu, Y., & Gao, W. (2009). Study on the morphology, crystalline structure and thermal properties of yellow ginger starch acetates with different degrees of substitution. Thermochimica Acta, 495, 57–62.