Outlook for Week of February 11, 2019
•
0 recomendaciones•3,093 vistas

Free weekly newsletter with outlook and brief comments for world stock markets. Weekly reversal levels for stocks, gold and currencies. This method was designed to keep you on the right side of the market most of the time, letting the winners run while avoiding big losses.

Recomendados
Recomendados
Más contenido relacionado
Más de LunaticTrader
Más de LunaticTrader (17)
Último
Último (20)
Outlook for Week of February 11, 2019
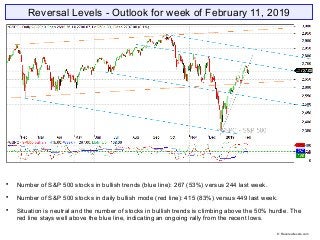
- 1. Reversal Levels - Outlook for week of February 11, 2019 Number of S&P 500 stocks in bullish trends (blue line): 267 (53%) versus 244 last week. Number of S&P 500 stocks in daily bullish mode (red line): 415 (83%) versus 449 last week. Situation is neutral and the number of stocks in bullish trends is climbing above the 50% hurdle. The red line stays well above the blue line, indicating an ongoing rally from the recent lows. © Reversallevels.com
- 2. ELC: down, but flattening out | BMO: up | Blue snake: down | Repellor: up. Market is above the blue snake boundary, which is usually a bullish omen. If ELC turns back up then a continuation of the bull market becomes the base scenario. © Reversallevels.com S&P 500 Weekly chart
- 3. Buy signal for Australia AOI. Most other markets stay in weak bearish trend. Brazil Bovespa stays fully bullish. Bonds TLT are weak bullish. Gold is giving a partial profits signal. May be peaking. EURUSD is weak bearish. A test of the RevL failed. If MoM turns back down it will be a bearish continuation. Oil stays in a weak bearish trend and stagnates just below its RevL. Wheat is in a bullish trend. Needs follow through to avoid a failed rally. © Reversallevels.com Major indices
- 4. Buy signals for Netherlands AEX, US Dow Industrials and Dow Utilities. Further improvements this week. All global markets have upward weekly MoM and more markets are close to giving Buy signals. As always, it’s better to ride the trend than to fight it. World markets © Reversallevels.com
- 5. Buy signal for AXP. Sell signal for VZ. 16 stocks bullish, unchanged from 16 last week. Above 15 = mildly bullish market. See article: Keeping an eye on the Dow stocks If the recent advance is for real then we should see the number of bullish Dow stocks climb above 20. . 30 Dow Jones Industrials stocks © Reversallevels.com
- 6. No changes this week. Currencies tend to make long trending moves, so we don’t get weekly Buy or Sell signals so often. For daytraders or swing traders: if you do your trading in the direction of the weekly trend you are likely to do well in the long run. So, try to buy the pullbacks in currencies pairs that are in weekly bullish trends and sell the rips during weekly bearish trends. Forex & Crypto © Reversallevels.com
- 7. On Twitter: http://twitter.com/lunatictrader1 On Stocktwits: http://stocktwits.com/LunaticTrader Website: Reversallevels.com For daily comments and questions you can find us here: © Reversallevels.com Disclaimer Investing in stocks, forex or commodities is risky. No guarantee can be given that the opinions or predictions given in this presentation will be correct. Reversallevels.com cannot in any way be responsible for eventual losses you may incur if you trade based on the given information. Simulated trading programs in general are subject to the fact that they are designed with the benefit of hindsight. No representation is being made that any account will or is likely to achieve profits or losses similar to those shown. Trade at your own risk and responsibility. Subscription service Daily reversal levels for over 3000 stocks and ETF are available by monthly subscription. For less than $1 a day you can become a more efficient investor: 1 Month ($22) 6 Months ($110) 1 Year ($199) Comes with full instructions and strategies for using the reversal levels and MoM indicator in your own trading. This is an honest method with limited risk, not a get rick quick formula. Give it a try.