Outlook for Week of June 10, 2019
•
0 recomendaciones•2,604 vistas

Free weekly newsletter with outlook and brief comments for world stock markets. Weekly reversal levels for stocks, gold and currencies. This method was designed to keep you on the right side of the market most of the time, letting the winners run while avoiding big losses.

Recomendados
Recomendados
Más contenido relacionado
Más de LunaticTrader
Más de LunaticTrader (17)
Último
Último (20)
Outlook for Week of June 10, 2019
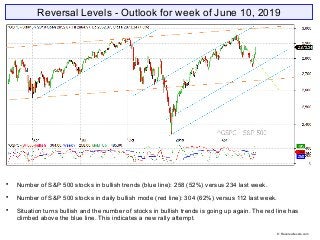
- 1. Reversal Levels - Outlook for week of June 10, 2019 Number of S&P 500 stocks in bullish trends (blue line): 258 (52%) versus 234 last week. Number of S&P 500 stocks in daily bullish mode (red line): 304 (62%) versus 112 last week. Situation turns bullish and the number of stocks in bullish trends is going up again. The red line has climbed above the blue line. This indicates a new rally attempt. © Reversallevels.com
- 2. ELC: up | BMO: down | Blue snake: down | Repellor: up. The longer term picture stays bullish. The Repellor has held so far. BMO is reaching the neutral line, but not turning up yet. Until it bottoms out caution is warranted. © Reversallevels.com S&P 500 Weekly chart
- 3. Weak Buy signal for S&P 500. Possible fake-out move. Nikkei stays bearish, other major markets are in bullish trends. Bonds TLT stay fully bullish with upward MoM. A nice 10% gainer since our weekly Buy signal 26 weeks ago. Gold is fully bullish with upward MoM. Old overhead resistance near $1360 is next big hurdle. EURUSD is giving a Buy signal. End of 56 weeks of bearish trend Oil is in a young bearish trend. Wheat is fully bullish and back above $500. © Reversallevels.com Major indices
- 4. Buy signal for Gold stocks XAU. Weak Buy signals for South Africa JOHA and Dow Industrials. Possible fake-out moves. Some improvement after weeks of Sell signals. World markets © Reversallevels.com
- 5. Buy signal for PFE. Partial profits signal for TRV. A 16% gain in 16 weeks. 14 stocks bullish, up from 13 last week. Below 20 = bearish market. See article: Keeping an eye on the Dow stocks Minor improvement with one new Buy signal. It’s too early to tell whether the recent pullback is over. If the number of bullish stocks climbs back above 20 then a continuing bull market would become the base scenario again. . 30 Dow Jones Industrials stocks © Reversallevels.com
- 6. Sell signal for USDCAD and USDCHF. Currencies tend to make long trending moves, so we don’t get weekly Buy or Sell signals so often. For daytraders or swing traders: if you do your trading in the direction of the weekly trend you are likely to do well in the long run. So, try to buy the pullbacks in currencies pairs that are in weekly bullish trends and sell the rips during weekly bearish trends. Forex & Crypto © Reversallevels.com
- 7. On Twitter: http://twitter.com/lunatictrader1 On Stocktwits: http://stocktwits.com/LunaticTrader Website: Reversallevels.com For daily comments and questions you can find us here: © Reversallevels.com Disclaimer Investing in stocks, forex or commodities is risky. No guarantee can be given that the opinions or predictions given in this presentation will be correct. Reversallevels.com cannot in any way be responsible for eventual losses you may incur if you trade based on the given information. Simulated trading programs in general are subject to the fact that they are designed with the benefit of hindsight. No representation is being made that any account will or is likely to achieve profits or losses similar to those shown. Trade at your own risk and responsibility. Subscription service Daily reversal levels for over 3000 stocks and ETF are available by monthly subscription. For less than $1 a day you can become a more efficient investor: 1 Month ($22) 6 Months ($110) 1 Year ($199) Comes with full instructions and strategies for using the reversal levels and MoM indicator in your own trading. This is an honest method with limited risk, not a get rick quick formula. Give it a try.