Outlook for Week of March 11, 2019
•
1 recomendación•3,420 vistas

Free weekly newsletter with outlook and brief comments for world stock markets. Weekly reversal levels for stocks, gold and currencies. This method was designed to keep you on the right side of the market most of the time, letting the winners run while avoiding big losses.

Recomendados
Recomendados
Más contenido relacionado
Más de LunaticTrader
Más de LunaticTrader (17)
Último
Último (20)
Outlook for Week of March 11, 2019
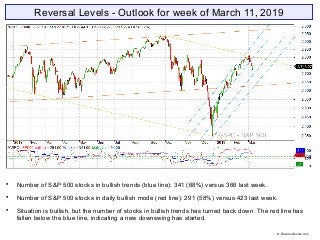
- 1. Reversal Levels - Outlook for week of March 11, 2019 Number of S&P 500 stocks in bullish trends (blue line): 341 (68%) versus 366 last week. Number of S&P 500 stocks in daily bullish mode (red line): 291 (58%) versus 423 last week. Situation is bullish, but the number of stocks in bullish trends has turned back down. The red line has fallen below the blue line, indicating a new downswing has started. © Reversallevels.com
- 2. ELC: up | BMO: turning down | Blue snake: up | Repellor: up. BMO has turned down as expected. A pause or pullback is underway. The Repellor line at 2650 is an important level to watch. If the market drops below that level the scenario for a continuing bear market would gain traction. © Reversallevels.com S&P 500 Weekly chart
- 3. All major stock indexes are in bullish trends. Follow through will be needed to avoid a failed rally. Bonds TLT stays weak bullish. Gold is weak bullish and tries to regain the 1300 level. But MoM points down. EURUSD is fully bearish with downward MoM. Oil is in a bullish trend. Wheat is fully bearish with no signs of a bottom. © Reversallevels.com Major indices
- 4. Sell signal for Malaysia. MoM is turning down for a couple of markets. Just a pause, or the start of a bigger decline? It’s too early to tell. World markets © Reversallevels.com
- 5. Sell signal for PFE. Bearish divergence for CAT and HD. 22 stocks bullish, down from 23 last week. Above 20 = bullish market. See article: Keeping an eye on the Dow stocks We see hesitation in a lot of stocks. That’s not abnormal given the recent runup. It is a chance to get rid of the weaker performers that are given Sell signals. That is the equivalent of culling the herd by retaining the healthier animals. . 30 Dow Jones Industrials stocks © Reversallevels.com
- 6. Buy signals for USDBRL and USDCAD. Sell signal for USDINR. Currencies tend to make long trending moves, so we don’t get weekly Buy or Sell signals so often. For daytraders or swing traders: if you do your trading in the direction of the weekly trend you are likely to do well in the long run. So, try to buy the pullbacks in currencies pairs that are in weekly bullish trends and sell the rips during weekly bearish trends. Forex & Crypto © Reversallevels.com
- 7. On Twitter: http://twitter.com/lunatictrader1 On Stocktwits: http://stocktwits.com/LunaticTrader Website: Reversallevels.com For daily comments and questions you can find us here: © Reversallevels.com Disclaimer Investing in stocks, forex or commodities is risky. No guarantee can be given that the opinions or predictions given in this presentation will be correct. Reversallevels.com cannot in any way be responsible for eventual losses you may incur if you trade based on the given information. Simulated trading programs in general are subject to the fact that they are designed with the benefit of hindsight. No representation is being made that any account will or is likely to achieve profits or losses similar to those shown. Trade at your own risk and responsibility. Subscription service Daily reversal levels for over 3000 stocks and ETF are available by monthly subscription. For less than $1 a day you can become a more efficient investor: 1 Month ($22) 6 Months ($110) 1 Year ($199) Comes with full instructions and strategies for using the reversal levels and MoM indicator in your own trading. This is an honest method with limited risk, not a get rick quick formula. Give it a try.