Outlook for Week of March 25, 2019
•
0 recomendaciones•3,226 vistas

Free weekly newsletter with outlook and brief comments for world stock markets. Weekly reversal levels for stocks, gold and currencies. This method was designed to keep you on the right side of the market most of the time, letting the winners run while avoiding big losses.

Recomendados
Recomendados
Más contenido relacionado
Más de LunaticTrader
Más de LunaticTrader (17)
Último
Último (20)
Outlook for Week of March 25, 2019
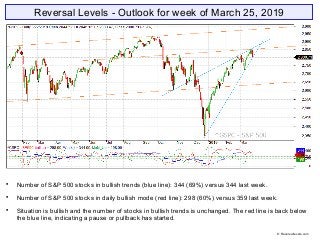
- 1. Reversal Levels - Outlook for week of March 25, 2019 Number of S&P 500 stocks in bullish trends (blue line): 344 (69%) versus 344 last week. Number of S&P 500 stocks in daily bullish mode (red line): 298 (60%) versus 359 last week. Situation is bullish and the number of stocks in bullish trends is unchanged. The red line is back below the blue line, indicating a pause or pullback has started. © Reversallevels.com
- 2. ELC: up | BMO: down | Blue snake: up | Repellor: up. BMO keeps going down. Looks like a sideways pause. The Repellor line at 2668 is an important level to watch. If the market drops below that level the scenario for a continuing bear market would gain traction. © Reversallevels.com S&P 500 Weekly chart
- 3. All major stock indexes are in bullish trends. Follow through will be needed to avoid a failed rally. Bonds TLT are back to fully bullish with upward MoM. Gold is weak bullish and has regained the 1300 level. But MoM still points down. EURUSD is changing to weak bearish trend with a bullish divergence. May have bottomed. Oil is in a bullish trend and closing in on the $60 level. Wheat is fully bearish with no signs of a bottom. © Reversallevels.com Major indices
- 4. Sell signal for Chile IPSA. Bearish divergence for Dow Industrials. May have peaked. MoM is turning down for more markets. Just a pause, or the start of a bigger decline? It’s too early to tell. World markets © Reversallevels.com
- 5. Sell signal for BA and DIS. Partial profits signal for PG. A 17% gain in 22 weeks. 21 stocks bullish, down from 23 last week. Above 20 = bullish market. See article: Keeping an eye on the Dow stocks We see hesitation in some stocks. That’s not abnormal given the recent run-up. MoM is turning down for a bunch of stocks. Not a reason for instant panic, but a development to keep an eye on. . 30 Dow Jones Industrials stocks © Reversallevels.com
- 6. Buy signal for USDTRY. Sell signal for USDJPY. Speculative Buy signal for EURGBP. Currencies tend to make long trending moves, so we don’t get weekly Buy or Sell signals so often. For daytraders or swing traders: if you do your trading in the direction of the weekly trend you are likely to do well in the long run. So, try to buy the pullbacks in currencies pairs that are in weekly bullish trends and sell the rips during weekly bearish trends. Forex & Crypto © Reversallevels.com
- 7. On Twitter: http://twitter.com/lunatictrader1 On Stocktwits: http://stocktwits.com/LunaticTrader Website: Reversallevels.com For daily comments and questions you can find us here: © Reversallevels.com Disclaimer Investing in stocks, forex or commodities is risky. No guarantee can be given that the opinions or predictions given in this presentation will be correct. Reversallevels.com cannot in any way be responsible for eventual losses you may incur if you trade based on the given information. Simulated trading programs in general are subject to the fact that they are designed with the benefit of hindsight. No representation is being made that any account will or is likely to achieve profits or losses similar to those shown. Trade at your own risk and responsibility. Subscription service Daily reversal levels for over 3000 stocks and ETF are available by monthly subscription. For less than $1 a day you can become a more efficient investor: 1 Month ($22) 6 Months ($110) 1 Year ($199) Comes with full instructions and strategies for using the reversal levels and MoM indicator in your own trading. This is an honest method with limited risk, not a get rick quick formula. Give it a try.