Outlook for Week of March 4, 2019
•
0 recomendaciones•3,466 vistas

Free weekly newsletter with outlook and brief comments for world stock markets. Weekly reversal levels for stocks, gold and currencies. This method was designed to keep you on the right side of the market most of the time, letting the winners run while avoiding big losses.

Recomendados
Recomendados
Más contenido relacionado
Más de LunaticTrader
Más de LunaticTrader (17)
Último
Último (20)
Outlook for Week of March 4, 2019
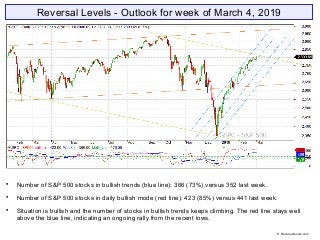
- 1. Reversal Levels - Outlook for week of March 4, 2019 Number of S&P 500 stocks in bullish trends (blue line): 366 (73%) versus 352 last week. Number of S&P 500 stocks in daily bullish mode (red line): 423 (85%) versus 441 last week. Situation is bullish and the number of stocks in bullish trends keeps climbing. The red line stays well above the blue line, indicating an ongoing rally from the recent lows. © Reversallevels.com
- 2. ELC: up | BMO: up | Blue snake: up | Repellor: up. Market is above the blue snake boundary. All indicators point up. A continuation of the bull market is the base scenario. BMO is very high, indicating that a pause or pullback is becoming very likely. © Reversallevels.com S&P 500 Weekly chart
- 3. Buy signals for Nikkei and DAX. All major indexes are in bullish trends. Bonds TLT stays weak bullish and is only just above its RevL. Gold changes to weak bullish with downward MoM. May have peaked. EURUSD is fully bearish with downward MoM. Oil is in a bullish trend. Wheat is fully bearish and already down nearly 10% since the Sell signal a few weeks ago. © Reversallevels.com Major indices
- 4. Nearly all world markets are in bullish trends. Mexico is the only market that stays in bearish trend. World markets © Reversallevels.com
- 5. Buy signal for JNJ. Sell signal for UNH. 23 stocks bullish, unchanged from 23 last week. Above 20 = bullish market. See article: Keeping an eye on the Dow stocks We don’t know when and where the trending moves will end. Just going with the flow. . 30 Dow Jones Industrials stocks © Reversallevels.com
- 6. Buy signal for USDJPY. Bullish divergence for USDBRL. Currencies tend to make long trending moves, so we don’t get weekly Buy or Sell signals so often. For daytraders or swing traders: if you do your trading in the direction of the weekly trend you are likely to do well in the long run. So, try to buy the pullbacks in currencies pairs that are in weekly bullish trends and sell the rips during weekly bearish trends. Forex & Crypto © Reversallevels.com
- 7. On Twitter: http://twitter.com/lunatictrader1 On Stocktwits: http://stocktwits.com/LunaticTrader Website: Reversallevels.com For daily comments and questions you can find us here: © Reversallevels.com Disclaimer Investing in stocks, forex or commodities is risky. No guarantee can be given that the opinions or predictions given in this presentation will be correct. Reversallevels.com cannot in any way be responsible for eventual losses you may incur if you trade based on the given information. Simulated trading programs in general are subject to the fact that they are designed with the benefit of hindsight. No representation is being made that any account will or is likely to achieve profits or losses similar to those shown. Trade at your own risk and responsibility. Subscription service Daily reversal levels for over 3000 stocks and ETF are available by monthly subscription. For less than $1 a day you can become a more efficient investor: 1 Month ($22) 6 Months ($110) 1 Year ($199) Comes with full instructions and strategies for using the reversal levels and MoM indicator in your own trading. This is an honest method with limited risk, not a get rick quick formula. Give it a try.