Outlook for Week of October 28, 2019
•
1 recomendación•2,046 vistas

Free weekly newsletter with outlook and brief comments for world stock markets. Weekly reversal levels for stocks, gold and currencies. This method was designed to keep you on the right side of the market most of the time, letting the winners run while avoiding big losses.

Recomendados
Recomendados
Más contenido relacionado
Más de LunaticTrader
Más de LunaticTrader (17)
Último
Último (20)
Outlook for Week of October 28, 2019
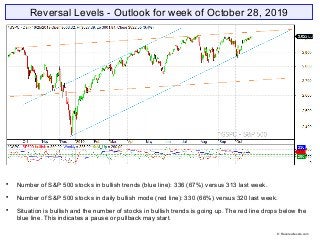
- 1. Reversal Levels - Outlook for week of October 28, 2019 Number of S&P 500 stocks in bullish trends (blue line): 336 (67%) versus 313 last week. Number of S&P 500 stocks in daily bullish mode (red line): 330 (66%) versus 320 last week. Situation is bullish and the number of stocks in bullish trends is going up. The red line drops below the blue line. This indicates a pause or pullback may start. © Reversallevels.com
- 2. ELC: up | BMO: up | Blue snake: up | Repellor: up. Indicators stay bullish. If ELC turns down again it would get us back into the large bearish divergence situation. But that remains to be seen. © Reversallevels.com S&P 500 Weekly chart
- 3. FTSE100 changes to weak bearish trend and is about to test ts RevL. Other major markets stay in bullish trends. Bonds TLT are weak bullish with downward MoM. Gold is weak bullish with downward MoM. Tries to regain the 1500 level. EURUSD is in a weak bearish trend. Dropped back after testing its weekly RevL Oil is showing a bullish divergence. Wheat is in a fresh bullish trend. © Reversallevels.com Major indices
- 4. Buy signals for Dow Transports and Russell 2000. Sell signal for Chile IPSA. A majority of markets is in bullish trends, but follow through is needed to keep going. World markets © Reversallevels.com
- 5. Buy signal for CAT, DOW and GS. Sell signal for MCD. 17 stocks bullish, up from 15 last week. Below 20 = weakening bullish. See article: Keeping an eye on the Dow stocks In major market advances the number of bullish stocks typically goes above 25. That hasn’t happened yet. If the bullish count falls back below the 15 level it would be a serious warning sign. . 30 Dow Jones Industrials stocks © Reversallevels.com
- 6. Buy signal for USDJPY. Bearish divergence for USDCHF. Currencies tend to make long trending moves, so we don’t get weekly Buy or Sell signals so often. For daytraders or swing traders: if you do your trading in the direction of the weekly trend you are likely to do well in the long run. So, try to buy the pullbacks in currencies pairs that are in weekly bullish trends and sell the rips during weekly bearish trends. Forex & Crypto © Reversallevels.com
- 7. On Twitter: http://twitter.com/lunatictrader1 On Stocktwits: http://stocktwits.com/LunaticTrader Website: Reversallevels.com For daily comments and questions you can find us here: © Reversallevels.com Disclaimer Investing in stocks, forex or commodities is risky. No guarantee can be given that the opinions or predictions given in this presentation will be correct. Reversallevels.com cannot in any way be responsible for eventual losses you may incur if you trade based on the given information. Simulated trading programs in general are subject to the fact that they are designed with the benefit of hindsight. No representation is being made that any account will or is likely to achieve profits or losses similar to those shown. Trade at your own risk and responsibility. Subscription service Daily reversal levels for over 3000 stocks and ETF are available by monthly subscription. For less than $1 a day you can become a more efficient investor: 1 Month ($22) 6 Months ($110) 1 Year ($199) Comes with full instructions and strategies for using the reversal levels and MoM indicator in your own trading. This is an honest method with limited risk, not a get rick quick formula. Give it a try.