ADM 658: Chapter 3 - Financial Analysis (Ratio)
•Descargar como DOCX, PDF•
2 recomendaciones•2,801 vistas


Recomendados
Más contenido relacionado
La actualidad más candente
La actualidad más candente (20)
Destacado
Similar a ADM 658: Chapter 3 - Financial Analysis (Ratio)
Similar a ADM 658: Chapter 3 - Financial Analysis (Ratio) (20)
Más de FSPPP - UiTM ( AM225 )
Más de FSPPP - UiTM ( AM225 ) (20)
Último
Último (20)
ADM 658: Chapter 3 - Financial Analysis (Ratio)
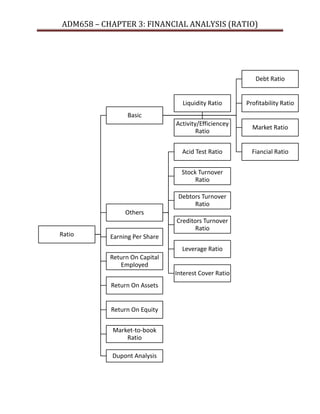
- 1. ADM658 – CHAPTER 3: FINANCIAL ANALYSIS (RATIO) Debt Ratio Liquidity Ratio Profitability Ratio Activity/Efficiencey Ratio Market Ratio Acid Test Ratio Fiancial Ratio Basic Stock Turnover Ratio Debtors Turnover Ratio Others Ratio Creditors Turnover Ratio Earning Per Share Leverage Ratio Return On Capital Employed Interest Cover Ratio Return On Assets Return On Equity Market-to-book Ratio Dupont Analysis
- 2. ADM658 – CHAPTER 3: FINANCIAL ANALYSIS (RATIO) Current Ratio:Firm's ability to meet its short-term obligation. CR= CA/CL Quick Ratio: more conservtive than the CR - includes inventory & assets. QR= (CA-Inventory)/CL Net Working Capital: Firm's overall liqudity. NWC= CA-CL Inventory Turnover (IR): Measures the liquidity of a firm's inventory. IR = COGS/Inventory Activity/Efficiency Ratio Average Collection Period: Time needed to collect account receivables. ACP= Receivables/Average Sales per day. Measures of how efficiently the firm utilizes its assets. Total Asset Turnover: efficiency of the firm uses its assets to generate sales. TATO= Sales/Total Assets Debt Ratios: ability to repay long-term debt. DR = Total Liability/Total Asset Debt to Equity Ratio (D/E): The relative propotion of equity anddebt used to finance firm's asset. D/E= (LT Debt + Value of Leases)/Average Shareholder's Equity. Times Interest Earned Ratio (TIE): Ability to make contractual interest payment. TIE: Net Income/Annual Interest Expenses. Debt Service Coverage Ratio (DSCR): ability to produce enough cash to cover its debt include lease payment. DSCR= Net Operating Income / Total Debt Service. Liquidity Ratio Basic Ratio 1. Measures company’s ability to pay off its short-term obligation. Debt Ratios Measure the % of a company’s assets are provided via debt.
- 3. ADM658 – CHAPTER 3: FINANCIAL ANALYSIS (RATIO) Gross Profit Margin (GPM): % of each dollar remaning after the firm has paid for its goods. Basic Ratio 2. OPM: Operating Profits/Sales Net Profit Margin (NPM): % of each dollar remaining after all costs and expenses including interest and taxes are deducted. NPM: Net Income/Sales ROA= Net Income/ Total Assets Return in Equity(ROE): Return earned on the owners' investment in the firm. Profitability Ratios Operating Profit margin (OPM): % of each dollar remaining after all costs and expenses other than interest and taxes deducted. Return on Total Asset (ROA): Firm's overal effectiveness in generating profits with its available assets. Measures the firms used its assets and control its expenses to generate an acceptable rate of return. GPM: Gross Profits/Sales ROE: Net Income/Shareholder's Equity. Earning per Share (EPS): profit earned er unit of issued share (ordinary) Dividend per share (DPS): Amount of dividend received by ordinary shareholders for each unit of share held. Market Ratio Measures investors perception and judgment towards the firm’s growth potential EPS: Net Income Available to CS/No. of ordinary shares issued DPS: Ordinary Dividend/No. of Or. shares issued. Dividend Payout Ratio (DPR): proportion of earning that is distributed as dividends to shareholders DPR: DPS/EPS Price/Earning Ratio (P/E): Investors confidence in the firms' future prospects. P/E: Market Price per share (MPS) / EPS Dividend Yield (DY): Return earned on shares. DY: Latest annual dividends/MPS
- 4. ADM658 – CHAPTER 3: FINANCIAL ANALYSIS (RATIO) Difficult to identify suitable industriy category to classify a firm. Limitation of Ratio. Inflation can distort the financial statements (particularly the balance sheet). Any problem in the financials caused by inflation can be passed on to ratios. Ratio analysis is probably most accurate for organizations with a narrow line of products or services. Ratios are only as informative as the financial statements on which they are based. - ratios are not very useful in detecting fraud (or unintentional mistakes) in the accounting system. With some ratios it is difficult to tell where a ratio value changes from “good” to “bad.” There is no clear and systematic way to sift all of the ratio information into a single conclusion about an organization’s overall health and performance. Differences in ratio definitions may make it difficult to compare ratios from different sources. Accounting practices may differ between firms, complicating comparisons of results between firms.