#MITXData "The Impending Transformation of Market Research" presented by Microsoft Research

-David Rothschild, Economist, Microsoft Research For over 75 years survey research has been relatively static; ask a random sample from a representative group of users or a focus group what they would do and report the result. In this session, David Rothschild (Economist, MSR - NYC) will demonstrate how survey research can be more efficient for creating both a snapshot of the present and forecasts of the future, with new questions and accompanying methodology that can utilize more cost effective non-representative samples. The resulting snapshots and forecasts are not only more accurate than standard methods, but more timely and granular, relevant for the stakeholders, and more cost effective. Combined with a nascent growth in our ability to harness social media other new data sources, David will help explain the transformation of market research that will happen next few years.

Recomendados
Recomendados
Más contenido relacionado
Similar a #MITXData "The Impending Transformation of Market Research" presented by Microsoft Research
Similar a #MITXData "The Impending Transformation of Market Research" presented by Microsoft Research (20)
Más de MITX
Más de MITX (16)
Último
Último (20)
#MITXData "The Impending Transformation of Market Research" presented by Microsoft Research
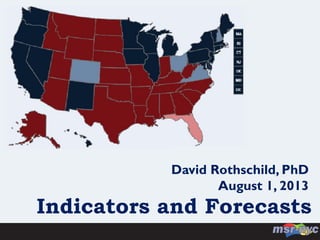
- 1. Indicators and Forecasts David Rothschild, PhD August 1, 2013
- 2. Mean Absolute Error: 2.78 Median Absolute Error: 2.14 Feb 16, 2012
- 3. Data • Fundamental (politics): past election results, incumbency, presidential approval ratings, economic indicators, ideological indicators, biographical information • Social media:Twitter, Facebook • Other online: search, page-views, comments • Polls • Prediction Markets • Experts Passive Data Active Data
- 4. Why do we create Indictors & Forecasts?
- 5. Why Forecasting: Efficiency Business Efficiency: Election Spending: $6 billion in 2012 Similar Methods and Uses: political economy, marketing, economic indicators, finance, public policy, business outcomes, etc.,
- 6. Why Forecasting: Research How/Why: Not just the outcome, but how/why the outcome ultimately occurs.
- 7. Why Forecasting: Necessary Technology: Methods almost unchanged for 75+ years, but will be totally different in 5-10 years Old technology is getting more expensive New technology is getting more efficient
- 8. What is the Goal?
- 9. Gather information analyze it, and aggregate that information into indicators of upcoming events. Relevant Timely Accurate Economically Efficient Raw Data -> Indicators
- 10. Relevant?
- 13. Obama expected to get 51% of vote. Relevant? (Oct 28)
- 14. Obama 80% likely to win Electoral College. Relevant? (Oct 28)
- 15. Relevant? (Oct 28) Romney up by 4 in latest Gallup poll of likely voters Obama 80% likely to win Electoral College
- 16. Why I do not care about economic indicator forecasts released the night before. Timely?
- 17. Efficiency Early: more resources left to allocate Often: always updated Research Early: capture more of campaign Often: granular Timely?
- 18. Accurate? Supporting Actress Nate Silver David Rothschild Anne Hathaway 67.1% 99.5% Sally Field 13.4% 0.4% Helen Hunt 11.1% 0.1% Amy Adams 8.4% 0.0% JackiWeaver 0.0% 0.0% Supporting Actor Nate Silver David Rothschild Tommy Lee Jones 35.4% 44.1% ChristophWaltz 23.8% 40.4% Robert De Niro 6.4% 13.6% Philip Seymour Hoffman 24.1% 1.5% Alan Arkin 10.3% 0.4%
- 19. Error Calibration Out-of-sample Accurate?
- 20. Cost Effective? Original Screenplay Nate Silver David Rothschild Django Unchained 52.0% Zero DarkThirty 27.4% Amour 20.2% Moonrise Kingdom 0.4% Flight 0.0% Sound Mixing Nate Silver David Rothschild Les Miserables 97.4% Skyfall 1.5% Life of Pi 0.6% Argo 0.3% Lincoln 0.2%
- 21. New Questions New Answers Cost Effective?
- 22. Data
- 23. Data • Fundamental (politics): past election results, incumbency, presidential approval ratings, economic indicators, ideological indicators, biographical information • Social media:Twitter, Facebook • Other online: search, page-views, comments • Polls • Prediction Markets • Experts Passive Data Active Data
- 24. Fundamental Data
- 26. GOP Primary
- 32. Next Generation Polling and Prediction Games
- 33. Next Generation Non-Random / Non-Representative Users Incentivize self-selected users w/ high info New questions (graphical interfaces) New aggregation methods/market makers Incentive structures for truthful participation Accurate for new answers and domains New types of questions: relevant & timely New domains: cost effective
- 34. Xbox Daily Poll Between 3 and 5 questions rotated on a daily basis. Over 350k answered at least once, providing demos. Over 750k polls taken in total. 30k+ completed 5 or more polls. 10k+ completed 10 or more polls. 5k+ completed 15 or more polls.
- 35. Predicting the winner of a state’s electoral college Both correct 217 races (63%) Both wrong 45 races (13%) Intent correct 20 races (24%) Expectations correct 63 races (76%) Disagree 83 races (24%) All Races Where the methods disagree Voter Intentions: in 239 / 345 races = 69% Voter Expectation: in 279 / 345 races = 81% Difference in proportion: in proportions: z=3.52***
- 38. Switches by Prior Support
- 39. Overall Shift Shift in Likelihood of Taking Poll/Vote (65%) Other to Romney (75%) Obama to Romney (25%) Shift in Support (35%) Total Shift Shift in Support