

Recomendados
Recomendados
Más contenido relacionado
La actualidad más candente
La actualidad más candente (17)
Destacado
Destacado (20)
Similar a Effect of Corruption on Natural Disaster Vulnerability
Similar a Effect of Corruption on Natural Disaster Vulnerability (20)
Effect of Corruption on Natural Disaster Vulnerability
- 1. IJRESS Volume 6, Issue 2 (February, 2016) (ISSN 2249-7382) International Journal of Research in Economics and Social Sciences (IMPACT FACTOR – 5.545) International Journal of Research in Economics & Social Sciences Email id: editorijrim@gmail.com, http://www.euroasiapub.org 255 Effect of Corruption on Natural Disaster Vulnerability Resulting from Low State Capacity Caused by Low Economic Development Md Boby Sabur1 , Deputy Programme Manager – M&E, Manusher Jonno Foundation Khnd Md Mostafa Kamal2 Associate Professor, Department of Statistics, Biostatistics and Informatics, University of Dhaka Abstract Poor governance, corruption and disaster vulnerability are interlinked with each other.They work together as an obstacle for overall development of a nation. This study explores this relationship considering cyclone Sidr that hit both Bangladesh and India in 2007, in addition,using the cross-national data for 127 countries. The results obtained by applying different statistical models show that alack of state capacity and low level of economic development cause poor quality in disaster preparedness which contribute more to disaster vulnerability rather than corruptionat the state level. Therefore, the donor agencies and international disaster risk reduction and mitigation agencies could focus on this issue in order to reduce loss of lives and financial damages. I. Introduction The number of natural disasters is growing these days and Bangladesh is listed as one of the hotspots for natural disasters. Bangladesh often and severely faces floods, cyclone and drought. Bangladesh has been rated to be the nation most at risk from extreme weather and geophysical events (Asia- OWSA, 2015). The history of disasters striking Bangladesh gives a devastating scenario with the country ranked Sixth out of 89 countries in terms of cyclone related hazards. Cyclones, in particular, have been a cause of serious concern as it has caused more devastation and death in Bangladesh than any other disaster. History shows that from 1891–2015 approximately 189 severe cyclones have caused extensive devastation, loss of livesand destruction of property. Cyclone Sidr is one of the most powerful cyclones to hit the South-western coast of Bangladesh with landfall since the 1990s. The category IV (Saffir Simpson Hurricane Intensity Scale) cyclone affected 30, of the 64 districts of Bangladesh. The devastating cyclone, termed a ‘super cyclone’ by Government of Bangladesh, registered a death toll of approximately 3406, with over 55,000 injured, and another 1,000 remained missing. The cyclone also affected two Indian states - West Bengal and Orissa. Taking Sidr effects as an example, this study will explore potential effect of corruption as economic obstacle with disaster vulnerability in order to investigate whether corruption, as an economic threat, affects disaster vulnerability. Natural disasters are not completely under human control but they can be mitigated. For instance, ensuring effective mitigation measures and building capacity of the local people, through dissemination of early warning at the right time. The disaster preparedness is economically more beneficial rather than investing in ‘response’. According to World Bank statistics (2011), “for every
- 2. IJRESS Volume 6, Issue 2 (February, 2016) (ISSN 2249-7382) International Journal of Research in Economics and Social Sciences (IMPACT FACTOR – 5.545) International Journal of Research in Economics & Social Sciences Email id: editorijrim@gmail.com, http://www.euroasiapub.org 256 1 dollar spent on preparedness, countries save $3 to$4 for every disaster strike. However,to increase efficiency of disaster management strategies, a core understanding of causalities to disaster vulnerability is critical and establishing a potential positive linkage among disaster vulnerability, poor governance and corruption to see things in the broader perspective is required A number of studies show that natural disasters cause greater loss to poorer countries than to developed countries (ISDR 2002; World Bank 2005; CRED 2007). Studies also show that richer countries appear to be less corrupt (Melissa, 2012). Though richer countries do not face less number of natural disasters, they do suffer from less number of deaths from disasters when they occur. This clearly indicates the need for improvement in the current Disaster Risk Reduction (DRR) approaches (ISDR 2004; UNDP 2004; DFID 2005).Moreover, DRR approaches should also be flexible enough to adapt to individual social and livelihood experiences. Hoppe (2007) shows that losses from natural disasters have increased dramatically since 1950’s. Studies also show that democracies and nations with higher quality institutions suffer fewer deaths from natural disasters (Kahn, 2003). Hapeman (2012) demonstrates that economic, social, and political factors increase the devastating impact of a natural disaster. Cohen and Werker (2008) argue that good governance is important to decrease loss in natural disasters. Kahn (2003) shows that countries with higher economic development, democracies and with higher quality institutions provide extra protection against natural disaster shocks. The World Bank and United Nations argue the same in 2010.A review by Dove and Khan (1995) shows that a lack of state capacity and poor governance worsens the disaster affects. Ohiduzzaman (1993) concludes that a lack of cautiousness and improper disaster management system worsens the condition after a natural hazard and creates unmanageable disaster conditions. Asquer (2011), Escaleras and Amnbarci (2006) argue that corruption is definitely an important factor for increasing number of deaths and damages in natural disasters. To lessen these damages, Juliet Sorensen (2014), advises that State and local level executives must include, in their disaster preparedness, laws, rules and punishment to address the increased opportunity for fraud and corruption. Thura (2013) and Cordis and Milyo (2013) reiterates this very argument saying corruption is an important factor which hinders both preparation and response to natural disasters. Sutton and Tierney (2006) show the concepts and methods used in assessing preparedness. Haque and Blair (1992) show that although a hazard warning process was helpful in pulling people out of immediate disasters, psychological issues like disbelief in the warning system, fear of burglary, and a lack of sufficient cyclone shelters are also responsible for greater loss. Studies show that disaster costs continue to rise and the demand has increased to demonstrate the economic benefit of DRR to policy makers (Shreve and Kelman, 2014). The review of existing literature reveals that very few academic works has been done exploring potential effect of corruption on disaster preparedness. Most of the studies in this stream have focused on political economy of natural disaster, and the rest are related to social impacts of natural disasters. Therefore, it is of great importance to explore a possible connection between poor governance and corruption and disaster vulnerability. Such study would be useful for both governments, if they are willing to reduce loss of lives and financial damages, and for international disaster risk reduction and mitigation agencies to rethink their current programmatic approach of targeting the recipients. Moreover, this study should also provide food for thought for donors to come up with such mechanisms as imposing conditionality while continuing bilateral partnerships with poorer partner nations. II. Conceptual framework State capacity and corruption are two of the major factors that affect disaster risk reduction and preparedness. A number of studies have shown that public sector corruption is one of the most important reasons for huge losses from natural disasters. In any economy, corruption is the source
- 3. IJRESS Volume 6, Issue 2 (February, 2016) (ISSN 2249-7382) International Journal of Research in Economics and Social Sciences (IMPACT FACTOR – 5.545) International Journal of Research in Economics & Social Sciences Email id: editorijrim@gmail.com, http://www.euroasiapub.org 257 for encouraging inefficiency, embezzlement of financial and other resources, wrongful allocation of scarce resources, increasing revenue losses, decreasing investment opportunities, privileging non- productive rent seeking activities, and fuelling up underdevelopment and distorted growths. These factors add up to construct poor governance, which in turn, affect state capacity. According to Olken, Benjamin and Rohini (2012) corruption can have efficiency consequences resulting in both direct and indirect losses. Another effect of corruption is that it increases the cost of government goods. This eventually increases prices of goods and services. As a result, this decreases government’s capacity and intention of providing low cost services to its people. On the contrary, indirect loss takes place when government officials do not steal directly but adopt other ways to extract money. Numerous academicians have also underlined a significant connection between economic growth and corruption (e.g. Pellegrini and Gerlagh, 2004). Studies have also found market openness to be lower in corruption-ridden countries than in corruption free countries. Begovic (2007) stipulates that a country with rampant corruption has international investors look for local partners as they are better informed and can significantly reduce the impact of corruption on their business (Habib and Zurawicki, 2001). Again, Smarzynska and Wei (2000) show that, when corruption is high, Foreign Direct Investment (FDI) takes the form of investment in production of low technology goods and services. Al Sadig (2009) concludes that, a 1% decline in corruption leads to a 20% increase in FDI. In light of the above discussion, corruption could be considered responsible for lowering economic growth and development. Additionally, one of the key factors for this low economic growth is the differences in state capacity. This eventually opens up the window for corruption, which, like a vicious circle, is responsible for widening this difference in governance and state capacity. The way this paper connects the issues of corruption and state capacity with disaster vulnerability is shown in diagram1, which explains, corruption and subsequent poor implementation affects a state’s capacity. Again, corruption at the institutional level produces low economic growth. Combined effect of these factors is reduced capacity of state to provide services as well as invest in social safety net programmes for its population. This lack of state capacity, then, results in greater number of deaths and financial damages. Looking only at the number of deaths and financial damages make disaster preparedness activities fall seriously short of their intended marks. Consequently, this paper argues that, efforts in mainstreaming disaster preparedness and strengthening emergency response as well as post-disaster reconstruction activities will not make the poor any less vulnerable. It is this institutional form of corruption and a lack of state capacity that needs to be tackled which has an over arching effect on all sectors including disaster preparedness. III. Data and Variables To this end, data have been collected in three levels – Level 1: Eight districts of Bangladesh Data on variables such as total number of death (total_death), level of financial losses (total_damage) (computed through damage of house, damage of cattle etc.) on eight Sidr affected Bangladesh districts (evident from figure 1) have been collected consulting relevant reports produced by Bangladesh Bureau of Statistics, reports from different international organisations, and news articles. Additionally, two hundred respondents have been interviewed from the eight districts with twenty-five respondents from each (25 x 8 = 200). Of the twenty-five, thirteen
- 4. IJRESS Volume 6, Issue 2 (February, 2016) (ISSN 2249-7382) International Journal of Research in Economics and Social Sciences (IMPACT FACTOR – 5.545) International Journal of Research in Economics & Social Sciences Email id: editorijrim@gmail.com, http://www.euroasiapub.org 258 affected people and twelve Red Crescent Youth (RCY) have been interviewed. Interviews have been conducted through specific questionnaires with affected people, who received emergency relief after cyclone Sidr, as well as RCY volunteers who are trained to work in various capacities in the aftermath of disasters. Affected people and RCY have been interviewed because, affected people could provide information on the recipient side of emergency relief operations, whereas RCYs offer voluntary services and can provide unbiased view about signs of institutional corruption as they have no financial stakes with respective branches of Bangladesh Red Crescent Society. The eight districts have been segregated into two clusters on the basis of severity (according to MoFDM): cluster 1 – those districts who were most affected from cyclone Sidr, namely: Pirojpur, Patuakhali, Barguna, Bagerhat; and cluster 2 – randomly selected four other other eight moderately affected districts, namely: Bhola, Barisal, Jhalkathi, Madaripur. Data on the following variables have been collected: being able to relocate to cyclone shelter (relocate), receiving relief (relief_status), receiving same relief items (same_rel), receiving cash relief (rec_cash), and amount of cash received as emergency relief (money), age of the respondent (age), gender (male), religion of the respondent (rel_Islam), size of household (fam_mem), status of vulnerability (vul_all), per capita income for respondent based on number of their family members (incoome_percapita), level of poverty (rich), injury, death, level of damage (most_damage), and presence of corruption (corrupt). Status of vulnerability has been decided based on respondents’ experience of being affected by five frequent disaster types: cyclone, flood, river erosion, earthquake, and land slide (most vulnerable are those who have suffered from all five disaster types, medium vulnerable are those who suffered from at most four but not less than three and low vulnerable are those who suffered from any of the three disaster types) and have been assigned to a scale. Level 2: Comparison between affected Bangladesh districts and two Indian states Since India has historically done much better in controlling corruption when juxtaposed against Bangladesh, a comparison drawn through data collected from Indian Planning Commission and other online resources enabled the authors to locate possible reasons behind different outcomes of the same disaster incident – cyclone Sidr. Level 3: Analysis of cross-national data from 127 countries For the purpose of analysing cross-national level data, total death and damage related data for year 2007 has been collected from disaster related database EMDAT. For level of corruption, ‘Corruption Perception Indexes’ (CPI) data for a period of 2001 till 2007 has been collected from Transparency International and computedas a moving average over the period. The remaining variables,namely, the six Worldwide Governance Indicators (WGI), per capita GDP, population density (total population divided by geographic area) have been taken from World Bank Data, and political stability and durabilitydata has been taken from Polity IV dataset. The six WGIs defined by Kaufmann etal. (2008) are: Government Effectiveness, Control of Corruption, Rule of Law, Regulatory Quality, Political Stability andAbsence of Violence, and Voice & Accountability. Again, a moving average of Polity score hasbeen computed for the period 2001 - 2007. Polity score is calculated by subtracting AUTOC (autocracy) score from DEMOC (democracy) score, the scale ranging between -10 to +10.
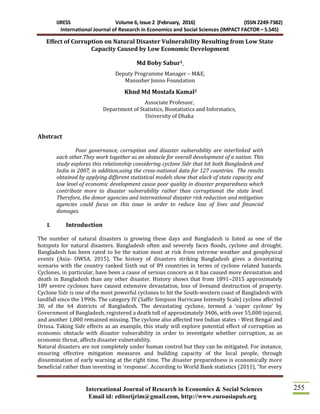
- 5. IJRESS Volume 6, Issue 2 (February, 2016) (ISSN 2249-7382) International Journal of Research in Economics and Social Sciences (IMPACT FACTOR – 5.545) International Journal of Research in Economics & Social Sciences Email id: editorijrim@gmail.com, http://www.euroasiapub.org 259 IV. Methodology To meet the objectives, this study approaches the issue through following research question: What factors contribute towards disaster vulnerability? The Null-hypothesis of this paper is – H0: A lack of state capacity and low level of economic development prevent investment towards public services. What follows from this is, poor quality in disaster preparedness and a greater loss of lives and financial damages. H1: Instead of lack of state capacity and low level of economic development, corruption at the institutional level (political and bureaucratic) is a key contributor towards disaster vulnerability. Different regression modelshave been used to examine the effect of corruption on vulnerable population. The dependent variable Y is a binary variable; therefore, logistic regression approach has been used. The regression model takes the form: )(1 )( )1( XExp XExp YP , Where, X is a set of independent variables.The outcome variables (Y) for different modelsare: same_rel (1: If affected people received same relief as others, 0: Otherwise), relocate (1: If affected people were able to relocate to cyclone shelter, 0: Otherwise), rel_status (1: If religion created a bias in getting relief, 0: Otherwise) and rec_cash (1: If they received cash among other relief items, 0: Otherwise). However, another outcome variable namely amount of money received being a quantitative variable, has been regressed on the same list of independent variables as multiple regression models. Additionally, at cross-national level data total death and total damage have been regressed as: )1.(....................___ __2007_log_)_log( 876 54321 aaccvoicrlawofruleregulatory stabilpoleffectgovCPIpolitygdpdeathtotal )1.(....................___ __2007_log_)_log( 876 54321 baccvoicrlawofruleregulatory stabilpoleffectgovCPIpolitygdpdamagetotal Two different types of corruption measures have been used in this study – moving average of CPI by Transparency International between 2001 until 2007, and Control of Corruption from the WGI (World Bank). In successive regressions, two separate types of corruption measures have been used to capture whether they might yield different impacts, as calculation of control of corruption might influence outcome when regressed with other WGIs. V. Results and Discussions There are reports of mismanagement of emergency relief connecting local politicians and their nepotism in the aftermath of cyclone Sidr (“Bangladesh - Aftermath of a Cyclone” 2015). This is not an isolated phenomenon. Other researchers have also unearthed similar findings, for instance, about 99% of households suffered from corruption before and after Cyclone Aila (Mahmud and Prowse, 2012). This is credited to Bangladesh’s status of a country, which is still under transition, both politically and economically. Political situation of the country is still far from being stable. This has increased not only corruption but also hinders regular capacity building efforts. This could be evidenced from figure 2.
- 6. IJRESS Volume 6, Issue 2 (February, 2016) (ISSN 2249-7382) International Journal of Research in Economics and Social Sciences (IMPACT FACTOR – 5.545) International Journal of Research in Economics & Social Sciences Email id: editorijrim@gmail.com, http://www.euroasiapub.org 260 Figure 2: Political Stability Index for Bangladesh Source: The World Bank With careful consideration of the six WGIs, it would be clear that Bangladesh is not doing too well and is constantly being placed in the bottom quarter. However, Bangladesh seems to be enjoying a slightly upward growth in most of the above indicators in recent times. Transparency International’s (TI) CPI also shows the same picture. Bangladesh was ranked the most corrupt country in the world by TI with score ranging from 91 to 158 from the year 2001 until 2005. Since then, however, it showed some improvements in the corruption ranking and in 2013 is placed at the 16th position. With the objective of exploring whether corruption plays a significant role in exacerbating disaster vulnerability or whether a lack of state capacity is the main culprit, this study approaches to test the hypothesis in three levels - Level1: Affected districts (Most Affected vs Medium affected) of Bangladesh Table1 presents the logistic regression results for affected districts compared to medium affected districts based on data from affected people. From Table1, it is clear that, in case of the first model where receiving same relief has been used as a dependent variable, the likelihood ratio - chi-square of 96.14 with a p-value less than 0.000 indicates that the model as a whole fits significantly better than an empty model (i.e., a model with no predictors). Similar results follow for other models where the dependent variables are: receiving emergency relief as cash, ability of relocating and receiving relief or not respectively. -0.61 0.00 -0.45 0.00 -0.77 0.00 -1.08 -1.14 -1.38 -1.84 -1.48 -1.5 -1.48 -1.54 -1.4 -1.39 -1.35 -1.61 1996 1997 1998 1999 2000 2001 2002 2003 2004 2005 2006 2007 2008 2009 2010 2011 2012 2013 Political Stability Index
- 7. IJRESS Volume 6, Issue 2 (February, 2016) (ISSN 2249-7382) International Journal of Research in Economics and Social Sciences (IMPACT FACTOR – 5.545) International Journal of Research in Economics & Social Sciences Email id: editorijrim@gmail.com, http://www.euroasiapub.org 261 Table 1a: Estimated Logistic regression results Dependent variables Models 1 2 3 4 Independent variables same_rel rec_cash relocate relief_status Odds Ratio age 0.872 (1.92) 1.098** (2.16) 0.981 (0.54) 1.157* (1.88) male 1.125 (0.08) 0.470 (0.93) 0.534* (1.89) 3.193 (0.76) rel_Islam 1.624 (0.34) 1.698 (0.73) 0.685 (0.57) 2.769 (0.66) fam_ mem 1.635 (0.88) 0.472** (2.33) 0.556* (2.07) 0.560 (1.25) vul_all 2.714 (0.58) 2.764 (1.20) 0.954 (0.05) 4.039 (1.04) income_ percapita 0.998* (2.08) 0.999* (1.86) 1.001 (0.94) 0.997** (2.57) rich 0.015 (1.80) 0.493 (0.49) 245.44* (1.86) injury 1.119 (0.08) 0.527 (0.90) 0.512 (0.98) 0.508 (0.45) death 0.492 (0.17) 0.095 (1.27) 0.170 (1.20) most_damage 0.982 (0.01) 0.124* (1.73) 1.182 (0.14) damage 0.573 (0.46) 0.521 (0.96) 0.585 (0.86) 0.312 (0.85) corrupt 0.008** (4.40) 0.341 (1.59) 0.439 (1.32) 0.030** (2.14) most_affected 2.449 (0.73) 2.248 (1.18) 1.828 (1.05) 0.218 (1.25) LR (χ2) 96.14 28.55 21.94 34.06 Pr(χ2) 0.0000 0.0076 0.0382 0.0004 log Likelihood -16.034 -39.653 -45.691 -15.479 N 100 100 97 100 Note: Z- Statistics are in parentheses. *p<0.10; ** p<0.05; *** p<0.01 In the first model, per capita income and corruption show statistically significant effect on receiving same relief. Therefore, it could be said that presence of corruption, defined by nepotism, bribe and embezzlement, showing negative statistical significant effect on receiving same types of emergency relief and getting no relief at all at 5% level. Effect of corruption is higher for most affected districts compared to medium affected districts. Estimated result shows that for a one-unit increase in corruption, the odds of receiving same relief (versus not receiving same relief as cash money) decreases by a factor of 0.992 (=1- 0.008) i.e. one additional unit of corruption decreases chance of getting same relief by 99.2%. Similarly, for a one-unit increase in per capita income, the odds of receiving same relief as cash money (versus not being received same relief as cash money) decreases by a factor of 0.002 (=1- 0.998) i.e. with one-unit higher per capita income decreases the chance of receiving same relief by 0.02%. Likewise, variables such as - age, number of family members, per capita income and most damage have significant effect on receiving emergency relief as cash money. Interestingly, however, households with more damage, identified by their damage of house, crops, and cattle, tended to get more of cash relief in most affected districts compared to medium affected districts.Whereas most damaged households in medium affected districts actually received less cash relief. Being male, the regression shows, is negatively correlated with relocation at 10% significance level. This means that women were given more preference while being relocated. Number of family members also plays significant role with relocation. Relatively better-off households also faced biased treatment with relief status. In addition, age, per capita income and corruption also play significant role for relief status. For age variable the estimated result indicates if age increases by one-year, the odds of being received relief (versus not being received relief) increases by a factor of 0.157 (=1.157- 1) i.e. one year older has 15.7% higher chance to receive relief.
- 8. IJRESS Volume 6, Issue 2 (February, 2016) (ISSN 2249-7382) International Journal of Research in Economics and Social Sciences (IMPACT FACTOR – 5.545) International Journal of Research in Economics & Social Sciences Email id: editorijrim@gmail.com, http://www.euroasiapub.org 262 Table1b: Logistic regression results for RCY data Dependent Variables Independent variables LR (χ2 ) Pr(χ2) N log Likelih ood unit_res p_ plan shelter_m gt_plan maltre atment corru pt affected districts same_re l Odds Ratio 0.089 (2.82)** * 7.550 (3.39)*** 0.592 (0.86) 1.364 (0.42) 0.466 (1.81)* 28.62 0.000 97 -43.98 relocate 1.454 (0.69) 2.123 (1.48) 1.905 (1.11) 1.142 (0.19) 5.560 (3.50)*** 23.5 0.000 97 -54.85 Note: Z- Statistics are in parentheses. *p<0.10; ** p<0.05; *** p<0.01 The results discussed above, in lights of Table:1a, are further emphasised by regression results in Table:1b. With vulnerable people in medium affected districts, Table:1b show that the vulnerable received less cash amount as relief. Intuitive explanation of this could be that members from the poorest strata were easy to leave out while distributing cash relief in medium affected districts compared to most affected districts. Media presence, national and international attention may also have instigated this result. However, these results are not supportedby RCY volunteer responses (Table1b). Explanation of this could be that since they were involved in the relief distribution process, and has realistic idea about how much cash and relief items flowed in and criteria for being considered for receiving cash relief, they did not site corruption to be a major cause. Using OLS, the estimated model for amount of money received by the affected people is presented in Table1c. As earlier, the model has beenestimated for both clusters of most affected districts and medium affected districts. Table1c: Regression results for amount of money received model Cslusters age male rel_islam fam_ mem vul_all income_ percapita rich injury most_d amange most_a ffected corrupt R2 Coefficients most affected 27 (35) 1019 (715) 857 (612) -37 (256) -236 (789) 0.41 (0.49) 1942 (1142) 169 (863) 984 (1285) 1065* (591) 51 (859) 0.49 medium affected -.48 (35) -20 (715) -32 (612) -26 (256) 3199*** (798) -.79*** (.385) 1340*** (441) 95 (341) ------- 760 (561) 1938*** (548) 0.79 Note: Standard errors are in parentheses. *p<0.10; ** p<0.05; *** p<0.01 From estimated money equation in Table1c, it could be said that, for the most affected districts, damage is a determinant for amount of money affected people receive in cash as emergency relief. While, for medium affected districts, vulnerability, rich and corruption play a significant role in determining the amount of money the affected people received in cash as emergency relief. Therefore, it could be concluded that when it comes to the affected people, they tend to blame it broadly on the relief distribution officials’ corruption. Level 2: The case of India (West Bengal and Orissa) India and Bangladesh both suffered the wrath of cyclone Sidr on 15th November 2007. The cyclone hit both countries. However, there were huge differences regarding loss and damage between the two countries.
- 9. IJRESS Volume 6, Issue 2 (February, 2016) (ISSN 2249-7382) International Journal of Research in Economics and Social Sciences (IMPACT FACTOR – 5.545) International Journal of Research in Economics & Social Sciences Email id: editorijrim@gmail.com, http://www.euroasiapub.org 263 Table 3: Relative information on the two states of India District Death count Population Density (sq. km.) 2001 Absolute increase2001 % Poor 2005 West Bengal 0 903 58 34.3 Orissa 0 236 58 57.2 Preparedness by India and Bangladesh also differed in respective capacity and planning.India had a much higher level of preparedness. For instance, after the warning was disseminated by the Indian Meteorological Department, thousands of people along the coast in both the states were evacuated to cyclone shelters. They were kept in these shelters until the warning was called off. Additionally, the fishermen were advised to stay clear of the coastline in both states. The cyclone, which built up in the Bay of Bengal, crossed the states of Orissa and West Bengal in India before reaching Bangladesh. No deaths were reported from the state, but houses and standing crops were destroyed in the coastal areas (Table3), whereas, Bangladesh suffered heavy losses both in terms of finance and human lives. This difference is understandable as the two countries differ hugely in their state capacity and governance indicator measurements. Figure 3: WGIs: India Vs Bangladesh Figure 4: HDI: India Vs Bangladesh Figure3 & figure4 present comparison between the state capacity of India and Bangladesh. Figure3 presents a contrast between Bangladesh and India as they performed in 2007 following the six governance indicators used by the World Bank. All the indicators show that India performed much better than Bangladesh in all areas of governance. This is an indicator of India’s greater state capacity and explains why India was much less vulnerable during the natural disaster of 2007. Figure4 presents Human Development Index of two countries and shows that India has consistently performed much better than Bangladesh. This also indicates that the state capacity of India is indeed much stronger compared to Bangladesh, which has helped them prepare better. Level 3: Cross-national data Using six different WGI measures successively in the equation 1a and 1b and applying ordinary least squares estimation technique on cross-national data, the models developed in equations 1a and 1b have been estimated and the results have been presented in Table4 and Table5 respectively. From the regression results presented in table4 and table 5 it is found that, GDP has significant positive effect on both total death and total damage, which means that there will be more deaths and more damage with higher GDP. For total death, this effect is statistically significant at 10% level, while the effect is statistically significant at 1% level when total damage is used as dependent variable. 0 20 40 60 Worldwide Governance Indicators Bangladesh India 0.3 0.35 0.4 0.45 0.5 0.55 0.6 0.65 1970 1980 1990 2000 2010 2020 Human Development Index Bangladesh India Year S c o r e
- 10. IJRESS Volume 6, Issue 2 (February, 2016) (ISSN 2249-7382) International Journal of Research in Economics and Social Sciences (IMPACT FACTOR – 5.545) International Journal of Research in Economics & Social Sciences Email id: editorijrim@gmail.com, http://www.euroasiapub.org 264 Table4: Regression result results for totaldeath presented in equation 1a. Corruption Perception Index by Transparency International Control of Corruption from the World Bank Models 1 2 3 4 5 1 2 3 4 5 variables Coefficients Coefficients log_gdp~200 7 0.138* (0.061) 0.122* (0.054) 0.146* (0.062) 0.142* (0.058) 0.144* (0.057) 0.128*** (0.060) 0.125*** (0.055) 0.140*** (0.061) 0.143*** (0.057) 0.150*** (0.057) Polity -0.016 (0.013) 0.000 (0.013) -0.015 (0.013) -0.014 (0.013) -0.011 (0.013) -0.014 (0.013) 0.000 (0.013) -0.014 (0.013) -0.015 (0.013) -0.011 (0.013) cpi_moving~ g -0.309 (0.186) -0.054 (0.130) -0.279 (0.162) -0.229 (0.199) -0.224 (0.136) -1.279* (0.699) -0.147 (0.081) -0.931* (0.523) -1.192 (0.734) -0.629 (0.581) gov_effect~s -0.089 (0.419) 0.541 (0.553) pol_stabil~e -.94*** (0.264) -0.91** (0.281) regulatory~y -0.196 (0.382) 0.158 (0.458) rule_of_law -0.293 (0.434) 0.412 (0.661) voice__acc~y -0.415 (0.299) -0.246 (0.350) _cons 0.741 (1.743) -0.160 (1.266) 0.422 (1.698) 0.276 (1.666) 0.233 (1.389) -0.362 -0.459 -0.642 -0.681 -0.869 R-sqr 0.106 0.190 0.107 0.109 0.119 0.127 0.191 0.121 0.123 0.124 Standard errors in brackets*** p<0.01, ** p<0.05, * p<0.1 Table5: Regression result results for total damage presented in equation 1b Corruption Perception Index by Transparency International Control of Corruption from the World Bank Models 1 2 3 4 5 1 2 3 4 5 variables Coefficients Coefficients log_gdp~2007 0.424** (0.15) 0.514*** (0.15) 0.540*** (0.158) 0.504*** (0.15) 0.529*** (0.15) 0.400* (0.15) 0.506*** (0.15) 0.541*** (0.16) 0.500** (0.15) 0.516*** (0.15) Polity -0.000 (0.03) 0.011 (0.04) 0.013 (0.04) 0.006 (0.03) 0.017 (0.04) -0.000 (0.03) 0.007 (0.04) 0.008 (0.03) 0.003 (0.03) 0.015 (0.03) cpi_moving~g / control of corruption 0.149 (0.47) 0.806* (0.35) 0.900* (0.42) 0.627 (0.51) 0.929** (0.35) -1.064 (1.36) 1.621* (0.81) 2.049 (1.10) 0.883 (1.71) 2.250* (0.89) gov_effect~s 1.740 (1.06) 3.014* (1.42) pol_stabil~e -0.083 (0.710) -0.097 (0.761) regulatory~y -0.374 (0.980) -0.647 (1.189) rule_of_law 0.397 (1.113) 0.719 (1.718) voice_acc~y -0.522 (0.771) -0.952 (0.907) _cons -4.92 (4.42) -9.91** (3.41) -10.89* (4.35) -8.83* (4.27) -10.75** (3.58) -3.78 (3.74) -6.33 (3.62) -7.12 (3.86) -6.11 (3.66) -6.53 (3.59) R-sqr 0.253 0.236 0.237 0.237 0.239 0.256 0.228 0.230 0.229 0.235 Standard errors in brackets*** p<0.01, ** p<0.05, * p<0.1 However, this result conflicts with results found by UNDP in their report Linking Disaster Risk Reduction and Poverty Reduction (2008) which prescribed reduction of poverty as a method for reducing disaster vulnerability, arguing – “94.25% of all people killed by disasters between 1975 and 2000 were from low income or lower-middle income strata.” (Bara 2010). Intuitively, it could be argued that as there is fair distribution of wealth and overall a greater amount of wealth in the country, total damage tends to increase compared with countries with low wealth, which tends to lesser loos from disaster strikes.
- 11. IJRESS Volume 6, Issue 2 (February, 2016) (ISSN 2249-7382) International Journal of Research in Economics and Social Sciences (IMPACT FACTOR – 5.545) International Journal of Research in Economics & Social Sciences Email id: editorijrim@gmail.com, http://www.euroasiapub.org 265 While regressing with total damage as dependent variable, as could be seen from table 5 that both measures of corruption control, i.e. CPI moving average by Transparency International and Control of Corruption by WGI show significance at 10% and 5% levels respectively. Both variables indicate similar effects, that is, increase in corruption control measure contributes towards an increase in total damage. Intuitive explanation for this could be that with better corruption control there is better distribution of wealth, consequently households report more damage as they had their fair share of wealth. However, corruption control and GDP measures are different for developed and developing countries. Considering this fact the model has been further emphasized for developed and developing countries separately and the analysis results have been presented in Table6a and Table6b. Table6a: Regression results for total death and total damage (for developed countries) VARIABLES log(Total Damage) log(Total Death) Coefficients CPI (Moving Average) 0.445 (0.551) -0.19 (0.16) Corruption Control 0.305 (1.08) - 1.978 (2.74) - 2.111 (2.767) -1.805 (3.147) -0.286 (.320) - 1.346 (0.799) - 1.82** (0.77) - 1.294 (.824) Government Effectiveness 3 .517 (3.10) - 1.382 (3.907) - 2.001 (4.22) 1 .326 (0.901) - .858 (1.09) - 1.141 (1.106) Political Stab& Abs of Viol - 1.543 (2.69) - 2.946 (2.656) - 2.117 (3.189) . 095 (0.782) - .618 (0.74) . 106 ( .835) Regulatory Quality - .896 (3.135) - 1.198 (3.768) . 354 (0843) - .344 (.987) Rule of Law 7 .802** (3.661) 7 .532** (4.199) 2 .879** (1.02) 2 .231** (1.10) Voice & Accountability - 2.427 (1.845) - 2.307 (2.98) - .414 (052) . 288 (.780) log(GDP per capita, 2007) 0.454 (0.896) 0.409* (.235) Polity (Moving Average) .045 (.475) -.100 (.0124) Constant 6.587 9.125 8.57 9.995 -2.118 3.43 2.475 1.988 -7.538 Observations 29 29 29 29 29 29 29 29 29 29 R-squared 0.023 0.003 0.06 0.326 0.336 0.047 0.028 0.103 0.409 0.485 Standard errors in brackets*** p<0.01, ** p<0.05, * p<0.1 From the regression results presented in table6a, we can see that in the developed world, effective corruption control leads to lesser number of deaths from disasters. This effect is statistically significant at 5% significance level. Table6a, however, shows an apparent discrepancy in that effective rule of law contributes towards an increase of total number of deaths. The analysis for developing countries is presented in Table6b. From the table, it is clear that, for developing countries, both Political Stability and Control of Corruption have negative effects on total death due to disasters and this effect is statistically highly significant at 1% level. Therefore, increase in corruption control index and increase in political stability contributes towards lesser number of deaths. A 1-point increase in political stability index contributes towards 0.92 less death from natural disasters.
- 12. IJRESS Volume 6, Issue 2 (February, 2016) (ISSN 2249-7382) International Journal of Research in Economics and Social Sciences (IMPACT FACTOR – 5.545) International Journal of Research in Economics & Social Sciences Email id: editorijrim@gmail.com, http://www.euroasiapub.org 266 Table6b: Regression results for total death and total damage (for developing countries) VARIABLES log(Total Damage) log(Total Death) Coefficients CPI (Moving Average) 1.279** (.498) -.45** (.21) Corruption Control 2.612*** (0.809) 1 .341 (1.25) 2 .14* (1.32) . 452 (1.25) -.758** (0.338) - .040 (.51) - .052 (.547) - .552 (.540) Government Effectiveness 1 .99** (.103) 2 .99** (1.24) . 960 (1.14) . 058 (.42) - .080 (.514) - .818 (.495) Political Stab& Abs of Viol - .410 (.728) . 093 (.78) 1 .39** (.737) - .92*** (.297) - .94*** (.323) - .445 (.320) Regulatory Quality 1 .25 (1.24) - .700 (1.15) . 322 (.514) - .186 (.500) Rule of Law - 2.54* (1.53) - 1.416 (1.38) . 120 (.634) . 700 (.597) Voice & Accountability - 1.14 (1.04) - .640 (.936) - .273 (.434) - .190 (.405) log(GDP per capita, 2007) 1.81*** (.312) 0.614*** (0.135) Polity (Moving Average) 0.46 (.032) 0.019 (0.014) Constant .396 5.674 5.763 5.55 -38.50 4.4 2.63 2.52 2.534 -12.13 Observations 96 96 96 96 89 96 96 96 96 89 R-squared 0.065 0.099 0.135 0.175 0.414 0.048 0.050 0.139 0.146 0.296 Standard errors in brackets*** p<0.01, ** p<0.05, * p<0.1 Whereas, a 1-point increase in corruption control contributes towards 0.93 to 1.28 less death from natural disasters. It is also found that governance effectiveness shows a positive effect on total death and total damage. The effect is statistical significant at 10% level, indicating a 1-point increase in governance effectiveness leading to a 3-point increase in total damage. However, results presented in table6b, are more in line with the argument of this research. Here, it is evident that both government effectiveness and political stability and absence of violence are statistically highly significant at up to 1% significance level when regressed together with the other WGI indicators. Government effectiveness contributes towards more damage and political stability and absence of violence leads towards less number of deaths. Therefore, from the analysis of cross-national data, it is clear that the results support the null hypothesis of this paper, which states - a lack of state capacity, contributes more to disaster vulnerability, against the popular notion of corruption being the main culprit. With higher GDP, we have higher damage. Similarly, with better control of corruption and effective form of governance, we have more damage. Conclusion This paper explores one aspect of disaster vulnerability - what affects most: corruption or state capacity. The study analyses the factors that contribute towards disaster vulnerability taking Bangladesh as a specific case and using cyclone Sidr to compare between Bangladesh and India. Bangladesh has been a case of poor governance, corruption and inefficiency, which have produced a fragmented and disoriented state. Bureaucratic politics has made institutions less transparent, which eventually is giving rise to major corruption and scams. Nepotism and clienteles are other two such factors which eroded the economy from the core, thus initiating practice of corruption in all possible sectors. Being a disaster prone country, Bangladesh must acknowledge and address the
- 13. IJRESS Volume 6, Issue 2 (February, 2016) (ISSN 2249-7382) International Journal of Research in Economics and Social Sciences (IMPACT FACTOR – 5.545) International Journal of Research in Economics & Social Sciences Email id: editorijrim@gmail.com, http://www.euroasiapub.org 267 relationship between institutional corruption and natural disasters at all levels of government to mitigate losses and deaths. In general, the study shows that corruption and state capacity are the two factors, which affect disaster preparedness and relief actions in multiple ways. The analysis shows that when it comes to the affected people, they tend to blame it on the relief distribution officials and their corruption. Regression results suggest statistically significant association between relief officials and corruption, while it is needed to discount for the fact that there is a time gap of eight years between cyclone Sidr (2007) and when the data was being collected, also being mindful about the fact that general psyche of the affected is to blame it on corrupt officials. For instance, not every household requires the same relief items, and a failure to receive the same relief items may have been considered as biased treatment and signs of corruption. From the regressions of cross-national data, we cannot reject the null hypothesis and conclude that a lack of state capacity contributes more towards increasing disaster vulnerability and not corruption. There is huge scope for research in this area of disaster risk reduction since exploring the relation between disaster vulnerability and corruption at the state level is fairly new. References Alam, Edris, and Andrew E. Collins. 2010. “Cyclone Disaster Vulnerability and Response Experiences in Coastal Bangladesh.” Disasters 34 (4): 931–54. Alcantara-Ayala, Irasema. 2002. “Geomorphology, Natural Hazards, Vulnerability and Prevention of Natural Disasters in Developing Countries.” Geomorphology, Geomorphology in the Public Eye: Political Issues, Education, and the Public, 47 (2–4): 107–24. Al-Sadig, A. (2009), “The Effects of Corruption on FDI Inflows”, Cato Journal, 29 (2). “Asia: Most Vulnerable to Natural Disasters — OWSA: OneWorld South Asia - Latest News on Sustainable Development, Features, Opinions, Interviews with NGO Leaders and Multimedia from India and South Asia.” 2015. Asquer, Raffaele. 2011. “The Deadly Effects of Corruption: A Cross-National Study of Natural Disasters, 1980-2010.” Qualifying Field Paper. Los Angles, United States: University of California at Los Angles. Cordis, Adriana, and Jeff Milyo. 2013. “Don’t Blame the Weather: Federal Natural Disaster Aid and Public Corruption | Mercatus,” Winthrop University, the USA. Cohen, Charles, and Eric Werker. 2008. “The Political Economy of “Natural” Disasters.” The Journal of Conflict Resolution 52:795-819. CRED (Centre for Research in the Epidemiology of Disasters) (2007) 'EM-DAT 2007: The OFDA/CRED International Disaster Database'. UniversitéCatholique de Louvain, Brussels. http://www.em-dat.net (accessed on 22 April 2007). DFID (Department for International Development) (2005) Disaster Risk Reduction: A Development Concern. Policy Briefing Paper. DFID, London. Dove, M.R. and M.H. Khan (1995) ‘Competing constructions of calamity—the April 1991 Bangladesh cyclone’. Population and Environment: A Journal of Interdisciplinary Studies. 16(5). pp. 445–471. Escaleras, Monica, NejatAnbarci, and Charles Register. 2006. “Public Sector Corruption and Natural Disasters: A Potentially Deadly Interaction.” Working Paper 06005. Department of Economics, College of Business, Florida Atlantic University. Habib, M. and L. Zurawicki (2001), “Country-level Investments and the Effect of Corruption –Some Empirical Evidence”, International Business Review, 10, 687-700. Hapeman K. (2012). The Effects of Politics on Natural Disasters: Lessons Learned from Bangladesh, Case-Specific Briefing Paper, Humanitarian Aid in Complex Emergencies. University of Denver. Haque, C. and Blair, D. (1992). Vulnerability to tropical cyclones: evidence from the April 1991 cyclone in coastal Bangladesh, Disasters 16(3): 217–229.
- 14. IJRESS Volume 6, Issue 2 (February, 2016) (ISSN 2249-7382) International Journal of Research in Economics and Social Sciences (IMPACT FACTOR – 5.545) International Journal of Research in Economics & Social Sciences Email id: editorijrim@gmail.com, http://www.euroasiapub.org 268 Hoppe M. H. (2007). "Culture and Leadership across the World: The GLOBE Book of In-Depth Studies of 25 Societies" School of Business, University of Pennsylvania, USA. ISDR (International Strategy for Disaster Reduction) (2002) Disaster Risk and Sustainable Development: Understanding the Links between Development, Environment and Natural Hazards Leading to Disasters. Background document for the World Summit on Sustainable Development. ISDR, Geneva. Kahn, P.H. Jr. and Kellert, S.R. (Eds.) (2002). Children and Nature: Psychological, Sociocultural, and Evolutionary Investigations. MIT Press, Cambridge, MA. Kaufmann, Daniel, AartKraay, and Pablo Zoido-Lobaton, 1999a, Governance Matters, Washington, DC: The World Bank, Policy Research Working Paper no. 2196. Kaufmann, Daniel, AartKraay, and Pablo Zoido-Lobaton, 1999b, Aggregating Governance Indicators, Washington, DC: The World Bank, Policy Research Working Paper no. 2195. Mahmud, Tanvir, and Martin Prowse. (2012a). “Corruption in Cyclone Preparedness and Relief Efforts in Coastal Bangladesh: Lessons for Climate Adaptation?” Global Environmental Change 22 (4): 933–43. Mahmud, Tanvir, and Martin Prowse. (2012b). “Corruption in Cyclone Preparedness and Relief Efforts in Coastal Bangladesh: Lessons for Climate Adaptation?” Global Environmental Change 22 (4): 933–43. Melissa Dell, Benjamin F. Jones, and Benjamin A. Olken (2012). “Temperature Shocks and Economic Growth: Evidence from the Last Half Century”, American Economic Journal: Macroeconomics 2012, 4(3): 66–95. Miyan, M Alimullah.n.d. “CYCLONE DISASTER MITIGATION IN BANGLADESH.” South Asian Disaster Management Center (SADMC) IUBAT—International University of Business Agriculture and Technology Dhaka, Bangladesh. Ohiduzzaman, Md. (1993) Socio-economic and Environmental Effects of the 1991 Cyclone in Coastal Bangladesh: A Local Level Analysis. Unpublished Masters in Urban and Regional Planning (MURP) thesis, Bangladesh University of Engineering and Technology (BUET), Dhaka. Olken, B. A. and Rohini P. (2012) "Corruption in Developing Countries." Annual Review of Economics, 4:479–509. Pellegrini, L. and Gerlagh, R. (2004), Corruption's Effect on Growth and Its Transmission Channels. Kyklos, 57 (3), 429-56. Samphantharak, K. &Malesky, E. (2008). "Predictable Corruption and Firm Investment: Evidence from a Natural Experiment and Survey of Cambodian Entrepreneurs", Quarterly Journal of Political Science, 3 (3): 227-267. Shreve, C.M. and I. Kelman. 2014. “Does mitigation save? Reviewing cost-benefit analyses of disaster risk reduction”. International Journal of Disaster Risk Reduction, vol. 10, part A, pp. 213-235. Smarzynska, B. and S.J. Wei (2000), “Corruption and the Composition of Foreign Direct Investment: Firm-level Evidenc Sorensen J. (2014). “Why Are Natural Disasters Breeding Grounds For Corruption?” Talking Points Memo, March 3. Sutton, Jeannette, and Kathleen Tierney. 2006. “Disaster Preparedness: Concepts, Guidance, and Research.” Natural Hazards Center Institute of Behavioral Science University of Colorado Boulder, CO Thura, Nadia. (2013). “Natural Disasters, Political Corruption, and a Culture of Resilience in the Philippines.” December 18. Tobin, G. A., and Montz, B. E. 1997. Natural Hazards: Explanation and Integration. New York: Guilford Press. UNDP (United Nations Development Programme) (2004) Reducing Disaster Risk: A Challenge for Development. Bureau of Crisis Prevention and Recovery, UNDP, New York, p. 146.
- 15. IJRESS Volume 6, Issue 2 (February, 2016) (ISSN 2249-7382) International Journal of Research in Economics and Social Sciences (IMPACT FACTOR – 5.545) International Journal of Research in Economics & Social Sciences Email id: editorijrim@gmail.com, http://www.euroasiapub.org 269 World Bank, 2011. Natural Hazards, UnNatural Disasters: The Economics of Effective Prevention. World Bank, Washington DC,p-280. World Bank (2015). “Infographic: East Asia Pacific – A Region At Risk.” Strong, Safe and Reseilient: A Strategic Guide for Disaster Risk Management in East Asia and the Pacific. Worldwide Governance Indicators, (2014). Knoema. http://knoema.com/WBWGI2014/worldwide-governance-indicators-2014?country=1000160- bangladesh. Zafarullah, Habib, and Redwanur Rahman. (2008). “The Impaired State: Assessing State Capacity and Governance in Bangladesh: International Journal of Public Sector Management: Vol 21, No 7” 21 (7): 739–52.