SlideShare una empresa de Scribd logo
1 de 33
Bay of Bengal WINGCRAFT
BoB WING CRAFT
Asking 100% Financing
Further Query: Hafiz, seekinvestor2007@yahoo.com
Legal Page
Confidentiality Agreement
The undersigned reader acknowledges that the information provided by Bay of Bengal
WINGCRAFT. in this business plan is confidential; therefore, reader agrees not to disclose it without
the express written permission of Hafizul Haque.
It is acknowledged by reader that information to be furnished in this business plan is in all respects
confidential in nature, other than information which is in the public domain through other means
and that any disclosure or use of same by reader, may cause serious harm or damage to Bay of
Bengal WINGCRAFT.
Upon request, this document is to be immediately returned to Hafizul Haque.
___________________
Signature
___________________
Name (typed or printed)
___________________
Date
This is a business plan. It does not imply an offering of securities.
Table of Contents
Page 1
1.0 Executive Summary .................................................................................................................... 1
Chart: Highlights .......................................................................................................................... 1
1.1 Objectives.................................................................................................................................... 2
1.2 Mission.......................................................................................................................................... 2
1.3 Keys to Success ........................................................................................................................ 2
2.0 Company Summary..................................................................................................................... 2
2.1 Company Ownership............................................................................................................... 3
2.2 Start-up Summary................................................................................................................... 3
Table: Start-up.............................................................................................................................. 4
Chart: Start-up.............................................................................................................................. 4
3.0 Products ........................................................................................................................................... 5
4.0 Market Analysis Summary ........................................................................................................ 5
4.1 Market Segmentation............................................................................................................. 6
Table: Market Analysis............................................................................................................... 6
Chart: Market Analysis (Pie).................................................................................................... 6
4.2 Target Market Segment Strategy...................................................................................... 7
4.3 Industry Analysis...................................................................................................................... 7
4.3.1 Competition and Buying Patterns .............................................................................. 7
5.0 Strategy and Implementation Summary ............................................................................ 7
5.1 Competitive Edge ..................................................................................................................... 8
5.2 Marketing Strategy.................................................................................................................. 8
5.3 Sales Strategy........................................................................................................................... 9
5.3.1 Sales Forecast.................................................................................................................... 9
Table: Sales Forecast ............................................................................................................. 9
Chart: Sales Monthly............................................................................................................ 10
Chart: Sales by Year............................................................................................................. 10
5.4 Milestones.................................................................................................................................. 11
Table: Milestones........................................................................................................................ 11
Chart: Milestones ....................................................................................................................... 11
6.0 Management Summary............................................................................................................ 12
6.1 Personnel Plan......................................................................................................................... 13
Table: Personnel......................................................................................................................... 13
7.0 Financial Plan............................................................................................................................... 13
7.1 Start-up Funding .................................................................................................................... 14
Table: Start-up Funding.......................................................................................................... 14
7.2 Important Assumptions ....................................................................................................... 15
7.3 Break-even Analysis.............................................................................................................. 15
Table: Break-even Analysis.................................................................................................... 15
Chart: Break-even Analysis ................................................................................................... 16
7.4 Projected Profit and Loss..................................................................................................... 17
Table: Profit and Loss............................................................................................................... 17
Chart: Profit Monthly ................................................................................................................ 18
Chart: Profit Yearly.................................................................................................................... 18
Chart: Gross Margin Monthly................................................................................................. 19
Table of Contents
Page 2
Chart: Gross Margin Yearly.................................................................................................... 19
7.5 Projected Cash Flow.............................................................................................................. 20
Table: Cash Flow........................................................................................................................ 20
Chart: Cash................................................................................................................................... 21
7.6 Projected Balance Sheet...................................................................................................... 22
Table: Balance Sheet................................................................................................................ 22
7.7 Business Ratios ....................................................................................................................... 22
Table: Ratios................................................................................................................................ 23
Table: Sales Forecast ......................................................................................................................... 1
Table: Personnel................................................................................................................................... 2
Table: Profit and Loss......................................................................................................................... 3
Table: Cash Flow.................................................................................................................................. 4
Table: Balance Sheet.......................................................................................................................... 6
Bay of Bengal Wing Craft
Page 1
1.0 Executive Summary
Bay of Bengal WINGCRAFT . is a manufacturer of wing-in-ground effect (WING) crafts, with one
location in Chittagong/Khulna, Bangladesh. Bay of Bengal WINGCRAFT. is a start-up
manufacturing firm. Along with a significant level of its own capital and patented designs, Bay
of Bengal WINGCRAFT . hopes to initially make a successful effort to secure start -up financing
to begin operations.
Bay of Bengal WINGCRAFT . is looking to conduct operations at its location to meet an ever-
growing level of demand for this alternative transportation vehicle. The company's initial
product offering will lude the "BoB-12" with plans to finalize the designs of the BoB-30 in year
two. These products are expected to be very popular among government agencies for Marine
belt Coast Guard, like Bangadesh, Srilanka, India, Pakistan, Japan, Malaysia, Singapore,
Hongkong, UAE, EU/US Countries, etc., and commercial companies because of their versatility
and capabilities. Strong contact relationships and referral networks among commercial
company owners are expected to allow for a rapid entry into this market.
Chart: Highlights
Bay of Bengal Wing Craft
Page 2
1.1 Objectives
1. To establish four production lines at the first plant in Chittagong/Khulna, Bangladesh in
order to produce the Bangladesh built model of the BoB-12.
2. To expand production annually by opening two additional lines of production each year for
years two through five.
3. Achieve a target of 2 units built and sold in the first production year, while raising annual
production to 16 units by the end of year three.
4. First year projected sales of 2 units is expected to bring net profits of $1.5 million (before
taxes), and growth from years two through five is projected to bring accumulated profits
(before taxes) to be $20 million for the first five years of production.
5. Bay of Bengal WINGCRAFT. will take advantage of the acute need for solutions to fuel
efficient, high speed modes of transportation over sea, and establish plants in different
locations where demand for such vehicles warrant.
6. Develop foreign markets for island based countries (Malaysia, Japan, UK, Haiti, Thailand,
etc.,), through licensing agreements, such as in Alaska USA, where the WING mode of
transportation would be beneficial for productivity and environmental needs.
1.2 Mission
Bay of Bengal WINGCRAFT. develops Wing-In-Ground Effect (WING) vehicles for use as the
next-generation maritime transportation. The value that Bay of Bengal WINGCRAFT . delivers to
this market is the ability to dramatically improve the efficiency, speed and cost of maritime
transportation. Bay of Bengal WINGCRAFT. technology enables the development of WING
vehicles that travel at the speeds normally associated to air planes, while using the fuel that is
normally associated with cars.
1.3 Keys to Success
Bay of Bengal WINGCRAFT. keys to success include:
1. Uncompromising commitment to the quality in its product line using quality materials and a
high standard of quality in production.
2. Significant investments in research and development and engineering with the aim to focus
on the next generation of maritime transportation.
3. Successful niche marketing to global customers in both the public and private sectors.
4. Improving efficiencies of operations.
2.0 Company Summary
Bay of Bengal WINGCRAFT, is a start-up manufacturing firm which will be managed by two
executives representing administration, marketing, sales, and finance. These executives bring
to the company a large degree of experience in the equipment manufacturing industry. They
perceive an opportunity to acquire a significant amount of market share by focusing on the
specific needs of the commercial transportation industry and by providing more efficient means
of maritime transport to their clients than other competitors. The company will be organized as
a closely-held corporation with a majority of the shares held by the two propel executives.
The company will be seeking to raise approximately $2-20 million in loans from JV capitalist /
Bay of Bengal Wing Craft
Page 3
private investors for start-up purposes. The company will have one manufacturing facility in
Chittagong/Khulna, Bangladesh.
2.1 Company Ownership
The company will be a closely-held corporation with four/five active shareholders who will form
the Board of Directors. It is anticipated that within the next five years, the company will be
instituting a public offering to enlarge its ability to acquire financing. The propel owners will
seek to retain the majority of the company's stock for the foreseeable future. The company will
cooperate with the Bangladesh Navy, FBCCI, DCCI, MBCCI, RJSC, Dhaka as this offers the most
advantageous location for testing and demonstrations in all weather conditions.
2.2 Start-up Summary
The following summary table shows the projected start-up costs during the four/six months
needed to get into production. It lodes the supply of specific machinery and equipment needed
for the production lines. The start-up costs are to be financed by the money raised through this
Private Placement Memorandum Offer.
The funds sought for opening the plant with four production lines is $5 million with projected
net profits, in the first year of over $10 million. Alternatively, as a minimum plan, we could
open with one line of production with funds of $2 million. In this case, the projected net profit,
in the first year is over $1 million. In either case, about $750,000 will be available as working
capital for the first six months of operations (after the plant is in production).
Management expects to begin production in approximately 60-120 days from funding as
detailed in the Start-Up table.
Long-term Assets
Equipment and Machinery $150,000
Plant Improvements $50,000
LV Truck $15,000
Plant Vehicle $5,000
Total Equipment and Plant $270,000
Bay of Bengal Wing Craft
Page 4
Table: Start-up
Start-up
Requirements
Start-up Expenses
Legal $5,000
Stationery etc. $500
Insurance $5,000
Rent
$250,000
$25,000
Patenting
Computer
$24,000
Other $12,500
Total Start-up Expenses $322,000
Start-up Assets
Cash Required $850,000
Start-up Inventory $300,000
Other Current Assets $200,000
Long-term Assets $200,000
Total Assets $1,550,000
Total Requirements $1,877,000
Chart: Start-up
Bay of Bengal Wing Craft
Page 5
3.0 Products
Bay of Bengal WINGCRAFT . product - the BoB wing in ground effect vehicle is the next
generation of maritime transport vehicles. The patent protected BoB is classified as a maritime
vessel that flies above surfaces at speeds that are comparable to air planes, while using a
fraction of the fuel and requiring minimal maintenance. The specifications of our craft comply
with the HSC Code for both the IMO (International Maritime Organization) and USCG (United
States Coast Guard) regulations and safety standards. The patented BoB gives our WING craft
the following advantages over other boats or air planes:
 Less costly to maintain.
 More fuel efficient than an airplane or boat.
 Comparable speed of an air plane without needing a pilot's license.
 No rocking motion due to waves, when cruising.
 Environmentally friendly, creating virtually no wake.
 Able to navigate over shallow waters, sand bars and other obstacles.
 Operational year round, over water and ice.
 Proper utilization of Hydroxy fuel to reduce fuel operational cost (proposed)
It is a rare occasion when a company can make a significant contribution to our
environment as well as create an important long awaited product that will provide
substantial cost savings for its users and allow them the opportunity to use and
promote environmentally friendly, methods of travel.
The WING craft (Wing-In-Ground Effect vehicle) is an all-weather highly economical and safe
multipurpose, vehicle that operates close to the ground, flying in a dynamic space that is known
as ground effect. Designed for contactless motion above the surface (water, ice, snow, etc...) at
altitudes of 0.2-3 m, the BoB WING craft can be effectively used for passenger or cargo
transportation in a multitude of environments and regions. The BoB can operate in most
environments and configured to be used for Emergency Response, Marine Police, Coast Guard,
Military or Private use, making this WING craft one of the most effective vehicles in near fuure.
4.0 Market Analysis Summary
Our target markets include:
 Ferry Services
 Remote Tourism
 Cargo & Currier Companies
 Government agencies
o Marine Police
o Coast Guard
o Military
o Emergency Response Units
 Exploration and Mining Companies
Bay of Bengal Wing Craft
Page 6
4.1 Market Segmentation
Due to the fact that Bay of Bengal WINGCRAFT projected plan is to open a new plant and
expand on that plant with two production lines each year over the next five years, and
willingness to capture 0.15% to 0.75% of the U.S. maritime transportation market, our main
growth problem will be the limited abilities to supply the potential demand. Although we
segmented the market into four groups we cannot indicate the percentage of growth for each
segment, as the growth is not linear.
Table: Market Analysis
Market Analysis
2011 2012 2013 2014 2015
Potential Customers Growth CAGR
Ferry Services 5% 83 87 91 96 101 5.03%
Government Agencies 10% 63 69 76 84 92 9.93%
Exploration & Mining 5% 381 400 420 441 463 4.99%
Total 5.63% 527 556 587 621 656 5.63%
Chart: Market Analysis (Pie)
Bay of Bengal Wing Craft
Page 7
4.2 Target Market Segment Strategy
The following table demonstrates the cost savings that will be realized when a company moves
from using a boat or an air plane to using the BoB .
4.3 Industry Analysis
The industry is new with only a few companies, such as AFD Airfoil Development
GmbH (Germany), C&S AMT Ltd (Korea) and Botec (Germany), currently
manufacturing vessels. Out of these major competitors, AFD Airfoil Development
GmbH is the largest, with the first WING vessel to receive a certificate of class from Lloyd's
Register. AFD Airfoil Development GmbH reported sales of the AirFish-8 to Flightship in
Australia in 2002, with a price tag of $1,200,000 for the standard layout. Each of these
manufacturers has multi-segment marketing strategies that provide a base model that can be
customized for large blocks of customers.
Companies are marketing their products directly or in some cases through local distributors who
are often franchises of the parent manufacturers. There is a significant direct sale to customers,
providing greater opportunity to build relationships with customers, while customizing vessels
for each client and their needs, allowing for maximizing vessel usage.
Customers who purchase such vessels require reliability, easy maintenance, rapid availability of
parts, and versatility for a variety of anticipated uses. Customers are influenced by reputation
and cost, so vessel purchases can be the most significant portion of the customer's long-term
assets.
4.3.1 Competition and Buying Patterns
The purchase decision for our customer is based on an experienced test ride combined with the
cost savings potential and our experts have ability to manufacture a high quality vessel in North
America. We have established relationships with our customers which extend beyond that of
the buyer/seller. The Bay of Bengal WINGCRAFT label means that the product has been chosen
and prepared with the highest quality standards in mind. Our vessels are priced up to nine
percent higher than similar products. Our customers are willing to pay more for our product
because they are familiar with us and trust in the quality of our vessels. This is the result of
their success in the marketplace with our product.
5.0 Strategy and Implementation Summary
Bay of Bengal WINGCRAFT's strategy is to expand production capabilities in order to fulfill the
requests of government agencies and global businesses those who have currently expressed
interest for large orders that we are unable to currently fulfill. In addition Bay of Bengal
WINGCRAFT seeks to establish additional contracts with global importers and introduce a BoB-
30 with a larger payload capacity in the 3rd year of production.
Bay of Bengal Wing Craft
Page 8
5.1 Competitive Edge
Bay of Bengal WINGCRAFT's most important competitive edge is based on the unique and
patented design used to manufacture the WING craft. The versatile design is protected by the
issued patents that will prevent duplication or "copyc ut" competition.
BoB vessels will be manufactured from quality tested materials and manufacturing processes
that meet or exceed maritime law and most Governments defense requirements. Bay of Bengal
WINGCRAFT design has already sold several units of the BoB-12 as namely Ivolga of the EL-12
to the Russian Coast Guard for use in northern territories where extreme climates make it
difficult to operate other vehicles. With manufacturing facilities in the Bangladesh, we will focus
on different government agencies including the Coast Guard, Department of Defense and
Department of Tourism & Transportation to introduce and market the BoB-12 and BoB-30.
The BoB is already classified as a maritime vessel and does not require a pilot’s license to
operate. This reduces the training requirement to operate the vehicle. When combined with the
fact that maintenance and gas usage are comparable to the average Bangladeshi or
international cargos, the BoB WING craft will be more affordable and accessible than most
water vessels or air planes.
The BoB WING craft is an environmentally friendly product that cruises above the water
leaving little or no wake and no destruction caused by propellers, behind. The vessel can be
operated in lakes, oceans, swamps and ice. The BoB 's ability to retract the wings, allows it to
operate in most environments and spaces, where wings might cause problems with docking.
The BoB will be the best cost effective/performance WING craft in the market. The summary of
advantages that our WING craft has in comparison to existing WING craft such as the Airfish-8
or Sea Rider and boats or air planes, are:
Much less cost to buy and maintain than an air plane.
Faster than most Wing crafts or boats with a cruising speed of 107 knots (200 km/h).
Carries 3,300 lbs.
Easy and cheap maintenance. Operate cost $182/ h.
Classified as a maritime vessel requiring only maritime licensing to operate.
Fuel efficient with a range of 1,125 ml (1,800 km) using 756 L (100 gal) of Gas.
Easily configured for specific use (Coast Guard, Ferry Services, Military/Police, etc...).
Able to operate in environments where air planes or boats cannot.
5.2 Marketing Strategy
Bay of Bengal WINGCRAFT's marketing strategy will include the use of targeted print media
advertising and direct selling to prospective clients in oil exploration companies, those are
involve in the oil exploration on the Bay of Bengal at Bangladesh and abroad. We will capitalize
on existing relationships with prospective clients and partners who have already expressed their
willingness to purchase the BoB-12. We will have positioned ourselves as a monopoly
Bangladeshi manufacturer of WING crafts and the nex-gen modern maritime vehicles, that will
meet or exceed world class standards and regulations. The primary marketing efforts will be to
communicate with the existing and potential customers.
Bay of Bengal Wing Craft
Page 9
5.3 Sales Strategy
Bay of Bengal WINGCRAFT's sales focus will be first on meeting with the Federation of
Bangladesh Chambers of Commerce and Industries members (FBCCI), business groups and
government tourism & defense ministries to aware the benefits to purchase such type of
vehicles for their fleet. Secondly, we will focus on raising the volume, while maintaining the
percentage of sales, of vessels sold to the overseas market. When we will have reached
maximum sales to existing channels then we may shift our focus to Gulf, Haiti, Srilanka, Japan,
etc.
5.3.1 Sales Forecast
The following chart and table show our present sales forecast. We project sales to grow
approximately 250% annually in 2015, after the first year following the production of our first
Bangladeshi build vessels, increase again by 370% percent in 2016, and reach maximum for
production capacity in 2016. Our forecasts are based on communications with interested parties
located in our network and abroad, who are already showing their interest to purchase such
type of environment friendly cost effective vehicles.
Table: Sales Forecast
Sales Forecast
FY 2014 FY 2015 FY 2016
Sales
BoB-12 $4,000,000 $10,500,000 $28,000,000
BoB-30 $0 $0 $9,000,000
Total Sales $4,000,000 $10,500,000 $37,000,000
Direct Cost of Sales FY 2014 FY 2015 FY 2016
Labor $431,999 $1,046,200 $1,484,616
Material $591,000 $2,660,000 $5,023,000
Overhead $283,130 $306,000 $330,000
Subtotal Direct Cost of Sales $1,306,129 $4,012,200 $6,837,616
Bay of Bengal Wing Craft
Page 10
Chart: Sales Monthly
Chart: Sales by Year
0
200000
400000
600000
800000
1000000
1200000
1400000
1600000
1800000
2000000
Bob -12
BoB-30
$0
$5,000,000
$10,000,000
$15,000,000
$20,000,000
$25,000,000
$30,000,000
$35,000,000
$40,000,000
2014 2015 2016
BoB-12
BoB-30
Total Sales
Bay of Bengal Wing Craft
Page 11
5.4 Milestones
The following table lists important project milestones during the pre-production start-up period,
with dates and managers in charge, and budgets for each milestone. The milestone schedule
indicates our emphasis on planning for implementation.
The production schedule is based on two shifts. During the first month only one shift will be in
operation, with a second shift being implemented in the second month of production.
Table: Milestones
Milestones
Milestone Start Date End Date Budget Manager Department
Secure Manufacturing Facilities 03/01/2013 03/02/2013 $17,500 ABC Department
Purchase & Installation of Equip. 06/02/2013 30/02/2013 $121,800 ABC Department
Purchase Manufacturing Supplies 13/02/2013 30/5/2013 $899,232 ABC Department
First BD-12 off the line 04/06/2013 27/11/2013 $327,000 ABC Department
Testing of first craft 06/12/203 17/12/2013 $65,000 ABC Department
Design Composite Version of BD-12 04/05/2013 30/05/2013 $240,000 ABC Department
USCG Certification 06/05/2013 31/05/2013 $84,000 ABC Department
Lloyd's Certification 06/05/2013 31/11/2013 $138,000 ABC Department
Marketing & Advertising 06/12/2013 30/01/2014 $260,000 ABC Department
Patent BD-12,30 06/01/2014 28/04/2014 $38,000 ABC Department
Totals $2,190,532
Chart: Milestones
0
1
2
3
4
5
6
Milestones
Milestones
Bay of Bengal Wing Craft
Page 12
6.0 Management Summary
THE MANAGEMENT TEAM (will disclose, after finalization of MOU)
Bay of Bengal WINGCRAFT . management team and its consultants are qualified professionals
with vast experience with plant installation and operations, purchasing and marketing. Bay of
Bengal WINGCRAFT's consultants will be employed during the start-up period (see Start-up
table). Bay of Bengal WINGCRAFT . welcomes any additional person from our investor's group
that can contribute to the success of the company.
XXXXXX, CEO: SUMMARY OF QUALIFICATIONS
 M.D. in Aviation Engineering, XXXXXX Aviation Institute of XXXXXX.
 Military Pilot in XXXX XXXX Sea 1982-93
 Production Manager light aircraft XXXXX republic 1993-2000
 XXXXXX, has been involved in design, management and manufacturing processes of the
XXXXX 2004.
XXXXXX: SUMMARY OF QUALIFICATIONS
 Co-designer - PhD WING Craft design degree. 25 year experience
XXXXXXXX, Lead Designer
 Honored Test Pilot Design Office XXXX, academician of the Academy of Sciences of Russia,
chief designer of ground-effect crafts, 50 year experience
Bay of Bengal Wing Craft
Page 13
6.1 Personnel Plan
The personnel table assumes slow growth in employees, and 3-5% per annum pay raises. We
plan to offer a strong benefits policy (with fully-paid medical, dental, and life insurance, plus a
profit sharing and 401K plan) to encourage a very low turnover.
Salaries are generally in line with market pay for the Philadelphia area, although our benefits
are above standard market level, so we ultimately pay a bit more for our people than what
might be considered standard in our market.
As we grow, we expect to see steady reaches in our personnel to match the reaches in sales
and production.
Table: Personnel
Personnel Plan
FY 2012 FY 2013 FY 2014
Engineering & Design $159,500 $247,200 $254,616
Mechanical $87,480 $189,000 $260,000
Assembly $162,519 $400,000 $550,000
Sales $22,500 $210,000 $420,000
Total People 11 15 18
Total Payroll $431,999 $1,046,200 $1,484,616
7.0 Financial Plan
Bay of Bengal WINGCRAFT . expects to raise $2 - $20 million in private investment for
start-up costs for the first year. This will provide the bulk of the financing required to
grow operations at the planned rate.
Bay of Bengal Wing Craft
Page 14
7.1 Start-up Funding
The start-up costs of Bay of Bengal WINGCRAFT . will consist primarily of materials, equipment
and fixtures. XXXXX and XXXX have invested $3,8M in cash and $4,2M million in labor during
2004-present to get the current design made. We are seeking investment capital of
approximately $2-5 million to start Bangladesh & also $2-5 million for USA based consortium
for at a time production of the USA / BD-12,30.
Table: Start-up Funding
Start-up Funding
Start-up Expenses to Fund $322,000
Start-up Assets to Fund $1,550,000
Total Funding Required $1,877,000
Assets
Non-cash Assets from Start-up $500,000
Cash Requirements from Start-up $850,000
Additional Cash Raised $9,000
Cash Balance on Starting Date $859,000
Total Assets $1,359,000
Liabilities and Capital
Liabilities
Current Borrowing $0
Long-term Liabilities $0
Accounts Payable (Outstanding Bills) $0
Other Current Liabilities (interest-free) $0
Total Liabilities $0
Capital
Planned Investment
Owner 0
Investor $1,877,000
Additional Investment Requirement $2,500,000
Total Planned Investment $1,877,000
Loss at Start-up (Start-up Expenses) ($275,000)
Total Capital $1,342,000
Total Capital and Liabilities $1,359,000
Total Funding $1,877,000
Bay of Bengal Wing Craft
Page 15
7.2 Important Assumptions
The financial plan depends on important assumptions, most of which are shown in the following
table. The key underlying assumptions are:
• We assume a slow-growth economy, during the current recession.
• We assume of course that there are no unforeseen changes in technology to make our
products immediately obsolete.
• We assume access to equity capital and financing sufficient to maintain our financial plan as
shown in the tables.
7.3 Break-even Analysis
The break-even analysis shows that Bay of Bengal WINGCRAFT . has sufficient sales strength to
remain viable. Our break-even point is close to 1 unit per year and our sales forecast for the
next year calls for almost 1 unit per month on average.
Table: Break-even Analysis
Break-even Analysis
Monthly Revenue Break-even $78,146
Assumptions:
Average Percent Variable Cost 33%
Estimated Monthly Fixed Cost $52,629
Bay of Bengal Wing Craft
Page 16
Chart: Break-even Analysis
Bay of Bengal Wing Craft
Page 17
7.4 Projected Profit and Loss
As the profit and loss table shows, Bay of Bengal WINGCRAFT . expects to continue its steady
growth in profitability over the next three years of operations.
Table: Profit and Loss
Pro Forma Profit and Loss
FY 2012 FY 2013 FY 2014
Sales $4,000,000 $10,500,000 $37,000,000
Direct Cost of Sales $1,306,129 $4,012,200 $6,837,616
Other Costs of Sales $17,000 $84,000 $100,000
Total Cost of Sales $1,323,129 $4,096,200 $6,937,616
Gross Margin $2,676,871 $6,403,800 $30,062,384
Gross Margin % 66.92% 60.99% 81.25%
Expenses
Payroll $431,999 $1,046,200 $1,484,616
Marketing/Promotion $9,000 $15,000 $20,000
Depreciation $0 $10,000 $13,000
Rent $105,000 $110,000 $115,000
Utilities $5,250 $5,670 $6,237
Insurance $5,500 $5,500 $5,500
Payroll Taxes $64,800 $156,930 $222,692
Other $10,000 $20,000 $50,000
Total Operating Expenses $631,549 $1,369,300 $1,917,045
Profit Before Interest and Taxes $2,045,322 $5,034,500 $28,145,339
EBITDA $2,045,322 $5,044,500 $28,158,339
Interest Expense $0 $0 $0
Taxes urred $470,424 $1,157,935 $6,473,428
Net Profit $1,574,898 $3,876,565 $21,671,911
Net Profit/Sales 39.37% 36.92% 58.57%
Bay of Bengal Wing Craft
Page 18
Chart: Profit Monthly
Chart: Profit Yearly
Bay of Bengal Wing Craft
Page 19
Chart: Gross Margin Monthly
Chart: Gross Margin Yearly
Bay of Bengal Wing Craft
Page 20
7.5 Projected Cash Flow
The financial outlook is positive as the company rolls out and meets its milestones. After
financing, cash flow will be negative for year. By year two, Bay of Bengal WINGCRAFT . expects
to be cash flow positive.
Table: Cash Flow
Pro Forma Cash Flow
FY 2012 FY 2013 FY 2014
Cash Received
Cash from Operations
Cash Sales $4,000,000 $10,500,000 $37,000,000
Subtotal Cash from Operations $4,000,000 $10,500,000 $37,000,000
Additional Cash Received
Sales Tax, VAT, HST/GST Received $0 $0 $0
New Current Borrowing $0 $0 $0
New Other Liabilities (interest-free) $0 $0 $0
New Long-term Liabilities $0 $0 $0
Sales of Other Current Assets $0 $0 $0
Sales of Long-term Assets $0 $0 $0
New Investment Received $0 $0 $0
Subtotal Cash Received $4,000,000 $10,500,000 $37,000,000
Expenditures FY 2012 FY 2013 FY 2014
Expenditures from Operations
Cash Spending $431,999 $1,046,200 $1,484,616
Bill Payments $1,828,454 $7,127,420 $13,203,163
Subtotal Spent on Operations $2,260,453 $8,173,620 $14,687,779
Additional Cash Spent
Sales Tax, VAT, HST/GST Paid Out $0 $0 $0
Pripal Repayment of Current Borrowing $0 $0 $0
Other Liabilities Pripal Repayment $0 $0 $0
Long-term Liabilities Pripal Repayment $0 $0 $0
Purchase Other Current Assets $0 $0 $0
Purchase Long-term Assets $0 $0 $0
Dividends $0 $0 $0
Subtotal Cash Spent $2,260,453 $8,173,620 $14,687,779
Net Cash Flow $1,739,547 $2,326,380 $22,312,221
Cash Balance $2,598,547 $4,924,926 $27,237,147
Bay of Bengal Wing Craft
Page 21
Chart: Cash
Bay of Bengal Wing Craft
Page 22
7.6 Projected Balance Sheet
Bay of Bengal WINGCRAFT's projected company balance sheet follows.
Table: Balance Sheet
Pro Forma Balance Sheet
FY 2012 FY 2013 FY 2014
Assets
Current Assets
Cash $2,598,547 $4,924,926 $27,237,147
Inventory $269,792 $2,303,251 $2,177,655
Other Current Assets $100,000 $100,000 $100,000
Total Current Assets $2,968,339 $7,328,178 $29,514,802
Long-term Assets
Long-term Assets $100,000 $100,000 $100,000
Accumulated Depreciation $0 $10,000 $23,000
Total Long-term Assets $100,000 $90,000 $77,000
Total Assets $3,068,339 $7,418,178 $29,591,802
Liabilities and Capital FY 2012 FY 2013 FY 2014
Current Liabilities
Accounts Payable $151,440 $624,715 $1,126,428
Current Borrowing $0 $0 $0
Other Current Liabilities $0 $0 $0
Subtotal Current Liabilities $151,440 $624,715 $1,126,428
Long-term Liabilities $0 $0 $0
Total Liabilities $151,440 $624,715 $1,126,428
Paid-in Capital $1,617,000 $1,617,000 $1,617,000
Retained Earnings ($275,000) $1,299,898 $5,176,463
Earnings $1,574,898 $3,876,565 $21,671,911
Total Capital $2,916,898 $6,793,463 $28,465,374
Total Liabilities and Capital $3,068,339 $7,418,178 $29,591,802
Net Worth $2,916,898 $6,793,463 $28,465,374
7.7 Business Ratios
Standard business ratios are laded in the following table. The ratios show an aggressive plan for
growth in order to reach maximum production within three years. Return on investment
reaches each year as we bring the new facility to maximum capacity and production. Return on
sales and assets remain strong and cost of goods decreased based upon efficiency projections.
Projections are based on the 2011/12 selling price.
Bay of Bengal Wing Craft
Page 23
Table: Ratios
Ratio Analysis
FY 2012 FY 2013 FY 2014 Industry Profile
Sales Growth n.a. 162.50% 252.38% 6.60%
Percent of Total Assets
Inventory 8.79% 31.05% 7.36% 1.92%
Other Current Assets 3.26% 1.35% 0.34% 29.79%
Total Current Assets 96.74% 98.79% 99.74% 55.54%
Long-term Assets 3.26% 1.21% 0.26% 44.46%
Total Assets 100.00% 100.00% 100.00% 100.00%
Current Liabilities 4.94% 8.42% 3.81% 36.66%
Long-term Liabilities 0.00% 0.00% 0.00% 33.75%
Total Liabilities 4.94% 8.42% 3.81% 70.41%
Net Worth 95.06% 91.58% 96.19% 29.59%
Percent of Sales
Sales 100.00% 100.00% 100.00% 100.00%
Gross Margin 66.92% 60.99% 81.25% 52.98%
Selling, General & Administrative Expenses 27.55% 24.07% 22.68% 14.74%
Advertising Expenses 0.22% 0.14% 0.05% 0.26%
Profit Before Interest and Taxes 51.13% 47.95% 76.07% 4.89%
Main Ratios
Current 19.60 11.73 26.20 1.16
Quick 17.82 8.04 24.27 1.11
Total Debt to Total Assets 4.94% 8.42% 3.81% 70.41%
Pre-tax Return on Net Worth 70.12% 74.11% 98.88% 32.74%
Pre-tax Return on Assets 66.66% 67.87% 95.11% 9.69%
Additional Ratios FY 2012 FY 2013 FY 2014
Net Profit Margin 39.37% 36.92% 58.57% n.a
Return on Equity 53.99% 57.06% 76.13% n.a
Activity Ratios
Inventory Turnover 5.35 3.12 3.05 n.a
Accounts Payable Turnover 12.96 12.17 12.17 n.a
Payment Days 29 19 23 n.a
Total Asset Turnover 1.30 1.42 1.25 n.a
Debt Ratios
Debt to Net Worth 0.05 0.09 0.04 n.a
Current Liab. to Liab. 1.00 1.00 1.00 n.a
Liquidity Ratios
Net Working Capital $2,816,898 $6,703,463 $28,388,374 n.a
Interest Coverage 0.00 0.00 0.00 n.a
Additional Ratios
Assets to Sales 0.77 0.71 0.80 n.a
Current Debt/Total Assets 5% 8% 4% n.a
Acid Test 17.82 8.04 24.27 n.a
Sales/Net Worth 1.37 1.55 1.30 n.a
Dividend Payout 0.00 0.00 0.00 n.a
Appendix
Page 1
Table: Sales Forecast
Sales Forecast
May Jun Jul Aug Sep Oct Nov Dec Jan Feb Mar Apr
Sales
BD-12 $0 $0 $0 $0 $0 $0 $0 $0 $0 $2,000,000 $2,000,000 $0
BD-30 $0 $0 $0 $0 $0 $0 $0 $0 $0 $0 $0 $0
Total Sales $0 $0 $0 $0 $0 $0 $0 $0 $0 $2,000,000 $2,000,000 $0
Direct Cost of Sales May Jun Jul Aug Sep Oct Nov Dec Jan Feb Mar Apr
Labour $0 $7,000 $17,500 $38,750 $38,750 $38,750 $38,750 $38,750 $38,750 $53,333 $53,333 $68,333
Material $0 $0 $51,000 $51,000 $51,000 $80,000 $77,000 $51,000 $51,000 $77,000 $51,000 $51,000
Overhead $0 $127,500 $15,563 $15,563 $15,563 $15,563 $15,563 $15,563 $15,563 $15,563 $15,563 $15,563
Subtotal Direct Cost of Sales $0 $134,500 $84,063 $105,313 $105,313 $134,313 $131,313 $105,313 $105,313 $145,896 $119,896 $134,896
Appendix
Page 2
Table: Personnel
Personnel Plan
May Jun Jul Aug Sep Oct Nov Dec Jan Feb Mar Apr
Engineering & Design $0 $67,000 $67,000 $69,750 $69,750 $69,750 $69,750 $69,750 $69,750 $80,000 $80,000 $80,000
Mechanical $0 $0 $27,500 $28,330 $28,330 $28,330 $28,330 $28,330 $28,330 $40,000 $40,000 $40,000
Assembly $0 $0 $0 $36,670 $36,670 $36,670 $36,670 $36,670 $36,670 $40,833 $40,833 $40,833
Sales $0 $0 $0 $0 $0 $0 $0 $0 $0 $15,500 $15,500 $27,500
Total People 0 13 15 20 20 20 20 20 20 23 23 23
Total Payroll $0 $67,000 $94,500 $134,750 $134,750 $134,750 $134,750 $134,750 $134,750 $176,333 $176,333 $188,333
Appendix
Page 3
Table: Profit and Loss
Pro Forma Profit and Loss
May Jun Jul Aug Sep Oct Nov Dec Jan Feb Mar Apr
Sales $0 $0 $0 $0 $0 $0 $0 $0 $0 $2,000,000 $2,000,000 $0
Direct Cost of Sales $0 $134,500 $84,063 $105,313 $105,313 $134,313 $131,313 $105,313 $105,313 $145,896 $119,896 $134,896
Other Costs of Sales $0 $0 $0 $0 $0 $0 $0 $0 $0 $5,000 $5,000 $7,000
Total Cost of Sales $0 $134,500 $84,063 $105,313 $105,313 $134,313 $131,313 $105,313 $105,313 $150,896 $124,896 $141,896
Gross Margin $0 ($134,500) ($84,063) ($105,313) ($105,313) ($134,313) ($131,313) ($105,313) ($105,313) $1,849,104 $1,875,104 ($141,896)
Gross Margin % 0.00% 0.00% 0.00% 0.00% 0.00% 0.00% 0.00% 0.00% 0.00% 92.46% 93.76% 0.00%
Expenses
Payroll $0 $7,000 $17,500 $38,750 $38,750 $38,750 $38,750 $38,750 $38,750 $53,333 $53,333 $68,333
Marketing/Promotion $0 $0 $0 $0 $0 $0 $0 $0 $0 $2,000 $2,000 $5,000
Depreciation $0 $0 $0 $0 $0 $0 $0 $0 $0 $0 $0 $0
Rent $0 $17,500 $8,750 $8,750 $8,750 $8,750 $8,750 $8,750 $8,750 $8,750 $8,750 $8,750
Utilities $0 $300 $450 $500 $500 $500 $500 $500 $500 $500 $500 $500
Insurance $0 $500 $500 $500 $500 $500 $500 $500 $500 $500 $500 $500
Payroll Taxes 15% $0 $1,050 $2,625 $5,813 $5,813 $5,813 $5,813 $5,813 $5,813 $8,000 $8,000 $10,250
Other $0 $0 $0 $0 $0 $0 $0 $0 $0 $10,000 $0 $0
Total Operating Expenses $0 $26,350 $29,825 $54,313 $54,313 $54,313 $54,313 $54,313 $54,313 $83,083 $73,083 $93,333
Profit Before Interest and Taxes $0 ($160,850) ($113,888) ($159,626) ($159,626) ($188,626) ($185,626) ($159,626) ($159,626) $1,766,021 $1,802,021 ($235,229)
EBITDA $0 ($160,850) ($113,888) ($159,626) ($159,626) ($188,626) ($185,626) ($159,626) ($159,626) $1,766,021 $1,802,021 ($235,229)
Interest Expense $0 $0 $0 $0 $0 $0 $0 $0 $0 $0 $0 $0
Taxes urred $0 ($36,996) ($26,194) ($36,714) ($36,714) ($43,384) ($42,694) ($36,714) ($36,714) $406,185 $414,465 ($54,103)
Net Profit $0 ($123,855) ($87,694) ($122,912) ($122,912) ($145,242) ($142,932) ($122,912) ($122,912) $1,359,836 $1,387,556 ($181,126)
Net Profit/Sales 0.00% 0.00% 0.00% 0.00% 0.00% 0.00% 0.00% 0.00% 0.00% 67.99% 69.38% 0.00%
Appendix
Page 4
Table: Cash Flow
Pro Forma Cash Flow
May Jun Jul Aug Sep Oct Nov Dec Jan Feb Mar Apr
Cash Received
Cash from Operations
Cash Sales $0 $0 $0 $0 $0 $0 $0 $0 $0 $2,000,000 $2,000,000 $0
Subtotal Cash from Operations $0 $0 $0 $0 $0 $0 $0 $0 $0 $2,000,000 $2,000,000 $0
Additional Cash Received
Sales Tax, VAT, HST/GST Received 0.00% $0 $0 $0 $0 $0 $0 $0 $0 $0 $0 $0 $0
New Current Borrowing $0 $0 $0 $0 $0 $0 $0 $0 $0 $0 $0 $0
New Other Liabilities (interest-free) $0 $0 $0 $0 $0 $0 $0 $0 $0 $0 $0 $0
New Long-term Liabilities $0 $0 $0 $0 $0 $0 $0 $0 $0 $0 $0 $0
Sales of Other Current Assets $0 $0 $0 $0 $0 $0 $0 $0 $0 $0 $0 $0
Sales of Long-term Assets $0 $0 $0 $0 $0 $0 $0 $0 $0 $0 $0 $0
New Investment Received $0 $0 $0 $0 $0 $0 $0 $0 $0 $0 $0 $0
Subtotal Cash Received $0 $0 $0 $0 $0 $0 $0 $0 $0 $2,000,000 $2,000,000 $0
Expenditures May Jun Jul Aug Sep Oct Nov Dec Jan Feb Mar Apr
Expenditures from Operations
Cash Spending $0 $7,000 $17,500 $38,750 $38,750 $38,750 $38,750 $38,750 $38,750 $53,333 $53,333 $68,333
Bill Payments $17,000 $2,862 $69,123 ($9,745) $108,994 $86,839 $162,281 $95,981 $33,895 $103,623 $662,634 $494,967
Subtotal Spent on Operations $17,000 $9,862 $86,623 $29,005 $147,744 $125,589 $201,031 $134,731 $72,645 $156,956 $715,967 $563,300
Additional Cash Spent
Sales Tax, VAT, HST/GST Paid Out $0 $0 $0 $0 $0 $0 $0 $0 $0 $0 $0 $0
Pripal Repayment of Current Borrowing $0 $0 $0 $0 $0 $0 $0 $0 $0 $0 $0 $0
Other Liabilities Pripal Repayment $0 $0 $0 $0 $0 $0 $0 $0 $0 $0 $0 $0
Long-term Liabilities Pripal Repayment $0 $0 $0 $0 $0 $0 $0 $0 $0 $0 $0 $0
Purchase Other Current Assets $0 $0 $0 $0 $0 $0 $0 $0 $0 $0 $0 $0
Purchase Long-term Assets $0 $0 $0 $0 $0 $0 $0 $0 $0 $0 $0 $0
Dividends $0 $0 $0 $0 $0 $0 $0 $0 $0 $0 $0 $0
Appendix
Page 5
Subtotal Cash Spent $17,000 $9,862 $86,623 $29,005 $147,744 $125,589 $201,031 $134,731 $72,645 $156,956 $715,967 $563,300
Net Cash Flow ($17,000) ($9,862) ($86,623) ($29,005) ($147,744) ($125,589) ($201,031) ($134,731) ($72,645) $1,843,044 $1,284,033 ($563,300)
Cash Balance $842,000 $832,138 $745,515 $716,510 $568,766 $443,176 $242,145 $107,414 $34,769 $1,877,813 $3,161,846 $2,598,547
Appendix
Page 6
Table: Balance Sheet
Pro Forma Balance Sheet
May Jun Jul Aug Sep Oct Nov Dec Jan Feb Mar Apr
Assets Starting Balances
Current Assets
Cash $859,000 $842,000 $832,138 $745,515 $716,510 $568,766 $443,176 $242,145 $107,414 $34,769 $1,877,813 $3,161,846 $2,598,547
Inventory $300,000 $300,000 $269,000 $184,937 $210,626 $210,626 $268,626 $262,626 $210,626 $210,626 $291,792 $239,792 $269,792
Other Current Assets $100,000 $100,000 $100,000 $100,000 $100,000 $100,000 $100,000 $100,000 $100,000 $100,000 $100,000 $100,000 $100,000
Total Current Assets $1,259,000 $1,242,000 $1,201,138 $1,030,452 $1,027,136 $879,392 $811,802 $604,771 $418,040 $345,395 $2,269,605 $3,501,638 $2,968,339
Long-term Assets
Long-term Assets $100,000 $100,000 $100,000 $100,000 $100,000 $100,000 $100,000 $100,000 $100,000 $100,000 $100,000 $100,000 $100,000
Accumulated Depreciation $0 $0 $0 $0 $0 $0 $0 $0 $0 $0 $0 $0 $0
Total Long-term Assets $100,000 $100,000 $100,000 $100,000 $100,000 $100,000 $100,000 $100,000 $100,000 $100,000 $100,000 $100,000 $100,000
Total Assets $1,359,000 $1,342,000 $1,301,138 $1,130,452 $1,127,136 $979,392 $911,802 $704,771 $518,040 $445,395 $2,369,605 $3,601,638 $3,068,339
Liabilities and Capital May Jun Jul Aug Sep Oct Nov Dec Jan Feb Mar Apr
Current Liabilities
Accounts Payable $17,000 $0 $82,993 $0 $119,596 $94,763 $172,416 $108,316 $44,497 $94,763 $659,137 $503,614 $151,440
Current Borrowing $0 $0 $0 $0 $0 $0 $0 $0 $0 $0 $0 $0 $0
Other Current Liabilities $0 $0 $0 $0 $0 $0 $0 $0 $0 $0 $0 $0 $0
Subtotal Current Liabilities $17,000 $0 $82,993 $0 $119,596 $94,763 $172,416 $108,316 $44,497 $94,763 $659,137 $503,614 $151,440
Long-term Liabilities $0 $0 $0 $0 $0 $0 $0 $0 $0 $0 $0 $0 $0
Total Liabilities $17,000 $0 $82,993 $0 $119,596 $94,763 $172,416 $108,316 $44,497 $94,763 $659,137 $503,614 $151,440
Paid-in Capital $1,617,000 $1,617,000 $1,617,000 $1,617,000 $1,617,000 $1,617,000 $1,617,000 $1,617,000 $1,617,000 $1,617,000 $1,617,000 $1,617,000 $1,617,000
Retained Earnings ($275,000) ($275,000) ($275,000) ($275,000) ($275,000) ($275,000) ($275,000) ($275,000) ($275,000) ($275,000) ($275,000) ($275,000) ($275,000)
Earnings $0 $0 ($123,855) ($211,548) ($334,460) ($457,372) ($602,613) ($745,545) ($868,456) ($991,368) $368,468 $1,756,024 $1,574,898
Total Capital $1,342,000 $1,342,000 $1,218,146 $1,130,452 $1,007,540 $884,628 $739,387 $596,455 $473,544 $350,632 $1,710,468 $3,098,024 $2,916,898
Total Liabilities and Capital $1,359,000 $1,342,000 $1,301,138 $1,130,452 $1,127,136 $979,392 $911,802 $704,771 $518,040 $445,395 $2,369,605 $3,601,638 $3,068,339
Net Worth $1,342,000 $1,342,000 $1,218,146 $1,130,452 $1,007,540 $884,628 $739,387 $596,455 $473,544 $350,632 $1,710,468 $3,098,024 $2,916,898

Más contenido relacionado

Destacado (7)

Indian seas and ocean
Indian seas and oceanIndian seas and ocean
Indian seas and ocean
 
E2016 ev32 (4)
E2016 ev32 (4)E2016 ev32 (4)
E2016 ev32 (4)
 
Bay of bengal project
Bay of bengal project Bay of bengal project
Bay of bengal project
 
Global Trade - International Business
Global Trade - International BusinessGlobal Trade - International Business
Global Trade - International Business
 
Sea ports in india
Sea ports in indiaSea ports in india
Sea ports in india
 
India
IndiaIndia
India
 
Slideshare ppt
Slideshare pptSlideshare ppt
Slideshare ppt
 

Similar a bob wigcraft

Ecommerce startup business plan
Ecommerce startup business planEcommerce startup business plan
Ecommerce startup business planNarendra Kumar
 
Dev Ronn Enterprises, Llc Business Plan Final
Dev Ronn Enterprises, Llc   Business Plan   FinalDev Ronn Enterprises, Llc   Business Plan   Final
Dev Ronn Enterprises, Llc Business Plan Finalbabydev
 
business plan for Salon and wellness
business plan for Salon and wellness business plan for Salon and wellness
business plan for Salon and wellness Narendra Kumar
 
business plan for fashion eCommerce
business plan for fashion eCommercebusiness plan for fashion eCommerce
business plan for fashion eCommerceEnterslice
 
Agribusiness accounts-terms-and-conditions
Agribusiness accounts-terms-and-conditionsAgribusiness accounts-terms-and-conditions
Agribusiness accounts-terms-and-conditionsJuan Urquijo
 
Vip computer consulting
Vip computer consultingVip computer consulting
Vip computer consultingtrybe4u
 
GNW 04/03/07Supplement
GNW 04/03/07SupplementGNW 04/03/07Supplement
GNW 04/03/07Supplementfinance24
 
GNW 04/03/07Supplement
GNW 04/03/07SupplementGNW 04/03/07Supplement
GNW 04/03/07Supplementfinance24
 
Business plan; Pasta De Italiano
Business plan; Pasta De ItalianoBusiness plan; Pasta De Italiano
Business plan; Pasta De Italianoraboz
 
Dollar General in Plainville, Kansas
Dollar General in Plainville, KansasDollar General in Plainville, Kansas
Dollar General in Plainville, KansasKevin Boeve
 
GNW Q2-07_Financial_Supplement
GNW Q2-07_Financial_SupplementGNW Q2-07_Financial_Supplement
GNW Q2-07_Financial_Supplementfinance24
 
GNW Q2-07_Financial_Supplement
GNW Q2-07_Financial_SupplementGNW Q2-07_Financial_Supplement
GNW Q2-07_Financial_Supplementfinance24
 
2 summary plan description
2 summary plan description2 summary plan description
2 summary plan descriptionErin Kerrigan
 

Similar a bob wigcraft (20)

My Business Plan
My Business PlanMy Business Plan
My Business Plan
 
C:\Fakepath\Amt Computers
C:\Fakepath\Amt ComputersC:\Fakepath\Amt Computers
C:\Fakepath\Amt Computers
 
Ecommerce startup business plan
Ecommerce startup business planEcommerce startup business plan
Ecommerce startup business plan
 
Telecommunications Products Business Plan
Telecommunications Products Business PlanTelecommunications Products Business Plan
Telecommunications Products Business Plan
 
Kids communitycollege
Kids communitycollegeKids communitycollege
Kids communitycollege
 
Abctaxi
AbctaxiAbctaxi
Abctaxi
 
Dev Ronn Enterprises, Llc Business Plan Final
Dev Ronn Enterprises, Llc   Business Plan   FinalDev Ronn Enterprises, Llc   Business Plan   Final
Dev Ronn Enterprises, Llc Business Plan Final
 
business plan for Salon and wellness
business plan for Salon and wellness business plan for Salon and wellness
business plan for Salon and wellness
 
business plan for fashion eCommerce
business plan for fashion eCommercebusiness plan for fashion eCommerce
business plan for fashion eCommerce
 
Agribusiness accounts-terms-and-conditions
Agribusiness accounts-terms-and-conditionsAgribusiness accounts-terms-and-conditions
Agribusiness accounts-terms-and-conditions
 
Vip computer consulting
Vip computer consultingVip computer consulting
Vip computer consulting
 
GNW 04/03/07Supplement
GNW 04/03/07SupplementGNW 04/03/07Supplement
GNW 04/03/07Supplement
 
GNW 04/03/07Supplement
GNW 04/03/07SupplementGNW 04/03/07Supplement
GNW 04/03/07Supplement
 
Business plan; Pasta De Italiano
Business plan; Pasta De ItalianoBusiness plan; Pasta De Italiano
Business plan; Pasta De Italiano
 
Dollar General in Plainville, Kansas
Dollar General in Plainville, KansasDollar General in Plainville, Kansas
Dollar General in Plainville, Kansas
 
GNW Q2-07_Financial_Supplement
GNW Q2-07_Financial_SupplementGNW Q2-07_Financial_Supplement
GNW Q2-07_Financial_Supplement
 
GNW Q2-07_Financial_Supplement
GNW Q2-07_Financial_SupplementGNW Q2-07_Financial_Supplement
GNW Q2-07_Financial_Supplement
 
GCG Gaming Business Plan
GCG Gaming Business PlanGCG Gaming Business Plan
GCG Gaming Business Plan
 
2 summary plan description
2 summary plan description2 summary plan description
2 summary plan description
 
Computer plan
Computer planComputer plan
Computer plan
 

Más de Md. Haque

Hafiz cv4schengen
Hafiz cv4schengenHafiz cv4schengen
Hafiz cv4schengenMd. Haque
 
formalin free fish supply / auction, searching buyback investor
formalin free fish supply / auction, searching buyback investorformalin free fish supply / auction, searching buyback investor
formalin free fish supply / auction, searching buyback investorMd. Haque
 
project proposal for rice bran oil, asking 50M$ JV capitalists attention
project proposal for rice bran oil, asking 50M$ JV capitalists attentionproject proposal for rice bran oil, asking 50M$ JV capitalists attention
project proposal for rice bran oil, asking 50M$ JV capitalists attentionMd. Haque
 
XXX theme park & holiday resort, integrated with dormitory hostel
XXX theme park & holiday resort, integrated with dormitory hostelXXX theme park & holiday resort, integrated with dormitory hostel
XXX theme park & holiday resort, integrated with dormitory hostelMd. Haque
 
Resort bz plan. sajek the queen of clouds
Resort bz plan. sajek the queen of cloudsResort bz plan. sajek the queen of clouds
Resort bz plan. sajek the queen of cloudsMd. Haque
 
hasan cattle farm
hasan cattle farmhasan cattle farm
hasan cattle farmMd. Haque
 
pp tr bd dudley
pp tr bd dudleypp tr bd dudley
pp tr bd dudleyMd. Haque
 

Más de Md. Haque (7)

Hafiz cv4schengen
Hafiz cv4schengenHafiz cv4schengen
Hafiz cv4schengen
 
formalin free fish supply / auction, searching buyback investor
formalin free fish supply / auction, searching buyback investorformalin free fish supply / auction, searching buyback investor
formalin free fish supply / auction, searching buyback investor
 
project proposal for rice bran oil, asking 50M$ JV capitalists attention
project proposal for rice bran oil, asking 50M$ JV capitalists attentionproject proposal for rice bran oil, asking 50M$ JV capitalists attention
project proposal for rice bran oil, asking 50M$ JV capitalists attention
 
XXX theme park & holiday resort, integrated with dormitory hostel
XXX theme park & holiday resort, integrated with dormitory hostelXXX theme park & holiday resort, integrated with dormitory hostel
XXX theme park & holiday resort, integrated with dormitory hostel
 
Resort bz plan. sajek the queen of clouds
Resort bz plan. sajek the queen of cloudsResort bz plan. sajek the queen of clouds
Resort bz plan. sajek the queen of clouds
 
hasan cattle farm
hasan cattle farmhasan cattle farm
hasan cattle farm
 
pp tr bd dudley
pp tr bd dudleypp tr bd dudley
pp tr bd dudley
 

bob wigcraft

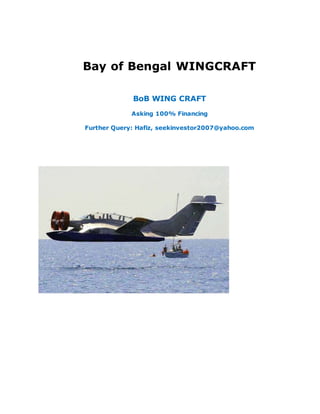
  • 1. Bay of Bengal WINGCRAFT BoB WING CRAFT Asking 100% Financing Further Query: Hafiz, seekinvestor2007@yahoo.com
  • 2. Legal Page Confidentiality Agreement The undersigned reader acknowledges that the information provided by Bay of Bengal WINGCRAFT. in this business plan is confidential; therefore, reader agrees not to disclose it without the express written permission of Hafizul Haque. It is acknowledged by reader that information to be furnished in this business plan is in all respects confidential in nature, other than information which is in the public domain through other means and that any disclosure or use of same by reader, may cause serious harm or damage to Bay of Bengal WINGCRAFT. Upon request, this document is to be immediately returned to Hafizul Haque. ___________________ Signature ___________________ Name (typed or printed) ___________________ Date This is a business plan. It does not imply an offering of securities.
  • 3. Table of Contents Page 1 1.0 Executive Summary .................................................................................................................... 1 Chart: Highlights .......................................................................................................................... 1 1.1 Objectives.................................................................................................................................... 2 1.2 Mission.......................................................................................................................................... 2 1.3 Keys to Success ........................................................................................................................ 2 2.0 Company Summary..................................................................................................................... 2 2.1 Company Ownership............................................................................................................... 3 2.2 Start-up Summary................................................................................................................... 3 Table: Start-up.............................................................................................................................. 4 Chart: Start-up.............................................................................................................................. 4 3.0 Products ........................................................................................................................................... 5 4.0 Market Analysis Summary ........................................................................................................ 5 4.1 Market Segmentation............................................................................................................. 6 Table: Market Analysis............................................................................................................... 6 Chart: Market Analysis (Pie).................................................................................................... 6 4.2 Target Market Segment Strategy...................................................................................... 7 4.3 Industry Analysis...................................................................................................................... 7 4.3.1 Competition and Buying Patterns .............................................................................. 7 5.0 Strategy and Implementation Summary ............................................................................ 7 5.1 Competitive Edge ..................................................................................................................... 8 5.2 Marketing Strategy.................................................................................................................. 8 5.3 Sales Strategy........................................................................................................................... 9 5.3.1 Sales Forecast.................................................................................................................... 9 Table: Sales Forecast ............................................................................................................. 9 Chart: Sales Monthly............................................................................................................ 10 Chart: Sales by Year............................................................................................................. 10 5.4 Milestones.................................................................................................................................. 11 Table: Milestones........................................................................................................................ 11 Chart: Milestones ....................................................................................................................... 11 6.0 Management Summary............................................................................................................ 12 6.1 Personnel Plan......................................................................................................................... 13 Table: Personnel......................................................................................................................... 13 7.0 Financial Plan............................................................................................................................... 13 7.1 Start-up Funding .................................................................................................................... 14 Table: Start-up Funding.......................................................................................................... 14 7.2 Important Assumptions ....................................................................................................... 15 7.3 Break-even Analysis.............................................................................................................. 15 Table: Break-even Analysis.................................................................................................... 15 Chart: Break-even Analysis ................................................................................................... 16 7.4 Projected Profit and Loss..................................................................................................... 17 Table: Profit and Loss............................................................................................................... 17 Chart: Profit Monthly ................................................................................................................ 18 Chart: Profit Yearly.................................................................................................................... 18 Chart: Gross Margin Monthly................................................................................................. 19
  • 4. Table of Contents Page 2 Chart: Gross Margin Yearly.................................................................................................... 19 7.5 Projected Cash Flow.............................................................................................................. 20 Table: Cash Flow........................................................................................................................ 20 Chart: Cash................................................................................................................................... 21 7.6 Projected Balance Sheet...................................................................................................... 22 Table: Balance Sheet................................................................................................................ 22 7.7 Business Ratios ....................................................................................................................... 22 Table: Ratios................................................................................................................................ 23 Table: Sales Forecast ......................................................................................................................... 1 Table: Personnel................................................................................................................................... 2 Table: Personnel................................................................................................................................... 2 Table: Profit and Loss......................................................................................................................... 3 Table: Profit and Loss......................................................................................................................... 3 Table: Cash Flow.................................................................................................................................. 4 Table: Cash Flow.................................................................................................................................. 4 Table: Balance Sheet.......................................................................................................................... 6 Table: Balance Sheet.......................................................................................................................... 6
  • 5. Bay of Bengal Wing Craft Page 1 1.0 Executive Summary Bay of Bengal WINGCRAFT . is a manufacturer of wing-in-ground effect (WING) crafts, with one location in Chittagong/Khulna, Bangladesh. Bay of Bengal WINGCRAFT. is a start-up manufacturing firm. Along with a significant level of its own capital and patented designs, Bay of Bengal WINGCRAFT . hopes to initially make a successful effort to secure start -up financing to begin operations. Bay of Bengal WINGCRAFT . is looking to conduct operations at its location to meet an ever- growing level of demand for this alternative transportation vehicle. The company's initial product offering will lude the "BoB-12" with plans to finalize the designs of the BoB-30 in year two. These products are expected to be very popular among government agencies for Marine belt Coast Guard, like Bangadesh, Srilanka, India, Pakistan, Japan, Malaysia, Singapore, Hongkong, UAE, EU/US Countries, etc., and commercial companies because of their versatility and capabilities. Strong contact relationships and referral networks among commercial company owners are expected to allow for a rapid entry into this market. Chart: Highlights
  • 6. Bay of Bengal Wing Craft Page 2 1.1 Objectives 1. To establish four production lines at the first plant in Chittagong/Khulna, Bangladesh in order to produce the Bangladesh built model of the BoB-12. 2. To expand production annually by opening two additional lines of production each year for years two through five. 3. Achieve a target of 2 units built and sold in the first production year, while raising annual production to 16 units by the end of year three. 4. First year projected sales of 2 units is expected to bring net profits of $1.5 million (before taxes), and growth from years two through five is projected to bring accumulated profits (before taxes) to be $20 million for the first five years of production. 5. Bay of Bengal WINGCRAFT. will take advantage of the acute need for solutions to fuel efficient, high speed modes of transportation over sea, and establish plants in different locations where demand for such vehicles warrant. 6. Develop foreign markets for island based countries (Malaysia, Japan, UK, Haiti, Thailand, etc.,), through licensing agreements, such as in Alaska USA, where the WING mode of transportation would be beneficial for productivity and environmental needs. 1.2 Mission Bay of Bengal WINGCRAFT. develops Wing-In-Ground Effect (WING) vehicles for use as the next-generation maritime transportation. The value that Bay of Bengal WINGCRAFT . delivers to this market is the ability to dramatically improve the efficiency, speed and cost of maritime transportation. Bay of Bengal WINGCRAFT. technology enables the development of WING vehicles that travel at the speeds normally associated to air planes, while using the fuel that is normally associated with cars. 1.3 Keys to Success Bay of Bengal WINGCRAFT. keys to success include: 1. Uncompromising commitment to the quality in its product line using quality materials and a high standard of quality in production. 2. Significant investments in research and development and engineering with the aim to focus on the next generation of maritime transportation. 3. Successful niche marketing to global customers in both the public and private sectors. 4. Improving efficiencies of operations. 2.0 Company Summary Bay of Bengal WINGCRAFT, is a start-up manufacturing firm which will be managed by two executives representing administration, marketing, sales, and finance. These executives bring to the company a large degree of experience in the equipment manufacturing industry. They perceive an opportunity to acquire a significant amount of market share by focusing on the specific needs of the commercial transportation industry and by providing more efficient means of maritime transport to their clients than other competitors. The company will be organized as a closely-held corporation with a majority of the shares held by the two propel executives. The company will be seeking to raise approximately $2-20 million in loans from JV capitalist /
  • 7. Bay of Bengal Wing Craft Page 3 private investors for start-up purposes. The company will have one manufacturing facility in Chittagong/Khulna, Bangladesh. 2.1 Company Ownership The company will be a closely-held corporation with four/five active shareholders who will form the Board of Directors. It is anticipated that within the next five years, the company will be instituting a public offering to enlarge its ability to acquire financing. The propel owners will seek to retain the majority of the company's stock for the foreseeable future. The company will cooperate with the Bangladesh Navy, FBCCI, DCCI, MBCCI, RJSC, Dhaka as this offers the most advantageous location for testing and demonstrations in all weather conditions. 2.2 Start-up Summary The following summary table shows the projected start-up costs during the four/six months needed to get into production. It lodes the supply of specific machinery and equipment needed for the production lines. The start-up costs are to be financed by the money raised through this Private Placement Memorandum Offer. The funds sought for opening the plant with four production lines is $5 million with projected net profits, in the first year of over $10 million. Alternatively, as a minimum plan, we could open with one line of production with funds of $2 million. In this case, the projected net profit, in the first year is over $1 million. In either case, about $750,000 will be available as working capital for the first six months of operations (after the plant is in production). Management expects to begin production in approximately 60-120 days from funding as detailed in the Start-Up table. Long-term Assets Equipment and Machinery $150,000 Plant Improvements $50,000 LV Truck $15,000 Plant Vehicle $5,000 Total Equipment and Plant $270,000
  • 8. Bay of Bengal Wing Craft Page 4 Table: Start-up Start-up Requirements Start-up Expenses Legal $5,000 Stationery etc. $500 Insurance $5,000 Rent $250,000 $25,000 Patenting Computer $24,000 Other $12,500 Total Start-up Expenses $322,000 Start-up Assets Cash Required $850,000 Start-up Inventory $300,000 Other Current Assets $200,000 Long-term Assets $200,000 Total Assets $1,550,000 Total Requirements $1,877,000 Chart: Start-up
  • 9. Bay of Bengal Wing Craft Page 5 3.0 Products Bay of Bengal WINGCRAFT . product - the BoB wing in ground effect vehicle is the next generation of maritime transport vehicles. The patent protected BoB is classified as a maritime vessel that flies above surfaces at speeds that are comparable to air planes, while using a fraction of the fuel and requiring minimal maintenance. The specifications of our craft comply with the HSC Code for both the IMO (International Maritime Organization) and USCG (United States Coast Guard) regulations and safety standards. The patented BoB gives our WING craft the following advantages over other boats or air planes:  Less costly to maintain.  More fuel efficient than an airplane or boat.  Comparable speed of an air plane without needing a pilot's license.  No rocking motion due to waves, when cruising.  Environmentally friendly, creating virtually no wake.  Able to navigate over shallow waters, sand bars and other obstacles.  Operational year round, over water and ice.  Proper utilization of Hydroxy fuel to reduce fuel operational cost (proposed) It is a rare occasion when a company can make a significant contribution to our environment as well as create an important long awaited product that will provide substantial cost savings for its users and allow them the opportunity to use and promote environmentally friendly, methods of travel. The WING craft (Wing-In-Ground Effect vehicle) is an all-weather highly economical and safe multipurpose, vehicle that operates close to the ground, flying in a dynamic space that is known as ground effect. Designed for contactless motion above the surface (water, ice, snow, etc...) at altitudes of 0.2-3 m, the BoB WING craft can be effectively used for passenger or cargo transportation in a multitude of environments and regions. The BoB can operate in most environments and configured to be used for Emergency Response, Marine Police, Coast Guard, Military or Private use, making this WING craft one of the most effective vehicles in near fuure. 4.0 Market Analysis Summary Our target markets include:  Ferry Services  Remote Tourism  Cargo & Currier Companies  Government agencies o Marine Police o Coast Guard o Military o Emergency Response Units  Exploration and Mining Companies
  • 10. Bay of Bengal Wing Craft Page 6 4.1 Market Segmentation Due to the fact that Bay of Bengal WINGCRAFT projected plan is to open a new plant and expand on that plant with two production lines each year over the next five years, and willingness to capture 0.15% to 0.75% of the U.S. maritime transportation market, our main growth problem will be the limited abilities to supply the potential demand. Although we segmented the market into four groups we cannot indicate the percentage of growth for each segment, as the growth is not linear. Table: Market Analysis Market Analysis 2011 2012 2013 2014 2015 Potential Customers Growth CAGR Ferry Services 5% 83 87 91 96 101 5.03% Government Agencies 10% 63 69 76 84 92 9.93% Exploration & Mining 5% 381 400 420 441 463 4.99% Total 5.63% 527 556 587 621 656 5.63% Chart: Market Analysis (Pie)
  • 11. Bay of Bengal Wing Craft Page 7 4.2 Target Market Segment Strategy The following table demonstrates the cost savings that will be realized when a company moves from using a boat or an air plane to using the BoB . 4.3 Industry Analysis The industry is new with only a few companies, such as AFD Airfoil Development GmbH (Germany), C&S AMT Ltd (Korea) and Botec (Germany), currently manufacturing vessels. Out of these major competitors, AFD Airfoil Development GmbH is the largest, with the first WING vessel to receive a certificate of class from Lloyd's Register. AFD Airfoil Development GmbH reported sales of the AirFish-8 to Flightship in Australia in 2002, with a price tag of $1,200,000 for the standard layout. Each of these manufacturers has multi-segment marketing strategies that provide a base model that can be customized for large blocks of customers. Companies are marketing their products directly or in some cases through local distributors who are often franchises of the parent manufacturers. There is a significant direct sale to customers, providing greater opportunity to build relationships with customers, while customizing vessels for each client and their needs, allowing for maximizing vessel usage. Customers who purchase such vessels require reliability, easy maintenance, rapid availability of parts, and versatility for a variety of anticipated uses. Customers are influenced by reputation and cost, so vessel purchases can be the most significant portion of the customer's long-term assets. 4.3.1 Competition and Buying Patterns The purchase decision for our customer is based on an experienced test ride combined with the cost savings potential and our experts have ability to manufacture a high quality vessel in North America. We have established relationships with our customers which extend beyond that of the buyer/seller. The Bay of Bengal WINGCRAFT label means that the product has been chosen and prepared with the highest quality standards in mind. Our vessels are priced up to nine percent higher than similar products. Our customers are willing to pay more for our product because they are familiar with us and trust in the quality of our vessels. This is the result of their success in the marketplace with our product. 5.0 Strategy and Implementation Summary Bay of Bengal WINGCRAFT's strategy is to expand production capabilities in order to fulfill the requests of government agencies and global businesses those who have currently expressed interest for large orders that we are unable to currently fulfill. In addition Bay of Bengal WINGCRAFT seeks to establish additional contracts with global importers and introduce a BoB- 30 with a larger payload capacity in the 3rd year of production.
  • 12. Bay of Bengal Wing Craft Page 8 5.1 Competitive Edge Bay of Bengal WINGCRAFT's most important competitive edge is based on the unique and patented design used to manufacture the WING craft. The versatile design is protected by the issued patents that will prevent duplication or "copyc ut" competition. BoB vessels will be manufactured from quality tested materials and manufacturing processes that meet or exceed maritime law and most Governments defense requirements. Bay of Bengal WINGCRAFT design has already sold several units of the BoB-12 as namely Ivolga of the EL-12 to the Russian Coast Guard for use in northern territories where extreme climates make it difficult to operate other vehicles. With manufacturing facilities in the Bangladesh, we will focus on different government agencies including the Coast Guard, Department of Defense and Department of Tourism & Transportation to introduce and market the BoB-12 and BoB-30. The BoB is already classified as a maritime vessel and does not require a pilot’s license to operate. This reduces the training requirement to operate the vehicle. When combined with the fact that maintenance and gas usage are comparable to the average Bangladeshi or international cargos, the BoB WING craft will be more affordable and accessible than most water vessels or air planes. The BoB WING craft is an environmentally friendly product that cruises above the water leaving little or no wake and no destruction caused by propellers, behind. The vessel can be operated in lakes, oceans, swamps and ice. The BoB 's ability to retract the wings, allows it to operate in most environments and spaces, where wings might cause problems with docking. The BoB will be the best cost effective/performance WING craft in the market. The summary of advantages that our WING craft has in comparison to existing WING craft such as the Airfish-8 or Sea Rider and boats or air planes, are: Much less cost to buy and maintain than an air plane. Faster than most Wing crafts or boats with a cruising speed of 107 knots (200 km/h). Carries 3,300 lbs. Easy and cheap maintenance. Operate cost $182/ h. Classified as a maritime vessel requiring only maritime licensing to operate. Fuel efficient with a range of 1,125 ml (1,800 km) using 756 L (100 gal) of Gas. Easily configured for specific use (Coast Guard, Ferry Services, Military/Police, etc...). Able to operate in environments where air planes or boats cannot. 5.2 Marketing Strategy Bay of Bengal WINGCRAFT's marketing strategy will include the use of targeted print media advertising and direct selling to prospective clients in oil exploration companies, those are involve in the oil exploration on the Bay of Bengal at Bangladesh and abroad. We will capitalize on existing relationships with prospective clients and partners who have already expressed their willingness to purchase the BoB-12. We will have positioned ourselves as a monopoly Bangladeshi manufacturer of WING crafts and the nex-gen modern maritime vehicles, that will meet or exceed world class standards and regulations. The primary marketing efforts will be to communicate with the existing and potential customers.
  • 13. Bay of Bengal Wing Craft Page 9 5.3 Sales Strategy Bay of Bengal WINGCRAFT's sales focus will be first on meeting with the Federation of Bangladesh Chambers of Commerce and Industries members (FBCCI), business groups and government tourism & defense ministries to aware the benefits to purchase such type of vehicles for their fleet. Secondly, we will focus on raising the volume, while maintaining the percentage of sales, of vessels sold to the overseas market. When we will have reached maximum sales to existing channels then we may shift our focus to Gulf, Haiti, Srilanka, Japan, etc. 5.3.1 Sales Forecast The following chart and table show our present sales forecast. We project sales to grow approximately 250% annually in 2015, after the first year following the production of our first Bangladeshi build vessels, increase again by 370% percent in 2016, and reach maximum for production capacity in 2016. Our forecasts are based on communications with interested parties located in our network and abroad, who are already showing their interest to purchase such type of environment friendly cost effective vehicles. Table: Sales Forecast Sales Forecast FY 2014 FY 2015 FY 2016 Sales BoB-12 $4,000,000 $10,500,000 $28,000,000 BoB-30 $0 $0 $9,000,000 Total Sales $4,000,000 $10,500,000 $37,000,000 Direct Cost of Sales FY 2014 FY 2015 FY 2016 Labor $431,999 $1,046,200 $1,484,616 Material $591,000 $2,660,000 $5,023,000 Overhead $283,130 $306,000 $330,000 Subtotal Direct Cost of Sales $1,306,129 $4,012,200 $6,837,616
  • 14. Bay of Bengal Wing Craft Page 10 Chart: Sales Monthly Chart: Sales by Year 0 200000 400000 600000 800000 1000000 1200000 1400000 1600000 1800000 2000000 Bob -12 BoB-30 $0 $5,000,000 $10,000,000 $15,000,000 $20,000,000 $25,000,000 $30,000,000 $35,000,000 $40,000,000 2014 2015 2016 BoB-12 BoB-30 Total Sales
  • 15. Bay of Bengal Wing Craft Page 11 5.4 Milestones The following table lists important project milestones during the pre-production start-up period, with dates and managers in charge, and budgets for each milestone. The milestone schedule indicates our emphasis on planning for implementation. The production schedule is based on two shifts. During the first month only one shift will be in operation, with a second shift being implemented in the second month of production. Table: Milestones Milestones Milestone Start Date End Date Budget Manager Department Secure Manufacturing Facilities 03/01/2013 03/02/2013 $17,500 ABC Department Purchase & Installation of Equip. 06/02/2013 30/02/2013 $121,800 ABC Department Purchase Manufacturing Supplies 13/02/2013 30/5/2013 $899,232 ABC Department First BD-12 off the line 04/06/2013 27/11/2013 $327,000 ABC Department Testing of first craft 06/12/203 17/12/2013 $65,000 ABC Department Design Composite Version of BD-12 04/05/2013 30/05/2013 $240,000 ABC Department USCG Certification 06/05/2013 31/05/2013 $84,000 ABC Department Lloyd's Certification 06/05/2013 31/11/2013 $138,000 ABC Department Marketing & Advertising 06/12/2013 30/01/2014 $260,000 ABC Department Patent BD-12,30 06/01/2014 28/04/2014 $38,000 ABC Department Totals $2,190,532 Chart: Milestones 0 1 2 3 4 5 6 Milestones Milestones
  • 16. Bay of Bengal Wing Craft Page 12 6.0 Management Summary THE MANAGEMENT TEAM (will disclose, after finalization of MOU) Bay of Bengal WINGCRAFT . management team and its consultants are qualified professionals with vast experience with plant installation and operations, purchasing and marketing. Bay of Bengal WINGCRAFT's consultants will be employed during the start-up period (see Start-up table). Bay of Bengal WINGCRAFT . welcomes any additional person from our investor's group that can contribute to the success of the company. XXXXXX, CEO: SUMMARY OF QUALIFICATIONS  M.D. in Aviation Engineering, XXXXXX Aviation Institute of XXXXXX.  Military Pilot in XXXX XXXX Sea 1982-93  Production Manager light aircraft XXXXX republic 1993-2000  XXXXXX, has been involved in design, management and manufacturing processes of the XXXXX 2004. XXXXXX: SUMMARY OF QUALIFICATIONS  Co-designer - PhD WING Craft design degree. 25 year experience XXXXXXXX, Lead Designer  Honored Test Pilot Design Office XXXX, academician of the Academy of Sciences of Russia, chief designer of ground-effect crafts, 50 year experience
  • 17. Bay of Bengal Wing Craft Page 13 6.1 Personnel Plan The personnel table assumes slow growth in employees, and 3-5% per annum pay raises. We plan to offer a strong benefits policy (with fully-paid medical, dental, and life insurance, plus a profit sharing and 401K plan) to encourage a very low turnover. Salaries are generally in line with market pay for the Philadelphia area, although our benefits are above standard market level, so we ultimately pay a bit more for our people than what might be considered standard in our market. As we grow, we expect to see steady reaches in our personnel to match the reaches in sales and production. Table: Personnel Personnel Plan FY 2012 FY 2013 FY 2014 Engineering & Design $159,500 $247,200 $254,616 Mechanical $87,480 $189,000 $260,000 Assembly $162,519 $400,000 $550,000 Sales $22,500 $210,000 $420,000 Total People 11 15 18 Total Payroll $431,999 $1,046,200 $1,484,616 7.0 Financial Plan Bay of Bengal WINGCRAFT . expects to raise $2 - $20 million in private investment for start-up costs for the first year. This will provide the bulk of the financing required to grow operations at the planned rate.
  • 18. Bay of Bengal Wing Craft Page 14 7.1 Start-up Funding The start-up costs of Bay of Bengal WINGCRAFT . will consist primarily of materials, equipment and fixtures. XXXXX and XXXX have invested $3,8M in cash and $4,2M million in labor during 2004-present to get the current design made. We are seeking investment capital of approximately $2-5 million to start Bangladesh & also $2-5 million for USA based consortium for at a time production of the USA / BD-12,30. Table: Start-up Funding Start-up Funding Start-up Expenses to Fund $322,000 Start-up Assets to Fund $1,550,000 Total Funding Required $1,877,000 Assets Non-cash Assets from Start-up $500,000 Cash Requirements from Start-up $850,000 Additional Cash Raised $9,000 Cash Balance on Starting Date $859,000 Total Assets $1,359,000 Liabilities and Capital Liabilities Current Borrowing $0 Long-term Liabilities $0 Accounts Payable (Outstanding Bills) $0 Other Current Liabilities (interest-free) $0 Total Liabilities $0 Capital Planned Investment Owner 0 Investor $1,877,000 Additional Investment Requirement $2,500,000 Total Planned Investment $1,877,000 Loss at Start-up (Start-up Expenses) ($275,000) Total Capital $1,342,000 Total Capital and Liabilities $1,359,000 Total Funding $1,877,000
  • 19. Bay of Bengal Wing Craft Page 15 7.2 Important Assumptions The financial plan depends on important assumptions, most of which are shown in the following table. The key underlying assumptions are: • We assume a slow-growth economy, during the current recession. • We assume of course that there are no unforeseen changes in technology to make our products immediately obsolete. • We assume access to equity capital and financing sufficient to maintain our financial plan as shown in the tables. 7.3 Break-even Analysis The break-even analysis shows that Bay of Bengal WINGCRAFT . has sufficient sales strength to remain viable. Our break-even point is close to 1 unit per year and our sales forecast for the next year calls for almost 1 unit per month on average. Table: Break-even Analysis Break-even Analysis Monthly Revenue Break-even $78,146 Assumptions: Average Percent Variable Cost 33% Estimated Monthly Fixed Cost $52,629
  • 20. Bay of Bengal Wing Craft Page 16 Chart: Break-even Analysis
  • 21. Bay of Bengal Wing Craft Page 17 7.4 Projected Profit and Loss As the profit and loss table shows, Bay of Bengal WINGCRAFT . expects to continue its steady growth in profitability over the next three years of operations. Table: Profit and Loss Pro Forma Profit and Loss FY 2012 FY 2013 FY 2014 Sales $4,000,000 $10,500,000 $37,000,000 Direct Cost of Sales $1,306,129 $4,012,200 $6,837,616 Other Costs of Sales $17,000 $84,000 $100,000 Total Cost of Sales $1,323,129 $4,096,200 $6,937,616 Gross Margin $2,676,871 $6,403,800 $30,062,384 Gross Margin % 66.92% 60.99% 81.25% Expenses Payroll $431,999 $1,046,200 $1,484,616 Marketing/Promotion $9,000 $15,000 $20,000 Depreciation $0 $10,000 $13,000 Rent $105,000 $110,000 $115,000 Utilities $5,250 $5,670 $6,237 Insurance $5,500 $5,500 $5,500 Payroll Taxes $64,800 $156,930 $222,692 Other $10,000 $20,000 $50,000 Total Operating Expenses $631,549 $1,369,300 $1,917,045 Profit Before Interest and Taxes $2,045,322 $5,034,500 $28,145,339 EBITDA $2,045,322 $5,044,500 $28,158,339 Interest Expense $0 $0 $0 Taxes urred $470,424 $1,157,935 $6,473,428 Net Profit $1,574,898 $3,876,565 $21,671,911 Net Profit/Sales 39.37% 36.92% 58.57%
  • 22. Bay of Bengal Wing Craft Page 18 Chart: Profit Monthly Chart: Profit Yearly
  • 23. Bay of Bengal Wing Craft Page 19 Chart: Gross Margin Monthly Chart: Gross Margin Yearly
  • 24. Bay of Bengal Wing Craft Page 20 7.5 Projected Cash Flow The financial outlook is positive as the company rolls out and meets its milestones. After financing, cash flow will be negative for year. By year two, Bay of Bengal WINGCRAFT . expects to be cash flow positive. Table: Cash Flow Pro Forma Cash Flow FY 2012 FY 2013 FY 2014 Cash Received Cash from Operations Cash Sales $4,000,000 $10,500,000 $37,000,000 Subtotal Cash from Operations $4,000,000 $10,500,000 $37,000,000 Additional Cash Received Sales Tax, VAT, HST/GST Received $0 $0 $0 New Current Borrowing $0 $0 $0 New Other Liabilities (interest-free) $0 $0 $0 New Long-term Liabilities $0 $0 $0 Sales of Other Current Assets $0 $0 $0 Sales of Long-term Assets $0 $0 $0 New Investment Received $0 $0 $0 Subtotal Cash Received $4,000,000 $10,500,000 $37,000,000 Expenditures FY 2012 FY 2013 FY 2014 Expenditures from Operations Cash Spending $431,999 $1,046,200 $1,484,616 Bill Payments $1,828,454 $7,127,420 $13,203,163 Subtotal Spent on Operations $2,260,453 $8,173,620 $14,687,779 Additional Cash Spent Sales Tax, VAT, HST/GST Paid Out $0 $0 $0 Pripal Repayment of Current Borrowing $0 $0 $0 Other Liabilities Pripal Repayment $0 $0 $0 Long-term Liabilities Pripal Repayment $0 $0 $0 Purchase Other Current Assets $0 $0 $0 Purchase Long-term Assets $0 $0 $0 Dividends $0 $0 $0 Subtotal Cash Spent $2,260,453 $8,173,620 $14,687,779 Net Cash Flow $1,739,547 $2,326,380 $22,312,221 Cash Balance $2,598,547 $4,924,926 $27,237,147
  • 25. Bay of Bengal Wing Craft Page 21 Chart: Cash
  • 26. Bay of Bengal Wing Craft Page 22 7.6 Projected Balance Sheet Bay of Bengal WINGCRAFT's projected company balance sheet follows. Table: Balance Sheet Pro Forma Balance Sheet FY 2012 FY 2013 FY 2014 Assets Current Assets Cash $2,598,547 $4,924,926 $27,237,147 Inventory $269,792 $2,303,251 $2,177,655 Other Current Assets $100,000 $100,000 $100,000 Total Current Assets $2,968,339 $7,328,178 $29,514,802 Long-term Assets Long-term Assets $100,000 $100,000 $100,000 Accumulated Depreciation $0 $10,000 $23,000 Total Long-term Assets $100,000 $90,000 $77,000 Total Assets $3,068,339 $7,418,178 $29,591,802 Liabilities and Capital FY 2012 FY 2013 FY 2014 Current Liabilities Accounts Payable $151,440 $624,715 $1,126,428 Current Borrowing $0 $0 $0 Other Current Liabilities $0 $0 $0 Subtotal Current Liabilities $151,440 $624,715 $1,126,428 Long-term Liabilities $0 $0 $0 Total Liabilities $151,440 $624,715 $1,126,428 Paid-in Capital $1,617,000 $1,617,000 $1,617,000 Retained Earnings ($275,000) $1,299,898 $5,176,463 Earnings $1,574,898 $3,876,565 $21,671,911 Total Capital $2,916,898 $6,793,463 $28,465,374 Total Liabilities and Capital $3,068,339 $7,418,178 $29,591,802 Net Worth $2,916,898 $6,793,463 $28,465,374 7.7 Business Ratios Standard business ratios are laded in the following table. The ratios show an aggressive plan for growth in order to reach maximum production within three years. Return on investment reaches each year as we bring the new facility to maximum capacity and production. Return on sales and assets remain strong and cost of goods decreased based upon efficiency projections. Projections are based on the 2011/12 selling price.
  • 27. Bay of Bengal Wing Craft Page 23 Table: Ratios Ratio Analysis FY 2012 FY 2013 FY 2014 Industry Profile Sales Growth n.a. 162.50% 252.38% 6.60% Percent of Total Assets Inventory 8.79% 31.05% 7.36% 1.92% Other Current Assets 3.26% 1.35% 0.34% 29.79% Total Current Assets 96.74% 98.79% 99.74% 55.54% Long-term Assets 3.26% 1.21% 0.26% 44.46% Total Assets 100.00% 100.00% 100.00% 100.00% Current Liabilities 4.94% 8.42% 3.81% 36.66% Long-term Liabilities 0.00% 0.00% 0.00% 33.75% Total Liabilities 4.94% 8.42% 3.81% 70.41% Net Worth 95.06% 91.58% 96.19% 29.59% Percent of Sales Sales 100.00% 100.00% 100.00% 100.00% Gross Margin 66.92% 60.99% 81.25% 52.98% Selling, General & Administrative Expenses 27.55% 24.07% 22.68% 14.74% Advertising Expenses 0.22% 0.14% 0.05% 0.26% Profit Before Interest and Taxes 51.13% 47.95% 76.07% 4.89% Main Ratios Current 19.60 11.73 26.20 1.16 Quick 17.82 8.04 24.27 1.11 Total Debt to Total Assets 4.94% 8.42% 3.81% 70.41% Pre-tax Return on Net Worth 70.12% 74.11% 98.88% 32.74% Pre-tax Return on Assets 66.66% 67.87% 95.11% 9.69% Additional Ratios FY 2012 FY 2013 FY 2014 Net Profit Margin 39.37% 36.92% 58.57% n.a Return on Equity 53.99% 57.06% 76.13% n.a Activity Ratios Inventory Turnover 5.35 3.12 3.05 n.a Accounts Payable Turnover 12.96 12.17 12.17 n.a Payment Days 29 19 23 n.a Total Asset Turnover 1.30 1.42 1.25 n.a Debt Ratios Debt to Net Worth 0.05 0.09 0.04 n.a Current Liab. to Liab. 1.00 1.00 1.00 n.a Liquidity Ratios Net Working Capital $2,816,898 $6,703,463 $28,388,374 n.a Interest Coverage 0.00 0.00 0.00 n.a Additional Ratios Assets to Sales 0.77 0.71 0.80 n.a Current Debt/Total Assets 5% 8% 4% n.a Acid Test 17.82 8.04 24.27 n.a Sales/Net Worth 1.37 1.55 1.30 n.a Dividend Payout 0.00 0.00 0.00 n.a
  • 28. Appendix Page 1 Table: Sales Forecast Sales Forecast May Jun Jul Aug Sep Oct Nov Dec Jan Feb Mar Apr Sales BD-12 $0 $0 $0 $0 $0 $0 $0 $0 $0 $2,000,000 $2,000,000 $0 BD-30 $0 $0 $0 $0 $0 $0 $0 $0 $0 $0 $0 $0 Total Sales $0 $0 $0 $0 $0 $0 $0 $0 $0 $2,000,000 $2,000,000 $0 Direct Cost of Sales May Jun Jul Aug Sep Oct Nov Dec Jan Feb Mar Apr Labour $0 $7,000 $17,500 $38,750 $38,750 $38,750 $38,750 $38,750 $38,750 $53,333 $53,333 $68,333 Material $0 $0 $51,000 $51,000 $51,000 $80,000 $77,000 $51,000 $51,000 $77,000 $51,000 $51,000 Overhead $0 $127,500 $15,563 $15,563 $15,563 $15,563 $15,563 $15,563 $15,563 $15,563 $15,563 $15,563 Subtotal Direct Cost of Sales $0 $134,500 $84,063 $105,313 $105,313 $134,313 $131,313 $105,313 $105,313 $145,896 $119,896 $134,896
  • 29. Appendix Page 2 Table: Personnel Personnel Plan May Jun Jul Aug Sep Oct Nov Dec Jan Feb Mar Apr Engineering & Design $0 $67,000 $67,000 $69,750 $69,750 $69,750 $69,750 $69,750 $69,750 $80,000 $80,000 $80,000 Mechanical $0 $0 $27,500 $28,330 $28,330 $28,330 $28,330 $28,330 $28,330 $40,000 $40,000 $40,000 Assembly $0 $0 $0 $36,670 $36,670 $36,670 $36,670 $36,670 $36,670 $40,833 $40,833 $40,833 Sales $0 $0 $0 $0 $0 $0 $0 $0 $0 $15,500 $15,500 $27,500 Total People 0 13 15 20 20 20 20 20 20 23 23 23 Total Payroll $0 $67,000 $94,500 $134,750 $134,750 $134,750 $134,750 $134,750 $134,750 $176,333 $176,333 $188,333
  • 30. Appendix Page 3 Table: Profit and Loss Pro Forma Profit and Loss May Jun Jul Aug Sep Oct Nov Dec Jan Feb Mar Apr Sales $0 $0 $0 $0 $0 $0 $0 $0 $0 $2,000,000 $2,000,000 $0 Direct Cost of Sales $0 $134,500 $84,063 $105,313 $105,313 $134,313 $131,313 $105,313 $105,313 $145,896 $119,896 $134,896 Other Costs of Sales $0 $0 $0 $0 $0 $0 $0 $0 $0 $5,000 $5,000 $7,000 Total Cost of Sales $0 $134,500 $84,063 $105,313 $105,313 $134,313 $131,313 $105,313 $105,313 $150,896 $124,896 $141,896 Gross Margin $0 ($134,500) ($84,063) ($105,313) ($105,313) ($134,313) ($131,313) ($105,313) ($105,313) $1,849,104 $1,875,104 ($141,896) Gross Margin % 0.00% 0.00% 0.00% 0.00% 0.00% 0.00% 0.00% 0.00% 0.00% 92.46% 93.76% 0.00% Expenses Payroll $0 $7,000 $17,500 $38,750 $38,750 $38,750 $38,750 $38,750 $38,750 $53,333 $53,333 $68,333 Marketing/Promotion $0 $0 $0 $0 $0 $0 $0 $0 $0 $2,000 $2,000 $5,000 Depreciation $0 $0 $0 $0 $0 $0 $0 $0 $0 $0 $0 $0 Rent $0 $17,500 $8,750 $8,750 $8,750 $8,750 $8,750 $8,750 $8,750 $8,750 $8,750 $8,750 Utilities $0 $300 $450 $500 $500 $500 $500 $500 $500 $500 $500 $500 Insurance $0 $500 $500 $500 $500 $500 $500 $500 $500 $500 $500 $500 Payroll Taxes 15% $0 $1,050 $2,625 $5,813 $5,813 $5,813 $5,813 $5,813 $5,813 $8,000 $8,000 $10,250 Other $0 $0 $0 $0 $0 $0 $0 $0 $0 $10,000 $0 $0 Total Operating Expenses $0 $26,350 $29,825 $54,313 $54,313 $54,313 $54,313 $54,313 $54,313 $83,083 $73,083 $93,333 Profit Before Interest and Taxes $0 ($160,850) ($113,888) ($159,626) ($159,626) ($188,626) ($185,626) ($159,626) ($159,626) $1,766,021 $1,802,021 ($235,229) EBITDA $0 ($160,850) ($113,888) ($159,626) ($159,626) ($188,626) ($185,626) ($159,626) ($159,626) $1,766,021 $1,802,021 ($235,229) Interest Expense $0 $0 $0 $0 $0 $0 $0 $0 $0 $0 $0 $0 Taxes urred $0 ($36,996) ($26,194) ($36,714) ($36,714) ($43,384) ($42,694) ($36,714) ($36,714) $406,185 $414,465 ($54,103) Net Profit $0 ($123,855) ($87,694) ($122,912) ($122,912) ($145,242) ($142,932) ($122,912) ($122,912) $1,359,836 $1,387,556 ($181,126) Net Profit/Sales 0.00% 0.00% 0.00% 0.00% 0.00% 0.00% 0.00% 0.00% 0.00% 67.99% 69.38% 0.00%
  • 31. Appendix Page 4 Table: Cash Flow Pro Forma Cash Flow May Jun Jul Aug Sep Oct Nov Dec Jan Feb Mar Apr Cash Received Cash from Operations Cash Sales $0 $0 $0 $0 $0 $0 $0 $0 $0 $2,000,000 $2,000,000 $0 Subtotal Cash from Operations $0 $0 $0 $0 $0 $0 $0 $0 $0 $2,000,000 $2,000,000 $0 Additional Cash Received Sales Tax, VAT, HST/GST Received 0.00% $0 $0 $0 $0 $0 $0 $0 $0 $0 $0 $0 $0 New Current Borrowing $0 $0 $0 $0 $0 $0 $0 $0 $0 $0 $0 $0 New Other Liabilities (interest-free) $0 $0 $0 $0 $0 $0 $0 $0 $0 $0 $0 $0 New Long-term Liabilities $0 $0 $0 $0 $0 $0 $0 $0 $0 $0 $0 $0 Sales of Other Current Assets $0 $0 $0 $0 $0 $0 $0 $0 $0 $0 $0 $0 Sales of Long-term Assets $0 $0 $0 $0 $0 $0 $0 $0 $0 $0 $0 $0 New Investment Received $0 $0 $0 $0 $0 $0 $0 $0 $0 $0 $0 $0 Subtotal Cash Received $0 $0 $0 $0 $0 $0 $0 $0 $0 $2,000,000 $2,000,000 $0 Expenditures May Jun Jul Aug Sep Oct Nov Dec Jan Feb Mar Apr Expenditures from Operations Cash Spending $0 $7,000 $17,500 $38,750 $38,750 $38,750 $38,750 $38,750 $38,750 $53,333 $53,333 $68,333 Bill Payments $17,000 $2,862 $69,123 ($9,745) $108,994 $86,839 $162,281 $95,981 $33,895 $103,623 $662,634 $494,967 Subtotal Spent on Operations $17,000 $9,862 $86,623 $29,005 $147,744 $125,589 $201,031 $134,731 $72,645 $156,956 $715,967 $563,300 Additional Cash Spent Sales Tax, VAT, HST/GST Paid Out $0 $0 $0 $0 $0 $0 $0 $0 $0 $0 $0 $0 Pripal Repayment of Current Borrowing $0 $0 $0 $0 $0 $0 $0 $0 $0 $0 $0 $0 Other Liabilities Pripal Repayment $0 $0 $0 $0 $0 $0 $0 $0 $0 $0 $0 $0 Long-term Liabilities Pripal Repayment $0 $0 $0 $0 $0 $0 $0 $0 $0 $0 $0 $0 Purchase Other Current Assets $0 $0 $0 $0 $0 $0 $0 $0 $0 $0 $0 $0 Purchase Long-term Assets $0 $0 $0 $0 $0 $0 $0 $0 $0 $0 $0 $0 Dividends $0 $0 $0 $0 $0 $0 $0 $0 $0 $0 $0 $0
  • 32. Appendix Page 5 Subtotal Cash Spent $17,000 $9,862 $86,623 $29,005 $147,744 $125,589 $201,031 $134,731 $72,645 $156,956 $715,967 $563,300 Net Cash Flow ($17,000) ($9,862) ($86,623) ($29,005) ($147,744) ($125,589) ($201,031) ($134,731) ($72,645) $1,843,044 $1,284,033 ($563,300) Cash Balance $842,000 $832,138 $745,515 $716,510 $568,766 $443,176 $242,145 $107,414 $34,769 $1,877,813 $3,161,846 $2,598,547
  • 33. Appendix Page 6 Table: Balance Sheet Pro Forma Balance Sheet May Jun Jul Aug Sep Oct Nov Dec Jan Feb Mar Apr Assets Starting Balances Current Assets Cash $859,000 $842,000 $832,138 $745,515 $716,510 $568,766 $443,176 $242,145 $107,414 $34,769 $1,877,813 $3,161,846 $2,598,547 Inventory $300,000 $300,000 $269,000 $184,937 $210,626 $210,626 $268,626 $262,626 $210,626 $210,626 $291,792 $239,792 $269,792 Other Current Assets $100,000 $100,000 $100,000 $100,000 $100,000 $100,000 $100,000 $100,000 $100,000 $100,000 $100,000 $100,000 $100,000 Total Current Assets $1,259,000 $1,242,000 $1,201,138 $1,030,452 $1,027,136 $879,392 $811,802 $604,771 $418,040 $345,395 $2,269,605 $3,501,638 $2,968,339 Long-term Assets Long-term Assets $100,000 $100,000 $100,000 $100,000 $100,000 $100,000 $100,000 $100,000 $100,000 $100,000 $100,000 $100,000 $100,000 Accumulated Depreciation $0 $0 $0 $0 $0 $0 $0 $0 $0 $0 $0 $0 $0 Total Long-term Assets $100,000 $100,000 $100,000 $100,000 $100,000 $100,000 $100,000 $100,000 $100,000 $100,000 $100,000 $100,000 $100,000 Total Assets $1,359,000 $1,342,000 $1,301,138 $1,130,452 $1,127,136 $979,392 $911,802 $704,771 $518,040 $445,395 $2,369,605 $3,601,638 $3,068,339 Liabilities and Capital May Jun Jul Aug Sep Oct Nov Dec Jan Feb Mar Apr Current Liabilities Accounts Payable $17,000 $0 $82,993 $0 $119,596 $94,763 $172,416 $108,316 $44,497 $94,763 $659,137 $503,614 $151,440 Current Borrowing $0 $0 $0 $0 $0 $0 $0 $0 $0 $0 $0 $0 $0 Other Current Liabilities $0 $0 $0 $0 $0 $0 $0 $0 $0 $0 $0 $0 $0 Subtotal Current Liabilities $17,000 $0 $82,993 $0 $119,596 $94,763 $172,416 $108,316 $44,497 $94,763 $659,137 $503,614 $151,440 Long-term Liabilities $0 $0 $0 $0 $0 $0 $0 $0 $0 $0 $0 $0 $0 Total Liabilities $17,000 $0 $82,993 $0 $119,596 $94,763 $172,416 $108,316 $44,497 $94,763 $659,137 $503,614 $151,440 Paid-in Capital $1,617,000 $1,617,000 $1,617,000 $1,617,000 $1,617,000 $1,617,000 $1,617,000 $1,617,000 $1,617,000 $1,617,000 $1,617,000 $1,617,000 $1,617,000 Retained Earnings ($275,000) ($275,000) ($275,000) ($275,000) ($275,000) ($275,000) ($275,000) ($275,000) ($275,000) ($275,000) ($275,000) ($275,000) ($275,000) Earnings $0 $0 ($123,855) ($211,548) ($334,460) ($457,372) ($602,613) ($745,545) ($868,456) ($991,368) $368,468 $1,756,024 $1,574,898 Total Capital $1,342,000 $1,342,000 $1,218,146 $1,130,452 $1,007,540 $884,628 $739,387 $596,455 $473,544 $350,632 $1,710,468 $3,098,024 $2,916,898 Total Liabilities and Capital $1,359,000 $1,342,000 $1,301,138 $1,130,452 $1,127,136 $979,392 $911,802 $704,771 $518,040 $445,395 $2,369,605 $3,601,638 $3,068,339 Net Worth $1,342,000 $1,342,000 $1,218,146 $1,130,452 $1,007,540 $884,628 $739,387 $596,455 $473,544 $350,632 $1,710,468 $3,098,024 $2,916,898