Mercer Capital's Value Focus: Construction Industry | Q2 2013
•
0 recomendaciones•381 vistas

Mercer Capital’s Construction Industry newsletter is a quarterly publication providing perspective on valuation issues pertinent to the construction industry, including residential, commercial, civil, paving, concrete, and more. Each issue includes a segment focus, market overview, mergers and acquisitions review, and more.

Recomendados
Más contenido relacionado
La actualidad más candente
La actualidad más candente (19)
Destacado
Destacado (6)
Similar a Mercer Capital's Value Focus: Construction Industry | Q2 2013
Similar a Mercer Capital's Value Focus: Construction Industry | Q2 2013 (20)
Más de Mercer Capital
Más de Mercer Capital (20)
Último
Último (20)
Mercer Capital's Value Focus: Construction Industry | Q2 2013
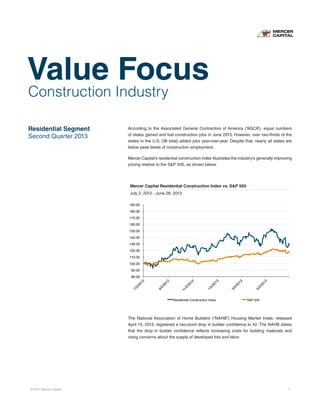
- 1. Construction Industry Residential Segment Second Quarter 2013 According to the Associated General Contractors of America (“AGCA”), equal numbers of states gained and lost construction jobs in June 2013. However, over two-thirds of the states in the U.S. (36 total) added jobs year-over-year. Despite that, nearly all states are below peak levels of construction employment. Mercer Capital’s residential construction index illustrates the industry’s generally improving pricing relative to the S&P 500, as shown below. The National Association of Home Builders’ (“NAHB”) Housing Market Index, released April 15, 2013, registered a two-point drop in builder confidence to 42. The NAHB states that the drop in builder confidence reflects increasing costs for building materials and rising concerns about the supply of developed lots and labor. Value Focus Mercer Capital Residential Construction Index vs. S&P 500 July 2, 2012 - June 28, 2013 © 2013 Mercer Capital 1 80.00 ! 90.00 ! 100.00 ! 110.00 ! 120.00 ! 130.00 ! 140.00 ! 150.00 ! 160.00 ! 170.00 ! 180.00 ! 190.00 ! 7/2/2012! 9/2/2012! 11/2/2012! 1/2/2013! 3/2/2013! 5/2/2013! Residential Construction Index! S&P 500!
- 2. Mercer Capital’s Value Focus: Construction Industry Second Quarter 2013 © 2013 Mercer Capital 2 According to the Department of Commerce: • Multi-family housing starts rose 7.0% in March 2013, while single-family production slipped 4.8% for the same month. • Single-family housing starts in March 2013 were at a rate of 619,000 units, reflecting a decline due to a substantial upward revision to the February data. Without the revision, no change would have been recorded. • Multi-family housing starts were at a seasonally adjusted annual rate of 417,000 units, which is the highest rate since January 2006. • Total permit issuance fell 3.9% to 902,000 units, reflecting a 0.5% reduction on the single-family side and a 10% reduction on the multi-family side. Mercer Capital’s non-residential construction index illustrates the industry’s slightly less favorable pricing relative to the S&P 500, as shown below. • The estimated annual rate of public construction spending in February 2013 was $272.1 billion, 0.9% above the revised January 2013 estimate of $269.6 billion. Highway construction was at a seasonally adjusted annual rate of $81.4 billion, which was 3.4% above the revised January estimate of $78.7 billion. • According to the Associated Builders and Contractors Construction Economic Update, construction industry unemployment rate fell to 14.7% in March, down from 15.7% in February. 18,000 construction jobs were added in March. Non-Residential Segment Second Quarter 2013 Mercer Capital Non-Residential Construction Index vs. S&P 500 July 2, 2012 - June 28, 2013 70.00 ! 80.00 ! 90.00 ! 100.00 ! 110.00 ! 120.00 ! 130.00 ! 140.00 ! 7/2/2012! 9/2/2012! 11/2/2012! 1/2/2013! 3/2/2013! 5/2/2013! Mercer Capital Non-Residential Construction Index vs. S&P 500 July 2, 2012 - June 28, 2013 Non-Residential Construction Index! S&P 500!
- 3. Mercer Capital’s Value Focus: Construction Industry Second Quarter 2013 © 2013 Mercer Capital 3 Mercer Capital Non-Residential Segment Construction Index Closing Prices as of June 28, 2013 Mercer Capital Residential Segment Construction Index Closing Prices as of June 28, 2013 Ticker Current 52 Wk Perf (%) Market Cap ($M) Ent. Value ($M) LTM Rev. ($M) EBITDA ($M) Rev. Growth (%) EBITDA Margin (%) EV/ Rev. (x) EV/ EBITDA (x) PULTE HOMES INC PHM $18.97 73.9% $7,351.06 $9,862.79 $5,101.72 $371.85 21.1% 7.3% 1.9 26.5 LENNAR CORP LEN $36.04 15.9% n/a n/a $4,369.80 $404.53 27.5% n/a n/a n/a TOLL BROTHERS INC TOL $32.63 8.9% $5,523.15 $8,012.06 $2,127.75 $129.98 40.2% 6.1% 3.8 61.6 KB HOME KBH $19.63 103.0% $1,640.08 $3,603.83 $1,710.78 $43.44 21.8% n/a 2.1 n/a NVR INC NVR $922.00 8.3% $4,607.14 $5,206.15 $3,354.41 $312.61 22.2% 9.3% 1.6 16.7 Ticker Current 52 Wk Perf (%) Market Cap ($M) Ent. Value ($M) LTM Rev. ($M) EBITDA ($M) Rev. Growth (%) EBITDA Margin (%) EV/ Rev. (x) EV/ EBITDA (x) BAKER (MICHAEL) CORP BKR $27.11 4.4% $262.05 $262.05 $585.71 $26.07 2.9% n/a 0.4 n/a URS CORP URS $47.22 35.3% $3,588.72 $5,674.12 $11,413.50 $848.50 19.1% 7.4% 0.5 6.7 FOSTER WHEELER AG FWLT $21.71 30.2% $2,238.60 n/a $3,277.83 $284.66 n/a 8.7% n/a n/a MCDERMOTT INTL INC MDR $8.18 -26.6% $1,933.91 $2,035.12 $3,721.43 $496.50 13.7% 13.3% 0.5 4.1 JACOBS ENGINEERING GRP INC JEC $55.13 46.4% $7,206.60 $7,657.42 $11,153.88 $744.54 3.3% 6.7% 0.7 10.3 GRANITE CONSTRUCTION INC GVA $29.76 15.3% $1,154.99 n/a $2,151.58 $99.95 4.3% 4.6% n/a n/a FLUOR CORP FLR $59.31 20.6% $9,659.30 $10,174.05 $28,472.63 $1,020.39 15.7% 3.6% 0.4 10.0 VULCAN MATERIALS CO VMC $48.41 21.4% $6,290.98 $8,957.00 $2,569.59 $380.32 -1.7% 14.8% 3.5 23.6 INSITUFORM TECHNOLOGIES AEGN $22.51 22.4% $882.17 $1,132.77 $1,029.02 $103.65 7.3% 10.1% 1.1 10.9 CHICAGO BRIDGE & IRON CO CBI $59.66 57.0% $6,383.14 $8,280.57 $6,535.37 $575.40 36.2% 8.8% 1.3 14.4 SHAW GROUP INC SHAW $47.61 74.7% $3,172.54 $4,758.84 $5,860.04 $225.08 -2.9% 3.8% 0.8 21.1
- 4. Mercer Capital Copyright © 2013 Mercer Capital Management, Inc. All rights reserved. It is illegal under Federal law to reproduce this publication or any portion of its contents without the publisher’s permission. Media quotations with source attribution are encouraged. Reporters requesting additional information or editorial comment should contact Barbara Walters Price at 901.685.2120. Mercer Capital’s Value Focus is published quarterly and does not constitute legal or financial consulting advice. It is offered as an information service to our clients and friends. Those interested in specific guidance for legal or accounting matters should seek competent professional advice. Inquiries to discuss specific valuation matters are welcomed. To add your name to our mailing list to receive this complimentary publication, visit our web site at www.mercercapital.com. Contact Us Timothy R. Lee, ASA 901.322.9740 leet@mercercapital.com Wendy S. Ingalls, CPA/ABV, CBA, ASA 901.322.9716 ingallsw@mercercapital.com Mercer Capital 5100 Poplar Avenue, Suite 2600 Memphis, Tennessee 38137 901.685.2120 (P) www.mercercapital.com Mercer Capital provides valuation and transaction advisory services to the construction and building materials industries. Industry Segments Construction • Commercial • Civil • Residential Building Materials • Aluminum • Brick • Cement • Concrete • Glass • Lumber • Metals and mining • Steel • Special construction products Construction Industry Services