Norfolk MA Real Estate States for SEPT 2016 by The Greater Boston Real Estate Board
•
0 recomendaciones•724 vistas

Norfolk MA Real Estate States for SEPT 2016 by The Greater Boston Real Estate Board
Recomendados

Recomendados
Más contenido relacionado
La actualidad más candente
La actualidad más candente (20)
Similar a Norfolk MA Real Estate States for SEPT 2016 by The Greater Boston Real Estate Board
Similar a Norfolk MA Real Estate States for SEPT 2016 by The Greater Boston Real Estate Board (20)
Más de Michael Mahoney
Más de Michael Mahoney (20)
Último
Último (20)
Norfolk MA Real Estate States for SEPT 2016 by The Greater Boston Real Estate Board
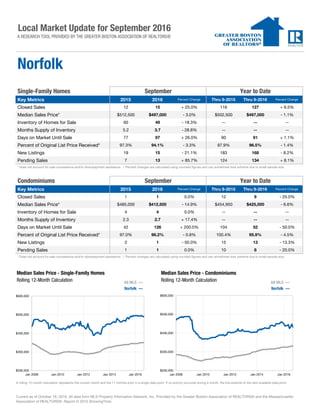
- 1. Key Metrics 2015 2016 Percent Change Thru 9-2015 Thru 9-2016 Percent Change Closed Sales 12 15 + 25.0% 116 127 + 9.5% Median Sales Price* $512,500 $497,000 - 3.0% $502,500 $497,000 - 1.1% Inventory of Homes for Sale 60 49 - 18.3% -- -- -- Months Supply of Inventory 5.2 3.7 - 28.8% -- -- -- Days on Market Until Sale 77 97 + 26.0% 90 91 + 1.1% Percent of Original List Price Received* 97.3% 94.1% - 3.3% 97.9% 96.5% - 1.4% New Listings 19 15 - 21.1% 183 168 - 8.2% Pending Sales 7 13 + 85.7% 124 134 + 8.1% * Does not account for sale concessions and/or downpayment assistance. | Percent changes are calculated using rounded figures and can sometimes look extreme due to small sample size. Key Metrics 2015 2016 Percent Change Thru 9-2015 Thru 9-2016 Percent Change Closed Sales 1 1 0.0% 12 9 - 25.0% Median Sales Price* $485,000 $412,500 - 14.9% $454,950 $425,000 - 6.6% Inventory of Homes for Sale 4 4 0.0% -- -- -- Months Supply of Inventory 2.3 2.7 + 17.4% -- -- -- Days on Market Until Sale 42 126 + 200.0% 104 52 - 50.0% Percent of Original List Price Received* 97.0% 96.2% - 0.8% 100.4% 95.9% - 4.5% New Listings 2 1 - 50.0% 15 13 - 13.3% Pending Sales 1 1 0.0% 10 8 - 20.0% * Does not account for sale concessions and/or downpayment assistance. | Percent changes are calculated using rounded figures and can sometimes look extreme due to small sample size. A RESEARCH TOOL PROVIDED BY THE GREATER BOSTON ASSOCIATION OF REALTORS® Local Market Update for September 2016 Norfolk September Year to Date September Year to DateSingle-Family Homes Condominiums Current as of October 16, 2016. All data from MLS Property Information Network, Inc. Provided by the Greater Boston Association of REALTORS® and the Massachusetts Association of REALTORS®. Report © 2016 ShowingTime. Norfolk — Norfolk — All MLS —All MLS — A rolling 12-month calculation represents the current month and the 11 months prior in a single data point. If no activity occurred during a month, the line extends to the next available data point. $200,000 $300,000 $400,000 $500,000 $600,000 Jan 2008 Jan 2010 Jan 2012 Jan 2014 Jan 2016 Rolling 12-Month Calculation $200,000 $300,000 $400,000 $500,000 $600,000 Jan 2008 Jan 2010 Jan 2012 Jan 2014 Jan 2016 Rolling 12-Month Calculation Median Sales Price - Single-Family Homes Median Sales Price - Condominiums