SlideShare una empresa de Scribd logo
1 de 27
Descargar para leer sin conexión
Sales
New Listings
Active Listings
Average Price
Avg. LDOM
Avg. PDOM
13,613 8,008 -41.2%
20,841 18,413 -11.7%
11,668 13,098 12.3%
$1,090,414 $1,254,436 15.0%
10 11 1.1%
14 14 0%
2021 2022 % Chg.
Year
Market Watch
APRIL 2022
Economic Indicators
April 2022
GTA REALTORS®
RELEASE APRIL STATS
TORONTO, ONTARIO, MAY 4, 2022 – The Greater Toronto Area (GTA) housing market continued its adjustment to
higher borrowing costs, with the number of transactions down on a monthly and annual basis. As has been the case
with previous rate tightening cycles, some home buyers have moved to the sidelines to determine how they will
reposition themselves in the marketplace given the higher rate environment and related impact on affordability.
“Based on the trends observed in the April housing market, it certainly appears that the Bank of Canada is achieving
its goal of slowing consumer spending as it fights high inflation. Negotiated mortgage rates rose sharply over the past
four weeks, prompting some buyers to delay their purchase. Moving forward, it will be interesting to see the balance
the Bank of Canada strikes between combatting inflation versus stunting economic growth and related government
revenues as we continue to recover from and pay for pandemic-related programs,” said TRREB President Kevin
Crigger.
GTA REALTORS® reported 8,008 homes sold through TRREB’s MLS® System in April 2022 – a 41.2 per cent
decrease compared to April 2021 and a 27 per cent decrease compared to March 2022. On a year-over-year basis,
the decline in sales was greater in the ‘905’ area code regions surrounding Toronto, particularly for detached houses.
The MLS® Home Price Index Composite Benchmark was up by 30.6 per cent year-over-year in April 2022. The
benchmark level in April was down in comparison to the March level. The average selling price, at $1,254,436, was
up by 15 per cent compared to April 2021, but down compared to the average selling price of $1,300,082 in March
2022.
“Despite slower sales, market conditions remained tight enough to support higher selling prices compared to last
year. However, in line with TRREB’s forecast, there is evidence of buyers responding to increased choice in the
marketplace, with the average and benchmark prices dipping month-over-month. It is anticipated that there will be
enough competition between buyers to support continued price growth relative to 2021, but the annual pace of
growth will moderate in the coming months,” said TRREB Chief Market Analyst Jason Mercer.
Sources and Notes:
i - Statistics Canada, Quarter-over-quarter
growth, annualized
ii - Statistics Canada, Year-over-year
growth for the most recently reported
month
iii - Bank of Canada, Rate from most
recent Bank of Canada announcement
iv - Bank of Canada, Rates for most
recently completed month
For All TRREB Member Inquiries:
For All Media/Public Inquiries:
(416) 443-8152
(416) 443-8158
April 2021
April 2022
8,008
13,613
Detached
Semi-Detached
Townhouse
Condo Apt
868 2,732 3,600 1,947,975 1,526,791 1,628,343
311 491 802 1,494,640 1,110,142 1,259,243
335 1,033 1,368 1,086,986 997,416 1,019,350
1,488 685 2,173 820,835 722,601 789,869
Sales Average Price
416 905 Total 416 905 Total
Home Type
Year-Over-Year Per Cent Change
April 2021
April 2022
$1,254,436
$1,090,414
Detached
Semi-Detached
Townhouse
Condo Apt
-34.0% -47.2% -44.5% 14.9% 16.8% 17.5%
-35.7% -39.6% -38.2% 14.1% 19.9% 17.8%
-41.6% -44.1% -43.5% 15.0% 20.0% 18.8%
-34.5% -32.2% -33.8% 12.8% 18.0% 14.1%
TRREB MLS®
Sales Activity1,7
TRREB MLS®
Average Price1,7
Sales & Average Price By Major Home Type1,7
Year-Over-Year Summary1,7
April 2022 1.00%
April 2022 3.20%
1 Year 3.29%
3 Year 4.09%
5 Year 4.99%
March 2022 6.7%
March 2022 7.2%
March 2022 7.8%
Q4 2021 6.6%
Real GDP Growth
Toronto Employment Growth
Toronto Unemployment Rate (SA)
Inflation (Yr./Yr. CPI Growth)
Bank of Canada Overnight Rate
Prime Rate
1
Market Watch, April 2022
Copyright®
2021 Toronto Regional Real Estate Board
April 2022
Mortgage Rates
2
3
1
5
5
Toronto Regional Real Estate Board
YEAR-TO-DATE, 2022
$0 to $99,999
$100,000 to $199,999
$200,000 to $299,999
$300,000 to $399,999
$400,000 to $499,999
$500,000 to $599,999
$600,000 to $699,999
$700,000 to $799,999
$800,000 to $899,999
$900,000 to $999,999
$1,000,000 to $1,249,999
$1,250,000 to $1,499,999
$1,500,000 to $1,749,999
$1,750,000 to $1,999,999
$2,000,000+
1 0 0 0 2 0 0 0 0 3
0 0 0 0 0 0 0 0 0 0
0 0 0 0 7 0 0 0 0 7
6 0 0 0 13 0 2 0 1 22
6 1 0 3 51 0 4 0 0 65
11 1 1 21 275 0 1 0 1 311
29 7 5 56 617 0 0 1 4 719
74 28 28 125 539 2 0 2 2 800
143 46 91 164 275 6 1 0 0 726
248 110 191 152 150 8 1 1 0 861
644 285 209 83 117 13 0 2 0 1,353
775 188 125 28 59 7 1 0 0 1,183
587 71 49 13 22 2 1 0 0 745
363 30 9 3 20 0 0 2 0 427
712 35 8 4 26 0 0 0 0 785
Detached Semi-Detached Att/Row/Twnhouse Condo Townhouse Condo Apt Link Co-Op Apt Det Condo Co-Ownership Apt Total
Name
$0 to $99,999
$100,000 to $199,999
$200,000 to $299,999
$300,000 to $399,999
$400,000 to $499,999
$500,000 to $599,999
$600,000 to $699,999
$700,000 to $799,999
$800,000 to $899,999
$900,000 to $999,999
$1,000,000 to $1,249,999
$1,250,000 to $1,499,999
$1,500,000 to $1,749,999
$1,750,000 to $1,999,999
$2,000,000+
1 0 0 0 5 0 0 0 0 6
0 0 0 0 4 0 0 0 0 4
1 0 0 1 23 0 0 0 0 25
10 0 2 2 50 0 5 0 5 74
21 1 0 8 267 0 11 0 12 320
28 1 4 58 1,097 0 3 0 5 1,196
79 10 7 177 2,692 1 6 1 8 2,981
204 51 46 392 2,613 4 3 2 3 3,318
376 122 179 594 1,453 14 2 1 1 2,742
707 260 569 708 760 23 3 7 0 3,037
2,120 939 1,019 513 628 44 0 10 0 5,273
3,198 1,041 800 138 251 57 1 6 0 5,492
2,822 317 251 47 95 24 1 3 1 3,561
1,699 106 65 16 62 4 0 3 0 1,955
3,342 128 46 12 93 0 0 0 0 3,621
Detached Semi-Detached Att/Row/Twnhouse Condo Townhouse Condo Apt Link Co-Op Apt Det Condo Co-Ownership Apt Total
Name
APRIL 2022
SALES BY PRICE RANGE AND HOUSE TYPE 1,7
Total Sales
Share of Total Sales (%)
Average Price ($)
3,600 802 716 652 2,173 38 11 8 8 8,008
45.0% 10.0% 8.9% 8.1% 27.1% 0.5% 0.1% 0.1% 0.1% 100.0%
$1,628,343 $1,259,243 $1,119,648 $909,207 $789,869 $1,076,579 $726,000 $1,103,375 $625,000 $1,254,436
14,610 2,976 2,989 2,666 10,095 171 35 33 35 33,610
43.5% 8.9% 8.9% 7.9% 30.0% 0.5% 0.1% 0.1% 0.1% 100.0%
$1,713,945 $1,311,358 $1,203,724 $941,127 $790,247 $1,218,771 $634,940 $1,195,035 $565,062 $1,288,834
Total Sales
Share of Total Sales (%)
Average Price ($)
TRREB Total 8,008 $10,045,524,994 $1,254,436 $1,098,000 18,413 68.0% 13,098 0.9 107% 11 14
Halton Region 824 $1,140,373,440 $1,383,948 $1,230,000 1,922 72.2% 1,273 0.7 104% 10 13
Burlington 291 $358,021,492 $1,230,314 $1,083,000 584 75.3% 358 0.6 106% 9 11
Halton Hills 89 $121,007,416 $1,359,634 $1,200,000 203 73.8% 129 0.7 106% 9 12
Milton 176 $207,889,389 $1,181,190 $1,139,950 469 70.6% 293 0.6 105% 10 14
Oakville 268 $453,455,143 $1,691,997 $1,572,500 666 70.3% 493 0.9 102% 11 15
Peel Region 1,535 $1,906,995,823 $1,242,343 $1,132,500 3,893 69.4% 2,564 0.8 106% 10 15
Brampton 716 $889,027,068 $1,241,658 $1,155,250 1,997 68.5% 1,285 0.7 106% 10 15
Caledon 99 $175,417,100 $1,771,890 $1,522,000 237 63.9% 178 1.2 103% 14 22
Mississauga 720 $842,551,655 $1,170,211 $1,028,500 1,659 71.1% 1,101 0.8 106% 10 13
City of Toronto 3,024 $3,759,044,412 $1,243,070 $980,000 6,164 65.4% 4,732 1.2 108% 12 15
Toronto West 847 $981,902,357 $1,159,271 $1,005,000 1,609 67.3% 1,151 1.1 109% 13 15
Toronto Central 1,411 $1,875,334,304 $1,329,082 $882,250 3,080 62.2% 2,679 1.4 105% 13 17
Toronto East 766 $901,807,751 $1,177,295 $1,123,500 1,475 71.0% 902 0.8 113% 9 11
York Region 1,230 $1,754,780,008 $1,426,650 $1,325,000 3,269 66.1% 2,665 1.1 105% 12 16
Aurora 76 $114,944,576 $1,512,429 $1,327,500 223 66.0% 196 1.0 106% 11 15
East Gwillimbury 50 $75,169,500 $1,503,390 $1,291,000 139 66.4% 114 1.0 104% 15 19
Georgina 69 $69,825,000 $1,011,957 $920,000 205 66.8% 152 1.0 106% 12 17
King 25 $51,541,850 $2,061,674 $2,012,850 84 61.7% 98 2.1 101% 16 17
Markham 293 $428,117,914 $1,461,153 $1,400,000 753 67.2% 597 1.0 106% 12 15
Newmarket 115 $145,696,300 $1,266,924 $1,205,000 256 73.9% 166 0.7 108% 9 14
Richmond Hill 198 $294,831,444 $1,489,048 $1,450,000 582 63.0% 525 1.3 106% 12 16
Vaughan 336 $481,640,015 $1,433,452 $1,346,500 854 65.7% 668 1.1 105% 11 17
Whitchurch-Stouffville 68 $93,013,409 $1,367,844 $1,257,500 173 64.6% 149 1.1 104% 11 15
Durham Region 1,089 $1,171,036,798 $1,075,332 $999,999 2,338 74.5% 1,278 0.6 114% 8 11
Ajax 152 $179,258,839 $1,179,334 $1,145,000 394 72.3% 207 0.5 114% 9 11
Brock 13 $11,143,910 $857,224 $875,000 51 69.2% 45 1.0 106% 13 15
Clarington 224 $230,183,125 $1,027,603 $950,000 406 75.3% 200 0.5 116% 7 10
Oshawa 296 $277,221,913 $936,561 $860,000 636 75.5% 367 0.6 116% 9 12
Pickering 123 $138,250,506 $1,123,988 $999,999 276 74.6% 159 0.6 113% 8 10
Scugog 32 $38,786,300 $1,212,072 $1,100,000 50 77.2% 30 0.9 111% 7 8
Uxbridge 33 $45,554,614 $1,380,443 $1,225,000 60 74.9% 32 0.9 110% 7 9
Whitby 216 $250,637,591 $1,160,359 $1,100,578 465 74.0% 238 0.5 114% 7 11
Dufferin County 64 $60,077,500 $938,711 $842,000 118 76.6% 66 0.5 104% 9 13
Orangeville 64 $60,077,500 $938,711 $842,000 118 76.6% 66 0.5 104% 9 13
Simcoe County 242 $253,217,013 $1,046,351 $970,000 709 66.7% 520 0.9 103% 12 15
Adjala-Tosorontio 14 $16,056,500 $1,146,893 $1,125,000 27 70.4% 22 1.2 103% 9 11
Bradford West Gwillimbury 43 $51,695,899 $1,202,230 $1,130,000 171 62.4% 128 0.9 102% 10 15
Essa 39 $35,806,900 $918,126 $860,000 96 68.0% 73 0.8 105% 12 16
Innisfil 72 $72,007,013 $1,000,097 $890,000 230 64.4% 165 1.1 103% 10 13
New Tecumseth 74 $77,650,701 $1,049,334 $975,000 185 72.2% 132 0.8 104% 14 17
Sub_Municipality # of Sales Dollar Volume Average Price Median Price New Listings SNLR (Trend) Active Listings Mos Inv (Trend) Avg. SP/LP Avg. LDOM Avg. PDOM
Toronto Regional Real Estate Board
SUMMARY OF EXISTING HOME TRANSACTIONS
ALL TRREB AREAS
ALL HOME TYPES, APRIL 2022
1 1 1 2 8 3 9 4 5
3
Market Watch, April 2022
Copyright® 2021 Toronto Regional Real Estate Board
5
TRREB Total 8,008 $10,045,524,994 $1,254,436 $1,098,000 18,413 68.0% 13,098 0.9 107% 11 14
City of Toronto Total 3,024 $3,759,044,412 $1,243,070 $980,000 6,164 65.4% 4,732 1.2 108% 12 15
Toronto West 847 $981,902,357 $1,159,271 $1,005,000 1,609 67.3% 1,151 1.1 109% 13 15
Toronto W01 49 $64,106,918 $1,308,304 $960,000 86 67.1% 62 0.9 112% 8 11
Toronto W02 102 $153,467,312 $1,504,581 $1,365,000 163 67.5% 85 0.8 115% 11 13
Toronto W03 58 $65,203,994 $1,124,207 $1,100,500 110 65.4% 84 1.0 114% 9 12
Toronto W04 100 $104,480,670 $1,044,807 $950,000 148 64.8% 106 1.3 107% 14 16
Toronto W05 126 $118,795,025 $942,818 $926,500 252 69.5% 183 1.1 108% 11 13
Toronto W06 141 $144,399,979 $1,024,113 $850,000 297 62.4% 247 1.4 107% 16 21
Toronto W07 31 $51,048,005 $1,646,710 $1,505,000 53 69.1% 32 0.9 108% 9 10
Toronto W08 138 $181,976,838 $1,318,673 $885,000 276 71.3% 187 0.9 106% 16 17
Toronto W09 46 $50,343,642 $1,094,427 $954,000 88 68.4% 61 1.1 105% 14 15
Toronto W10 56 $48,079,974 $858,571 $750,000 136 69.2% 104 0.9 109% 12 14
Toronto Central 1,411 $1,875,334,304 $1,329,082 $882,250 3,080 62.2% 2,679 1.4 105% 13 17
Toronto C01 431 $420,170,060 $974,873 $786,000 894 63.6% 754 1.3 106% 12 16
Toronto C02 94 $177,339,815 $1,886,594 $1,339,750 202 55.8% 188 2.1 103% 14 22
Toronto C03 50 $96,899,335 $1,937,987 $1,670,000 115 56.7% 100 1.6 110% 11 17
Toronto C04 76 $195,790,868 $2,576,196 $2,300,000 117 66.7% 88 1.2 103% 12 16
Toronto C06 39 $42,418,611 $1,087,657 $775,000 75 61.0% 54 1.3 106% 13 17
Toronto C07 77 $95,824,847 $1,244,479 $960,000 200 61.8% 177 1.4 104% 12 16
Toronto C08 176 $162,087,262 $920,950 $776,000 464 59.1% 424 1.5 105% 12 17
Toronto C09 26 $61,454,388 $2,363,630 $2,118,500 53 63.2% 46 1.8 102% 26 28
Toronto C10 79 $96,782,799 $1,225,099 $921,000 167 64.0% 126 1.3 106% 13 17
Toronto C11 43 $78,699,004 $1,830,209 $1,600,000 81 68.9% 45 1.0 111% 11 12
Toronto C12 24 $96,391,000 $4,016,292 $3,582,000 61 50.7% 98 3.4 100% 16 34
Toronto C13 50 $68,184,624 $1,363,692 $906,850 104 67.4% 96 1.2 103% 19 22
Toronto C14 115 $137,957,814 $1,199,633 $818,000 260 61.9% 245 1.4 103% 13 17
Toronto C15 131 $145,333,877 $1,109,419 $872,000 287 65.0% 238 1.2 105% 13 18
Toronto East 766 $901,807,751 $1,177,295 $1,123,500 1,475 71.0% 902 0.8 113% 9 11
Toronto E01 83 $115,663,239 $1,393,533 $1,348,200 128 69.4% 58 0.7 114% 8 10
Toronto E02 78 $122,708,380 $1,573,184 $1,425,000 120 70.7% 46 0.7 115% 7 9
Toronto E03 99 $136,945,913 $1,383,292 $1,310,000 161 65.9% 79 0.9 118% 7 10
Toronto E04 82 $84,072,600 $1,025,276 $1,037,450 186 71.0% 113 0.7 115% 8 9
Toronto E05 69 $67,177,444 $973,586 $900,000 138 74.3% 108 0.8 107% 13 15
Toronto E06 36 $44,019,610 $1,222,767 $1,189,950 71 61.6% 40 1.0 110% 7 9
Toronto E07 63 $65,318,488 $1,036,801 $990,000 148 71.3% 119 0.8 110% 13 15
Toronto E08 60 $61,379,340 $1,022,989 $940,257 111 71.3% 80 0.9 111% 8 9
Toronto E09 76 $74,333,889 $978,077 $980,500 192 74.4% 126 0.7 113% 10 12
Toronto E10 51 $66,138,629 $1,296,836 $1,210,000 108 73.3% 58 0.7 112% 11 12
Toronto E11 69 $64,050,219 $928,264 $875,000 112 74.4% 75 0.7 114% 10 12
Municipality # of Sales Dollar Volume Average Price Median Price New Listings SNLR (Trend) Active Listings Mos Inv (Trend) Avg. SP/LP Avg. LDOM Avg. PDOM
Toronto Regional Real Estate Board
ALL HOME TYPES, APRIL 2022
SUMMARY OF EXISTING HOME TRANSACTIONS
CITY OF TORONTO MUNICIPAL BREAKDOWN
1 1 1 2 8 3 9 4 5
4
Market Watch, April 2022
Copyright® 2021 Toronto Regional Real Estate Board
5
TRREB Total 33,610 $43,317,702,308 $1,288,834 $1,150,000 60,608 112% 10 13
Halton Region 3,337 $4,946,943,862 $1,482,452 $1,336,500 6,020 111% 8 11
Burlington 1,055 $1,399,724,081 $1,326,753 $1,210,000 1,749 112% 8 10
Halton Hills 348 $487,317,823 $1,400,339 $1,250,000 595 112% 8 11
Milton 793 $1,019,402,945 $1,285,502 $1,243,000 1,538 114% 7 9
Oakville 1,141 $2,040,499,013 $1,788,343 $1,608,000 2,138 108% 10 12
Peel Region 6,658 $8,524,997,821 $1,280,414 $1,200,000 12,490 112% 8 10
Brampton 3,150 $4,145,115,821 $1,315,910 $1,257,000 6,408 112% 7 10
Caledon 367 $651,131,386 $1,774,200 $1,540,000 723 107% 11 16
Mississauga 3,141 $3,728,750,614 $1,187,122 $1,025,000 5,359 112% 8 11
City of Toronto 12,465 $14,913,801,967 $1,196,454 $940,000 20,712 111% 12 15
Toronto West 3,137 $3,542,291,715 $1,129,197 $999,999 5,129 112% 12 14
Toronto Central 6,294 $7,769,146,378 $1,234,373 $851,000 10,739 107% 14 18
Toronto East 3,034 $3,602,363,874 $1,187,332 $1,175,000 4,844 119% 9 10
York Region 5,720 $8,680,023,223 $1,517,487 $1,420,000 11,591 111% 10 13
Aurora 393 $623,416,759 $1,586,302 $1,485,000 824 112% 9 12
East Gwillimbury 243 $382,005,399 $1,572,039 $1,500,000 512 113% 10 13
Georgina 339 $368,573,699 $1,087,238 $1,050,000 677 115% 11 14
King 122 $312,224,331 $2,559,216 $2,344,000 269 100% 19 27
Markham 1,357 $2,011,696,072 $1,482,458 $1,430,000 2,758 113% 10 13
Newmarket 482 $657,179,617 $1,363,443 $1,302,400 906 114% 8 10
Richmond Hill 1,009 $1,576,534,822 $1,562,473 $1,500,000 2,124 112% 10 14
Vaughan 1,512 $2,318,183,904 $1,533,190 $1,450,000 2,949 109% 11 14
Whitchurch-Stouffville 263 $430,208,620 $1,635,774 $1,428,000 572 109% 11 13
Durham Region 4,200 $4,848,797,202 $1,154,476 $1,100,000 7,301 123% 7 9
Ajax 608 $746,275,268 $1,227,426 $1,180,000 1,162 124% 7 9
Brock 82 $87,053,710 $1,061,631 $925,000 153 112% 9 12
Clarington 774 $844,995,001 $1,091,725 $1,025,000 1,305 124% 7 8
Oshawa 1,213 $1,234,907,969 $1,018,061 $968,000 2,092 125% 7 9
Pickering 521 $639,573,843 $1,227,589 $1,150,000 870 121% 8 10
Scugog 94 $121,426,831 $1,291,775 $1,117,500 138 113% 11 15
Uxbridge 112 $164,678,109 $1,470,340 $1,285,000 166 112% 11 12
Whitby 796 $1,009,886,471 $1,268,702 $1,220,000 1,415 124% 6 8
Dufferin County 232 $232,899,283 $1,003,876 $961,000 379 112% 7 9
Orangeville 232 $232,899,283 $1,003,876 $961,000 379 112% 7 9
Simcoe County 998 $1,170,238,950 $1,172,584 $1,075,000 2,115 109% 10 13
Adjala-Tosorontio 49 $71,895,900 $1,467,263 $1,215,000 78 106% 13 15
Bradford West Gwillimbury 202 $277,597,736 $1,374,246 $1,294,000 528 111% 10 14
Essa 148 $146,291,075 $988,453 $925,000 302 110% 8 10
Innisfil 302 $337,784,321 $1,118,491 $1,040,000 651 108% 10 12
New Tecumseth 297 $336,669,918 $1,133,569 $1,022,000 556 108% 11 12
Sub_Municipality Number of Sales Dollar Volume Average Price Median Price New Listings Avg. SP/LP Avg. LDOM Avg. PDOM
Toronto Regional Real Estate Board
SUMMARY OF EXISTING HOME TRANSACTIONS
ALL TRREB AREAS
ALL HOME TYPES, YEAR-TO-DATE 2022
1 1 1 2 4 5
5
Market Watch, April 2022
Copyright® 2021 Toronto Regional Real Estate Board
5
TRREB Total 33,610 $43,317,702,308 $1,288,834 $1,150,000 60,608 112% 10 13
City of Toronto Total 12,465 $14,913,801,967 $1,196,454 $940,000 20,712 111% 12 15
Toronto West 3,137 $3,542,291,715 $1,129,197 $999,999 5,129 112% 12 14
Toronto W01 215 $302,074,724 $1,404,999 $1,030,000 331 114% 10 13
Toronto W02 337 $455,377,298 $1,351,268 $1,300,000 497 117% 10 13
Toronto W03 208 $237,802,025 $1,143,279 $1,177,500 359 118% 9 12
Toronto W04 326 $332,445,813 $1,019,772 $930,000 498 111% 13 16
Toronto W05 422 $397,530,100 $942,014 $934,000 734 112% 11 13
Toronto W06 535 $551,554,170 $1,030,942 $880,000 956 109% 15 18
Toronto W07 101 $171,121,466 $1,694,272 $1,600,000 152 113% 10 11
Toronto W08 556 $668,036,284 $1,201,504 $830,000 880 110% 11 13
Toronto W09 170 $178,568,063 $1,050,400 $977,000 263 111% 13 16
Toronto W10 267 $247,781,772 $928,022 $810,000 459 113% 9 11
Toronto Central 6,294 $7,769,146,378 $1,234,373 $851,000 10,739 107% 14 18
Toronto C01 1,978 $1,856,361,714 $938,504 $787,750 3,230 108% 14 18
Toronto C02 341 $623,237,108 $1,827,675 $1,400,888 640 104% 16 24
Toronto C03 210 $406,200,274 $1,934,287 $1,510,000 380 108% 12 17
Toronto C04 261 $638,436,171 $2,446,116 $2,300,000 428 106% 12 17
Toronto C06 150 $165,690,435 $1,104,603 $806,250 261 110% 14 17
Toronto C07 368 $474,447,149 $1,289,259 $931,000 673 108% 12 15
Toronto C08 966 $839,167,286 $868,703 $756,000 1,627 107% 15 20
Toronto C09 104 $208,936,433 $2,009,004 $1,412,500 175 104% 24 29
Toronto C10 296 $344,485,918 $1,163,804 $875,700 520 109% 11 15
Toronto C11 159 $206,350,101 $1,297,799 $765,000 246 111% 11 12
Toronto C12 114 $438,059,864 $3,842,630 $3,229,000 240 100% 21 37
Toronto C13 248 $334,920,470 $1,350,486 $975,000 392 108% 14 19
Toronto C14 495 $602,767,153 $1,217,711 $840,000 931 108% 12 17
Toronto C15 604 $630,086,302 $1,043,189 $832,500 996 111% 14 16
Toronto East 3,034 $3,602,363,874 $1,187,332 $1,175,000 4,844 119% 9 10
Toronto E01 295 $402,660,614 $1,364,951 $1,354,000 428 122% 7 9
Toronto E02 253 $402,380,120 $1,590,435 $1,500,000 355 116% 8 10
Toronto E03 346 $470,862,059 $1,360,873 $1,300,000 530 120% 10 13
Toronto E04 347 $365,829,915 $1,054,265 $1,100,000 564 119% 7 9
Toronto E05 307 $327,261,769 $1,065,999 $940,000 503 118% 10 11
Toronto E06 143 $186,529,464 $1,304,402 $1,200,000 235 113% 9 12
Toronto E07 253 $267,122,878 $1,055,822 $1,030,000 477 120% 8 10
Toronto E08 253 $281,496,180 $1,112,633 $1,110,000 382 116% 10 11
Toronto E09 313 $311,560,763 $995,402 $900,000 576 121% 7 9
Toronto E10 236 $299,068,703 $1,267,240 $1,290,000 361 121% 9 10
Toronto E11 288 $287,591,409 $998,581 $944,000 433 119% 9 10
Municipality Number of Sales Dollar Volume Average Price Median Price New Listings Avg. SP/LP Avg. LDOM Avg. PDOM
Toronto Regional Real Estate Board
SUMMARY OF EXISTING HOME TRANSACTIONS
CITY OF TORONTO MUNICIPAL BREAKDOWN
ALL HOME TYPES, YEAR-TO-DATE 2022
1 1 1 2 4 5
6
Market Watch, April 2022
Copyright® 2021 Toronto Regional Real Estate Board
5
TRREB Total 3,600 $5,862,033,851 $1,628,343 $1,445,000 8,629 6,151 106% 10
Halton Region 428 $761,819,188 $1,779,951 $1,630,000 1,032 704 103% 10
Burlington 131 $218,759,944 $1,669,923 $1,550,000 302 195 105% 8
Halton Hills 72 $105,442,400 $1,464,478 $1,334,000 159 99 106% 9
Milton 68 $100,538,864 $1,478,513 $1,423,000 211 142 104% 11
Oakville 157 $337,077,980 $2,146,994 $1,930,000 360 268 101% 11
Peel Region 680 $1,105,699,985 $1,626,029 $1,475,000 1,792 1,217 104% 11
Brampton 368 $542,787,923 $1,474,967 $1,400,000 1,080 691 104% 10
Caledon 83 $157,729,100 $1,900,351 $1,700,000 168 137 103% 15
Mississauga 229 $405,182,962 $1,769,358 $1,560,000 544 389 104% 10
City of Toronto 868 $1,690,842,132 $1,947,975 $1,560,935 1,725 1,303 107% 11
Toronto West 287 $489,043,518 $1,703,984 $1,500,000 556 384 108% 11
Toronto Central 253 $716,268,466 $2,831,101 $2,366,000 514 542 103% 14
Toronto East 328 $485,530,148 $1,480,275 $1,347,250 655 377 114% 8
York Region 673 $1,185,714,266 $1,761,834 $1,675,000 1,852 1,598 104% 12
Aurora 41 $77,536,776 $1,891,141 $1,720,000 131 133 105% 11
East Gwillimbury 44 $68,911,500 $1,566,170 $1,420,000 115 99 105% 15
Georgina 65 $67,059,000 $1,031,677 $950,000 189 137 106% 12
King 18 $43,630,850 $2,423,936 $2,281,500 75 93 100% 19
Markham 136 $263,655,612 $1,938,644 $1,788,000 342 291 104% 12
Newmarket 79 $110,014,000 $1,392,582 $1,340,000 163 108 106% 10
Richmond Hill 93 $187,303,291 $2,014,014 $1,865,800 314 314 105% 13
Vaughan 155 $300,058,518 $1,935,861 $1,825,000 414 320 104% 11
Whitchurch-Stouffville 42 $67,544,719 $1,608,208 $1,500,000 109 103 103% 11
Durham Region 735 $876,167,954 $1,192,065 $1,150,000 1,592 862 114% 8
Ajax 109 $138,724,530 $1,272,702 $1,249,900 261 128 112% 9
Brock 12 $10,268,910 $855,743 $862,500 48 44 106% 13
Clarington 162 $180,600,689 $1,114,819 $1,010,000 316 158 115% 7
Oshawa 200 $208,879,971 $1,044,400 $975,000 426 236 116% 8
Pickering 53 $77,509,752 $1,462,448 $1,325,000 131 86 114% 7
Scugog 32 $38,786,300 $1,212,072 $1,100,000 50 30 111% 7
Uxbridge 28 $41,509,510 $1,482,483 $1,330,000 47 26 109% 7
Whitby 139 $179,888,292 $1,294,160 $1,240,000 313 154 113% 7
Dufferin County 36 $39,862,500 $1,107,292 $990,000 67 39 105% 8
Orangeville 36 $39,862,500 $1,107,292 $990,000 67 39 105% 8
Simcoe County 180 $201,927,826 $1,121,821 $1,047,500 569 428 103% 12
Adjala-Tosorontio 14 $16,056,500 $1,146,893 $1,125,000 27 22 103% 9
Bradford West Gwillimbury 28 $37,354,900 $1,334,104 $1,375,000 134 111 102% 10
Essa 27 $26,314,500 $974,611 $955,000 77 60 105% 11
Innisfil 59 $61,947,013 $1,049,949 $930,000 194 136 102% 10
New Tecumseth 52 $60,254,913 $1,158,748 $1,062,500 137 99 104% 17
Municipality Number of Sales Dollar Volume Average Price Median Price New Listings Active Listings Avg. SP/LP Avg. LDOM
DETACHED, APRIL 2022
Toronto Regional Real Estate Board
SUMMARY OF EXISTING HOME TRANSACTIONS
ALL TRREB AREAS
1 1 2 4 5
1 1 3
7
Market Watch, April 2022
Copyright® 2021 Toronto Regional Real Estate Board
TRREB Total 3,600 $5,862,033,851 $1,628,343 $1,445,000 8,629 6,151 106% 10
City of Toronto 868 $1,690,842,132 $1,947,975 $1,560,935 1,725 1,303 107% 11
Toronto West 287 $489,043,518 $1,703,984 $1,500,000 556 384 108% 11
Toronto W01 10 $24,148,818 $2,414,882 $2,285,000 15 10 113% 7
Toronto W02 30 $66,718,134 $2,223,938 $1,848,521 58 33 117% 6
Toronto W03 20 $24,607,400 $1,230,370 $1,175,000 56 53 112% 8
Toronto W04 50 $67,102,542 $1,342,051 $1,265,000 71 53 106% 11
Toronto W05 26 $37,651,776 $1,448,145 $1,343,944 47 30 109% 9
Toronto W06 30 $49,045,887 $1,634,863 $1,495,500 70 46 107% 7
Toronto W07 25 $44,224,005 $1,768,960 $1,620,000 41 22 108% 9
Toronto W08 56 $118,503,100 $2,116,127 $1,962,500 107 75 105% 20
Toronto W09 21 $33,623,368 $1,601,113 $1,482,000 38 19 105% 10
Toronto W10 19 $23,418,488 $1,232,552 $1,215,000 53 43 111% 9
Toronto Central 253 $716,268,466 $2,831,101 $2,366,000 514 542 103% 14
Toronto C01 8 $20,597,800 $2,574,725 $2,401,400 15 11 103% 7
Toronto C02 11 $40,046,000 $3,640,545 $2,363,000 29 22 100% 16
Toronto C03 26 $69,160,011 $2,660,000 $2,187,500 52 42 113% 7
Toronto C04 52 $158,813,050 $3,054,097 $2,500,500 81 57 102% 12
Toronto C06 13 $24,409,111 $1,877,624 $1,600,000 27 24 103% 22
Toronto C07 26 $51,063,099 $1,963,965 $1,772,000 66 75 102% 17
Toronto C08 3 $7,690,000 $2,563,333 $2,750,000 4 5 103% 29
Toronto C09 11 $38,509,388 $3,500,853 $3,690,000 20 13 103% 19
Toronto C10 8 $20,725,503 $2,590,688 $2,310,000 17 16 100% 9
Toronto C11 15 $48,881,016 $3,258,734 $2,951,016 20 4 113% 5
Toronto C12 17 $84,131,000 $4,948,882 $4,150,000 39 78 100% 19
Toronto C13 13 $36,108,800 $2,777,600 $1,900,000 34 44 101% 26
Toronto C14 26 $64,552,800 $2,482,800 $2,268,000 64 96 101% 16
Toronto C15 24 $51,580,888 $2,149,204 $1,835,000 46 55 100% 14
Toronto East 328 $485,530,148 $1,480,275 $1,347,250 655 377 114% 8
Toronto E01 17 $30,901,961 $1,817,762 $1,741,800 30 14 114% 9
Toronto E02 28 $58,050,342 $2,073,227 $1,998,000 41 12 114% 6
Toronto E03 55 $84,183,230 $1,530,604 $1,350,000 104 56 119% 7
Toronto E04 42 $52,748,800 $1,255,924 $1,250,000 95 55 117% 7
Toronto E05 20 $28,783,400 $1,439,170 $1,390,000 53 38 107% 12
Toronto E06 29 $38,324,510 $1,321,535 $1,260,000 51 24 110% 8
Toronto E07 26 $36,692,888 $1,411,265 $1,419,000 51 40 109% 14
Toronto E08 24 $34,919,988 $1,455,000 $1,366,000 45 33 111% 7
Toronto E09 41 $51,180,899 $1,248,315 $1,200,000 90 49 116% 9
Toronto E10 32 $50,361,130 $1,573,785 $1,455,000 69 36 112% 7
Toronto E11 14 $19,383,000 $1,384,500 $1,450,000 26 20 114% 11
Municipality Number of Sales Dollar Volume Average Price Median Price New Listings Active Listings Avg. SP/LP Avg. LDOM
DETACHED, APRIL 2022
Toronto Regional Real Estate Board
SUMMARY OF EXISTING HOME TRANSACTIONS
CITY OF TORONTO MUNICIPAL BREAKDOWN
1 1 2 4 5
1 1 3
8
Market Watch, April 2022
Copyright® 2021 Toronto Regional Real Estate Board
TRREB Total 802 $1,009,912,607 $1,259,243 $1,180,000 1,714 1,006 111% 9
Halton Region 48 $52,783,108 $1,099,648 $1,100,000 107 65 107% 11
Burlington 19 $19,525,309 $1,027,648 $975,309 34 17 108% 9
Halton Hills 3 $2,515,000 $838,333 $900,000 3 3 111% 7
Milton 17 $19,936,799 $1,172,753 $1,185,000 46 30 108% 10
Oakville 9 $10,806,000 $1,200,667 $1,141,000 24 15 103% 14
Peel Region 270 $309,136,317 $1,144,949 $1,145,000 636 368 108% 9
Brampton 155 $173,976,314 $1,122,428 $1,125,000 376 220 109% 10
Caledon 4 $4,781,000 $1,195,250 $1,178,000 26 17 104% 7
Mississauga 111 $130,379,003 $1,174,586 $1,160,000 234 131 108% 9
City of Toronto 311 $464,832,970 $1,494,640 $1,350,000 553 326 112% 9
Toronto West 110 $142,259,459 $1,293,268 $1,270,000 195 108 112% 9
Toronto Central 91 $170,059,045 $1,868,781 $1,610,000 175 132 109% 10
Toronto East 110 $152,514,466 $1,386,495 $1,310,000 183 86 117% 7
York Region 85 $107,044,464 $1,259,347 $1,250,000 248 162 110% 10
Aurora 5 $5,335,000 $1,067,000 $1,070,000 15 9 101% 8
East Gwillimbury 2 $2,500,000 $1,250,000 $1,250,000 8 6 104% 12
Georgina 0 $0 $0 - 7 4 - -
King 0 $0 $0 - 0 0 - -
Markham 19 $25,974,600 $1,367,084 $1,300,000 62 40 113% 9
Newmarket 12 $12,790,000 $1,065,833 $1,070,000 36 22 114% 7
Richmond Hill 13 $18,289,665 $1,406,897 $1,388,000 45 32 111% 10
Vaughan 27 $34,090,199 $1,262,600 $1,265,000 61 39 107% 13
Whitchurch-Stouffville 7 $8,065,000 $1,152,143 $1,160,000 14 10 111% 8
Durham Region 65 $56,594,761 $870,689 $825,000 137 70 118% 7
Ajax 7 $7,382,038 $1,054,577 $1,000,000 22 15 125% 5
Brock 1 $875,000 $875,000 $875,000 0 0 105% 7
Clarington 8 $6,439,000 $804,875 $820,000 11 5 122% 4
Oshawa 37 $28,704,723 $775,803 $770,000 72 31 119% 7
Pickering 7 $7,479,000 $1,068,429 $1,075,000 18 9 113% 6
Scugog 0 $0 $0 - 0 0 - -
Uxbridge 0 $0 $0 - 1 1 - -
Whitby 5 $5,715,000 $1,143,000 $1,190,000 13 9 108% 10
Dufferin County 10 $7,535,000 $753,500 $796,500 8 3 102% 11
Orangeville 10 $7,535,000 $753,500 $796,500 8 3 102% 11
Simcoe County 13 $11,985,987 $921,999 $850,000 25 12 106% 13
Adjala-Tosorontio 0 $0 $0 - 0 0 - -
Bradford West Gwillimbury 7 $7,171,999 $1,024,571 $1,085,000 11 3 106% 9
Essa 3 $2,254,000 $751,333 $750,000 2 1 106% 23
Innisfil 0 $0 $0 - 0 0 - -
New Tecumseth 3 $2,559,988 $853,329 $850,000 12 8 103% 9
Municipality Number of Sales Dollar Volume Average Price Median Price New Listings Active Listings Avg. SP/LP Avg. LDOM
SEMI-DETACHED, APRIL 2022
Toronto Regional Real Estate Board
SUMMARY OF EXISTING HOME TRANSACTIONS
ALL TRREB AREAS
1 1 2 4 5
1 1 3
9
Market Watch, April 2022
Copyright® 2021 Toronto Regional Real Estate Board
TRREB Total 802 $1,009,912,607 $1,259,243 $1,180,000 1,714 1,006 111% 9
City of Toronto 311 $464,832,970 $1,494,640 $1,350,000 553 326 112% 9
Toronto West 110 $142,259,459 $1,293,268 $1,270,000 195 108 112% 9
Toronto W01 7 $11,330,000 $1,618,571 $1,700,000 13 10 115% 12
Toronto W02 28 $42,640,500 $1,522,875 $1,542,500 43 17 114% 7
Toronto W03 25 $30,205,694 $1,208,228 $1,300,000 32 20 115% 10
Toronto W04 7 $7,668,111 $1,095,444 $1,135,000 9 6 112% 16
Toronto W05 34 $37,331,999 $1,098,000 $1,090,000 72 40 107% 9
Toronto W06 6 $8,403,155 $1,400,526 $1,331,578 18 11 109% 8
Toronto W07 1 $1,305,000 $1,305,000 $1,305,000 0 0 145% 8
Toronto W08 2 $3,375,000 $1,687,500 $1,687,500 5 2 102% 5
Toronto W09 0 $0 $0 - 2 1 - -
Toronto W10 0 $0 $0 - 1 1 - -
Toronto Central 91 $170,059,045 $1,868,781 $1,610,000 175 132 109% 10
Toronto C01 23 $43,155,339 $1,876,319 $1,788,888 45 41 109% 11
Toronto C02 10 $30,511,000 $3,051,100 $2,850,000 24 15 103% 11
Toronto C03 5 $8,618,818 $1,723,764 $1,650,000 20 14 111% 6
Toronto C04 6 $10,875,000 $1,812,500 $1,860,000 9 6 114% 9
Toronto C06 0 $0 $0 - 1 1 - -
Toronto C07 7 $8,907,000 $1,272,429 $1,200,000 10 8 106% 7
Toronto C08 1 $1,750,000 $1,750,000 $1,750,000 6 12 109% 1
Toronto C09 3 $8,980,000 $2,993,333 $2,895,000 3 3 103% 7
Toronto C10 9 $18,765,000 $2,085,000 $1,950,000 14 7 112% 6
Toronto C11 8 $14,201,000 $1,775,125 $1,801,500 8 3 114% 14
Toronto C12 1 $1,300,000 $1,300,000 $1,300,000 2 1 108% 6
Toronto C13 7 $8,996,888 $1,285,270 $1,173,888 12 8 107% 9
Toronto C14 0 $0 $0 - 0 0 - -
Toronto C15 11 $13,999,000 $1,272,636 $1,251,000 21 13 109% 11
Toronto East 110 $152,514,466 $1,386,495 $1,310,000 183 86 117% 7
Toronto E01 32 $47,637,228 $1,488,663 $1,442,500 54 21 115% 6
Toronto E02 24 $36,276,042 $1,511,502 $1,501,001 35 14 122% 7
Toronto E03 27 $40,058,183 $1,483,636 $1,508,000 31 9 121% 6
Toronto E04 4 $4,203,000 $1,050,750 $1,027,500 16 10 107% 10
Toronto E05 4 $4,623,000 $1,155,750 $1,150,000 10 8 111% 14
Toronto E06 0 $0 $0 - 3 2 - -
Toronto E07 3 $3,228,000 $1,076,000 $1,098,000 7 7 112% 13
Toronto E08 5 $5,145,513 $1,029,103 $1,035,000 3 0 108% 13
Toronto E09 1 $1,020,000 $1,020,000 $1,020,000 6 4 93% 19
Toronto E10 7 $6,963,500 $994,786 $980,000 9 3 122% 5
Toronto E11 3 $3,360,000 $1,120,000 $1,100,000 9 8 114% 3
Municipality Number of Sales Dollar Volume Average Price Median Price New Listings Active Listings Avg. SP/LP Avg. LDOM
SEMI-DETACHED, APRIL 2022
Toronto Regional Real Estate Board
SUMMARY OF EXISTING HOME TRANSACTIONS
CITY OF TORONTO MUNICIPAL BREAKDOWN
1 1 2 4 5
1 1 3
10
Market Watch, April 2022
Copyright® 2021 Toronto Regional Real Estate Board
TRREB Total 716 $801,667,897 $1,119,648 $1,047,500 1,755 1,127 109% 10
Halton Region 139 $153,154,332 $1,101,830 $1,050,000 330 189 106% 9
Burlington 26 $27,904,499 $1,073,250 $1,032,500 46 19 108% 7
Halton Hills 4 $5,150,000 $1,287,500 $1,295,000 24 16 106% 14
Milton 70 $71,536,740 $1,021,953 $999,999 145 77 105% 9
Oakville 39 $48,563,093 $1,245,208 $1,250,000 115 77 106% 9
Peel Region 125 $130,065,995 $1,040,528 $999,999 359 241 107% 10
Brampton 98 $98,932,495 $1,009,515 $992,000 258 180 107% 11
Caledon 10 $11,152,500 $1,115,250 $1,100,000 39 23 106% 10
Mississauga 17 $19,981,000 $1,175,353 $1,155,000 62 38 109% 9
City of Toronto 115 $154,725,929 $1,345,443 $1,300,000 190 119 110% 12
Toronto West 30 $37,447,200 $1,248,240 $1,302,600 57 33 108% 15
Toronto Central 37 $61,660,042 $1,666,488 $1,625,000 66 52 107% 13
Toronto East 48 $55,618,687 $1,158,723 $1,042,500 67 34 115% 9
York Region 163 $206,241,417 $1,265,285 $1,270,000 456 329 108% 11
Aurora 13 $14,982,000 $1,152,462 $1,100,000 48 34 115% 9
East Gwillimbury 4 $3,758,000 $939,500 $919,500 16 9 101% 12
Georgina 2 $1,725,000 $862,500 $862,500 8 6 105% 6
King 4 $5,631,000 $1,407,750 $1,550,000 4 2 103% 8
Markham 46 $58,994,939 $1,282,499 $1,277,500 94 75 108% 13
Newmarket 9 $9,912,800 $1,101,422 $1,150,000 25 23 114% 9
Richmond Hill 30 $40,518,188 $1,350,606 $1,360,000 86 68 109% 10
Vaughan 46 $61,030,600 $1,326,752 $1,312,500 146 91 106% 10
Whitchurch-Stouffville 9 $9,688,890 $1,076,543 $1,075,000 29 21 103% 13
Durham Region 132 $122,627,824 $928,999 $918,000 307 182 117% 9
Ajax 24 $23,784,499 $991,021 $965,500 69 40 118% 8
Brock 0 $0 $0 - 0 0 - -
Clarington 31 $25,972,436 $837,821 $839,938 43 18 120% 9
Oshawa 14 $12,013,999 $858,143 $860,000 48 43 119% 12
Pickering 18 $18,291,154 $1,016,175 $994,500 48 24 112% 8
Scugog 0 $0 $0 - 0 0 - -
Uxbridge 2 $1,930,000 $965,000 $965,000 6 2 121% 8
Whitby 43 $40,635,736 $945,017 $931,000 93 55 115% 9
Dufferin County 11 $9,130,000 $830,000 $825,000 34 17 105% 9
Orangeville 11 $9,130,000 $830,000 $825,000 34 17 105% 9
Simcoe County 31 $25,722,400 $829,755 $840,000 79 50 106% 9
Adjala-Tosorontio 0 $0 $0 - 0 0 - -
Bradford West Gwillimbury 6 $5,836,000 $972,667 $973,000 19 10 100% 12
Essa 5 $3,878,400 $775,680 $777,000 13 10 109% 8
Innisfil 11 $8,440,000 $767,273 $740,000 27 17 107% 8
New Tecumseth 9 $7,568,000 $840,889 $875,000 20 13 106% 8
Municipality Number of Sales Dollar Volume Average Price Median Price New Listings Active Listings Avg. SP/LP Avg. LDOM
ATT/ROW/TWNHOUSE, APRIL 2022
Toronto Regional Real Estate Board
SUMMARY OF EXISTING HOME TRANSACTIONS
ALL TRREB AREAS
1 1 2 4 5
1 1 3
11
Market Watch, April 2022
Copyright® 2021 Toronto Regional Real Estate Board
TRREB Total 716 $801,667,897 $1,119,648 $1,047,500 1,755 1,127 109% 10
City of Toronto 115 $154,725,929 $1,345,443 $1,300,000 190 119 110% 12
Toronto West 30 $37,447,200 $1,248,240 $1,302,600 57 33 108% 15
Toronto W01 2 $2,860,000 $1,430,000 $1,430,000 2 1 98% 2
Toronto W02 7 $8,793,200 $1,256,171 $1,305,200 8 4 108% 38
Toronto W03 4 $4,175,000 $1,043,750 $1,100,000 1 0 120% 8
Toronto W04 1 $1,350,000 $1,350,000 $1,350,000 6 3 100% 6
Toronto W05 4 $4,114,500 $1,028,625 $1,058,500 17 12 108% 8
Toronto W06 5 $6,906,500 $1,381,300 $1,370,500 8 5 107% 10
Toronto W07 2 $2,850,000 $1,425,000 $1,425,000 3 2 102% 9
Toronto W08 1 $1,548,000 $1,548,000 $1,548,000 5 2 129% 6
Toronto W09 3 $3,800,000 $1,266,667 $1,450,000 2 1 114% 9
Toronto W10 1 $1,050,000 $1,050,000 $1,050,000 5 3 95% 4
Toronto Central 37 $61,660,042 $1,666,488 $1,625,000 66 52 107% 13
Toronto C01 14 $21,135,154 $1,509,654 $1,581,500 18 15 111% 8
Toronto C02 7 $16,399,000 $2,342,714 $2,420,000 9 7 108% 6
Toronto C03 1 $1,038,000 $1,038,000 $1,038,000 0 2 88% 85
Toronto C04 0 $0 $0 - 1 2 - -
Toronto C06 0 $0 $0 - 0 1 - -
Toronto C07 2 $3,068,800 $1,534,400 $1,534,400 10 6 119% 8
Toronto C08 8 $11,846,088 $1,480,761 $1,459,044 13 9 106% 12
Toronto C09 0 $0 $0 - 0 0 - -
Toronto C10 1 $1,460,000 $1,460,000 $1,460,000 1 0 98% 40
Toronto C11 2 $3,388,000 $1,694,000 $1,694,000 0 0 96% 30
Toronto C12 0 $0 $0 - 1 1 - -
Toronto C13 0 $0 $0 - 4 3 - -
Toronto C14 2 $3,325,000 $1,662,500 $1,662,500 9 6 95% 19
Toronto C15 0 $0 $0 - 0 0 - -
Toronto East 48 $55,618,687 $1,158,723 $1,042,500 67 34 115% 9
Toronto E01 11 $15,886,000 $1,444,182 $1,425,000 10 4 118% 10
Toronto E02 5 $6,625,000 $1,325,000 $1,305,000 6 2 110% 12
Toronto E03 2 $3,166,000 $1,583,000 $1,583,000 2 1 144% 3
Toronto E04 4 $5,125,000 $1,281,250 $1,277,500 12 9 120% 4
Toronto E05 0 $0 $0 - 0 0 - -
Toronto E06 1 $895,000 $895,000 $895,000 1 0 112% 9
Toronto E07 5 $4,806,800 $961,360 $970,000 5 2 115% 12
Toronto E08 2 $1,881,000 $940,500 $940,500 7 6 105% 6
Toronto E09 0 $0 $0 - 1 0 - -
Toronto E10 4 $3,854,999 $963,750 $970,000 8 4 100% 12
Toronto E11 14 $13,378,888 $955,635 $931,000 15 6 114% 9
Municipality Number of Sales Dollar Volume Average Price Median Price New Listings Active Listings Avg. SP/LP Avg. LDOM
ATT/ROW/TWNHOUSE, APRIL 2022
Toronto Regional Real Estate Board
SUMMARY OF EXISTING HOME TRANSACTIONS
CITY OF TORONTO MUNICIPAL BREAKDOWN
1 1 2 4 5
1 1 3
12
Market Watch, April 2022
Copyright® 2021 Toronto Regional Real Estate Board
TRREB Total 652 $592,802,778 $909,207 $870,000 1,446 944 109% 10
Halton Region 85 $76,792,871 $903,446 $850,016 172 98 107% 10
Burlington 46 $41,350,508 $898,924 $880,000 81 44 108% 9
Halton Hills 10 $7,900,016 $790,002 $822,500 15 8 107% 13
Milton 6 $4,942,700 $823,783 $842,500 19 11 116% 6
Oakville 23 $22,599,647 $982,593 $850,000 57 35 102% 12
Peel Region 200 $179,088,531 $895,443 $889,500 468 292 108% 11
Brampton 58 $48,337,836 $833,411 $808,500 167 107 107% 11
Caledon 1 $844,500 $844,500 $844,500 3 1 99% 8
Mississauga 141 $129,906,195 $921,321 $924,800 298 184 108% 10
City of Toronto 220 $209,414,355 $951,883 $885,000 445 329 110% 11
Toronto West 90 $77,366,882 $859,632 $840,000 146 96 110% 12
Toronto Central 65 $77,433,069 $1,191,278 $950,000 173 143 109% 9
Toronto East 65 $54,614,404 $840,222 $840,000 126 90 112% 10
York Region 64 $63,608,300 $993,880 $920,000 179 123 108% 11
Aurora 9 $9,654,800 $1,072,756 $947,000 18 16 102% 16
East Gwillimbury 0 $0 $0 - 0 0 - -
Georgina 1 $530,000 $530,000 $530,000 0 0 99% 30
King 0 $0 $0 - 0 0 - -
Markham 23 $23,515,111 $1,022,396 $920,000 77 54 109% 11
Newmarket 9 $8,432,400 $936,933 $920,000 25 11 109% 9
Richmond Hill 5 $6,688,000 $1,337,600 $1,300,000 14 9 115% 12
Vaughan 12 $10,856,989 $904,749 $885,000 38 29 105% 10
Whitchurch-Stouffville 5 $3,931,000 $786,200 $792,000 7 4 112% 4
Durham Region 79 $61,138,821 $773,909 $787,500 173 94 116% 9
Ajax 3 $2,682,500 $894,167 $900,000 21 12 118% 8
Brock 0 $0 $0 - 3 1 - -
Clarington 4 $3,508,000 $877,000 $741,500 8 3 107% 13
Oshawa 27 $18,169,720 $672,953 $660,000 63 40 119% 10
Pickering 26 $21,480,601 $826,177 $805,000 46 26 113% 9
Scugog 0 $0 $0 - 0 0 - -
Uxbridge 2 $1,404,000 $702,000 $702,000 4 2 111% 6
Whitby 17 $13,894,000 $817,294 $820,000 28 10 121% 7
Dufferin County 3 $2,080,000 $693,333 $700,000 6 5 106% 11
Orangeville 3 $2,080,000 $693,333 $700,000 6 5 106% 11
Simcoe County 1 $679,900 $679,900 $679,900 3 3 117% 5
Adjala-Tosorontio 0 $0 $0 - 0 0 - -
Bradford West Gwillimbury 0 $0 $0 - 0 0 - -
Essa 0 $0 $0 - 0 0 - -
Innisfil 0 $0 $0 - 0 1 - -
New Tecumseth 1 $679,900 $679,900 $679,900 3 2 117% 5
Municipality Number of Sales Dollar Volume Average Price Median Price New Listings Active Listings Avg. SP/LP Avg. LDOM
CONDO TOWNHOUSE, APRIL 2022
Toronto Regional Real Estate Board
SUMMARY OF EXISTING HOME TRANSACTIONS
ALL TRREB AREAS
1 1 2 4 5
1 1 3
13
Market Watch, April 2022
Copyright® 2021 Toronto Regional Real Estate Board
TRREB Total 652 $592,802,778 $909,207 $870,000 1,446 944 109% 10
City of Toronto 220 $209,414,355 $951,883 $885,000 445 329 110% 11
Toronto West 90 $77,366,882 $859,632 $840,000 146 96 110% 12
Toronto W01 5 $4,030,000 $806,000 $775,000 5 4 111% 4
Toronto W02 19 $19,571,998 $1,030,105 $999,999 23 9 116% 11
Toronto W03 0 $0 $0 - 3 3 - -
Toronto W04 11 $8,399,999 $763,636 $740,000 12 4 106% 24
Toronto W05 26 $19,482,250 $749,317 $737,500 49 28 111% 10
Toronto W06 10 $10,052,110 $1,005,211 $1,062,000 24 22 104% 7
Toronto W07 0 $0 $0 - 0 0 - -
Toronto W08 10 $8,638,500 $863,850 $867,500 16 15 101% 13
Toronto W09 1 $1,000,025 $1,000,025 $1,000,025 8 7 118% 10
Toronto W10 8 $6,192,000 $774,000 $785,000 6 4 115% 12
Toronto Central 65 $77,433,069 $1,191,278 $950,000 173 143 109% 9
Toronto C01 16 $19,016,600 $1,188,538 $945,000 33 28 108% 10
Toronto C02 5 $9,973,000 $1,994,600 $1,788,000 6 6 100% 11
Toronto C03 0 $0 $0 - 0 1 - -
Toronto C04 2 $2,410,018 $1,205,009 $1,205,009 2 1 115% 7
Toronto C06 0 $0 $0 - 0 0 - -
Toronto C07 4 $4,110,000 $1,027,500 $965,000 14 14 109% 9
Toronto C08 3 $2,227,500 $742,500 $750,000 16 15 112% 6
Toronto C09 1 $1,400,000 $1,400,000 $1,400,000 6 4 108% 6
Toronto C10 2 $2,673,000 $1,336,500 $1,336,500 4 3 119% 7
Toronto C11 0 $0 $0 - 4 5 - -
Toronto C12 5 $9,000,000 $1,800,000 $1,600,000 13 9 109% 7
Toronto C13 2 $1,721,450 $860,725 $860,725 10 7 108% 16
Toronto C14 7 $7,928,000 $1,132,571 $1,028,000 22 23 109% 7
Toronto C15 18 $16,973,501 $942,972 $925,000 43 27 112% 10
Toronto East 65 $54,614,404 $840,222 $840,000 126 90 112% 10
Toronto E01 9 $8,308,300 $923,144 $898,000 11 4 109% 9
Toronto E02 3 $3,031,999 $1,010,666 $1,007,000 5 2 117% 12
Toronto E03 0 $0 $0 - 1 1 - -
Toronto E04 8 $6,788,300 $848,538 $848,400 21 13 112% 9
Toronto E05 12 $10,755,000 $896,250 $900,000 21 17 107% 12
Toronto E06 0 $0 $0 - 3 2 - -
Toronto E07 2 $1,808,000 $904,000 $904,000 4 3 113% 10
Toronto E08 8 $6,205,800 $775,725 $742,500 14 13 117% 9
Toronto E09 3 $2,075,000 $691,667 $620,000 8 8 122% 14
Toronto E10 4 $2,690,000 $672,500 $722,500 13 10 110% 8
Toronto E11 16 $12,952,005 $809,500 $788,500 25 17 116% 11
Municipality Number of Sales Dollar Volume Average Price Median Price New Listings Active Listings Avg. SP/LP Avg. LDOM
CONDO TOWNHOUSE, APRIL 2022
Toronto Regional Real Estate Board
SUMMARY OF EXISTING HOME TRANSACTIONS
CITY OF TORONTO MUNICIPAL BREAKDOWN
1 1 2 4 5
1 1 3
14
Market Watch, April 2022
Copyright® 2021 Toronto Regional Real Estate Board
TRREB Total 2,173 $1,716,384,874 $789,869 $715,000 4,723 3,753 106% 12
Halton Region 119 $88,830,941 $746,478 $675,000 270 204 104% 12
Burlington 66 $47,058,232 $713,004 $665,000 117 77 105% 11
Halton Hills 0 $0 $0 - 2 3 - -
Milton 15 $10,934,286 $728,952 $721,000 47 31 102% 11
Oakville 38 $30,838,423 $811,537 $677,500 104 93 104% 14
Peel Region 254 $178,122,996 $701,272 $689,500 618 436 108% 10
Brampton 35 $23,047,500 $658,500 $655,000 109 82 104% 11
Caledon 1 $910,000 $910,000 $910,000 1 0 107% 7
Mississauga 218 $154,165,496 $707,181 $690,000 508 354 108% 10
City of Toronto 1,488 $1,221,403,026 $820,835 $728,500 3,203 2,609 106% 13
Toronto West 325 $233,560,298 $718,647 $685,000 649 522 108% 15
Toronto Central 953 $840,022,682 $881,451 $760,000 2,122 1,781 105% 13
Toronto East 210 $147,820,046 $703,905 $655,500 432 306 109% 11
York Region 235 $178,541,561 $759,751 $740,000 506 425 105% 12
Aurora 8 $7,436,000 $929,500 $836,000 11 4 116% 8
East Gwillimbury 0 $0 $0 - 0 0 - -
Georgina 1 $511,000 $511,000 $511,000 1 5 114% 8
King 3 $2,280,000 $760,000 $735,000 4 2 102% 11
Markham 62 $46,236,652 $745,752 $732,500 164 118 106% 12
Newmarket 6 $4,547,100 $757,850 $815,000 7 2 112% 4
Richmond Hill 56 $40,732,300 $727,363 $702,500 115 96 105% 12
Vaughan 94 $73,014,709 $776,752 $757,000 190 187 103% 12
Whitchurch-Stouffville 5 $3,783,800 $756,760 $700,000 14 11 102% 11
Durham Region 66 $43,542,450 $659,734 $651,500 107 61 117% 9
Ajax 7 $4,791,172 $684,453 $700,000 15 9 133% 8
Brock 0 $0 $0 - 0 0 - -
Clarington 14 $9,183,000 $655,929 $625,000 20 13 119% 6
Oshawa 16 $7,813,500 $488,344 $486,000 26 17 115% 12
Pickering 19 $13,489,999 $710,000 $680,000 32 14 110% 9
Scugog 0 $0 $0 - 0 0 - -
Uxbridge 1 $711,104 $711,104 $711,104 1 0 119% 5
Whitby 9 $7,553,675 $839,297 $807,019 13 8 118% 7
Dufferin County 4 $1,470,000 $367,500 $392,500 3 2 99% 7
Orangeville 4 $1,470,000 $367,500 $392,500 3 2 99% 7
Simcoe County 7 $4,473,900 $639,129 $629,000 16 16 98% 12
Adjala-Tosorontio 0 $0 $0 - 0 0 - -
Bradford West Gwillimbury 1 $490,000 $490,000 $490,000 3 1 98% 17
Essa 0 $0 $0 - 0 0 - -
Innisfil 2 $1,620,000 $810,000 $810,000 8 11 98% 13
New Tecumseth 4 $2,363,900 $590,975 $602,000 5 4 99% 11
Municipality Number of Sales Dollar Volume Average Price Median Price New Listings Active Listings Avg. SP/LP Avg. LDOM
CONDO APT, APRIL 2022
Toronto Regional Real Estate Board
SUMMARY OF EXISTING HOME TRANSACTIONS
ALL TRREB AREAS
1 1 2 4 5
1 1 3
15
Market Watch, April 2022
Copyright® 2021 Toronto Regional Real Estate Board
TRREB Total 2,173 $1,716,384,874 $789,869 $715,000 4,723 3,753 106% 12
City of Toronto 1,488 $1,221,403,026 $820,835 $728,500 3,203 2,609 106% 13
Toronto West 325 $233,560,298 $718,647 $685,000 649 522 108% 15
Toronto W01 25 $21,738,100 $869,524 $780,000 51 37 111% 8
Toronto W02 18 $15,743,480 $874,638 $816,495 30 21 111% 17
Toronto W03 9 $6,215,900 $690,656 $749,000 18 8 110% 7
Toronto W04 31 $19,960,018 $643,872 $630,000 50 40 107% 15
Toronto W05 36 $20,214,500 $561,514 $607,500 65 70 105% 14
Toronto W06 88 $69,157,327 $785,879 $733,500 176 162 108% 21
Toronto W07 3 $2,669,000 $889,667 $819,000 9 8 102% 11
Toronto W08 66 $48,522,238 $735,185 $690,000 142 93 108% 9
Toronto W09 21 $11,920,249 $567,631 $500,000 37 32 102% 18
Toronto W10 28 $17,419,486 $622,125 $626,250 71 51 105% 14
Toronto Central 953 $840,022,682 $881,451 $760,000 2,122 1,781 105% 13
Toronto C01 370 $316,265,167 $854,771 $760,000 782 658 105% 13
Toronto C02 59 $79,440,815 $1,346,454 $956,800 131 135 104% 14
Toronto C03 15 $15,862,506 $1,057,500 $870,100 38 39 102% 14
Toronto C04 15 $23,062,800 $1,537,520 $1,125,000 21 20 103% 15
Toronto C06 26 $18,009,500 $692,673 $695,000 47 28 109% 8
Toronto C07 38 $28,675,948 $754,630 $742,500 97 72 105% 11
Toronto C08 160 $137,098,674 $856,867 $747,750 423 381 105% 12
Toronto C09 7 $8,294,000 $1,184,857 $967,000 17 17 97% 45
Toronto C10 59 $53,159,296 $901,005 $785,000 131 100 105% 14
Toronto C11 18 $12,228,988 $679,388 $631,500 49 33 106% 12
Toronto C12 1 $1,960,000 $1,960,000 $1,960,000 6 9 98% 15
Toronto C13 28 $21,357,486 $762,767 $740,000 43 33 103% 19
Toronto C14 79 $61,827,014 $782,620 $750,000 164 116 105% 12
Toronto C15 78 $62,780,488 $804,878 $705,400 173 140 105% 14
Toronto East 210 $147,820,046 $703,905 $655,500 432 306 109% 11
Toronto E01 14 $12,929,750 $923,554 $914,500 23 15 112% 7
Toronto E02 18 $18,724,997 $1,040,278 $992,500 33 16 108% 7
Toronto E03 15 $9,538,500 $635,900 $565,000 23 12 101% 6
Toronto E04 24 $15,207,500 $633,646 $645,000 41 25 110% 9
Toronto E05 31 $20,631,044 $665,518 $675,000 51 43 109% 15
Toronto E06 6 $4,800,100 $800,017 $745,050 13 12 112% 5
Toronto E07 25 $16,582,800 $663,312 $660,000 79 65 110% 12
Toronto E08 21 $13,227,039 $629,859 $574,000 42 28 113% 8
Toronto E09 31 $20,057,990 $647,032 $625,000 87 65 106% 10
Toronto E10 4 $2,269,000 $567,250 $565,000 4 2 110% 55
Toronto E11 21 $13,851,326 $659,587 $640,000 36 23 113% 9
Municipality Number of Sales Dollar Volume Average Price Median Price New Listings Active Listings Avg. SP/LP Avg. LDOM
CONDO APT, APRIL 2022
Toronto Regional Real Estate Board
SUMMARY OF EXISTING HOME TRANSACTIONS
CITY OF TORONTO MUNICIPAL BREAKDOWN
1 1 2 4 5
1 1 3
16
Market Watch, April 2022
Copyright® 2021 Toronto Regional Real Estate Board
TRREB Total 38 $40,909,988 $1,076,579 $1,050,000 93 66 107% 9
Halton Region 2 $2,340,000 $1,170,000 $1,170,000 9 9 102% 5
Burlington 2 $2,340,000 $1,170,000 $1,170,000 3 2 102% 5
Halton Hills 0 $0 $0 - 0 0 - -
Milton 0 $0 $0 - 1 2 - -
Oakville 0 $0 $0 - 5 5 - -
Peel Region 3 $3,012,000 $1,004,000 $995,000 16 8 107% 5
Brampton 2 $1,945,000 $972,500 $972,500 6 4 111% 6
Caledon 0 $0 $0 - 0 0 - -
Mississauga 1 $1,067,000 $1,067,000 $1,067,000 10 4 99% 3
City of Toronto 5 $5,710,000 $1,142,000 $1,125,000 11 10 101% 14
Toronto West 0 $0 $0 - 1 2 - -
Toronto Central 0 $0 $0 - 3 2 - -
Toronto East 5 $5,710,000 $1,142,000 $1,125,000 7 6 101% 14
York Region 10 $13,630,000 $1,363,000 $1,353,500 27 25 109% 10
Aurora 0 $0 $0 - 0 0 - -
East Gwillimbury 0 $0 $0 - 0 0 - -
Georgina 0 $0 $0 - 0 0 - -
King 0 $0 $0 - 1 1 - -
Markham 7 $9,741,000 $1,391,571 $1,480,000 14 17 107% 12
Newmarket 0 $0 $0 - 0 0 - -
Richmond Hill 1 $1,300,000 $1,300,000 $1,300,000 8 6 130% 2
Vaughan 2 $2,589,000 $1,294,500 $1,294,500 4 1 105% 5
Whitchurch-Stouffville 0 $0 $0 - 0 0 - -
Durham Region 12 $10,964,988 $913,749 $922,000 20 8 112% 7
Ajax 2 $1,894,100 $947,050 $947,050 4 2 110% 10
Brock 0 $0 $0 - 0 0 - -
Clarington 5 $4,480,000 $896,000 $906,000 8 3 118% 4
Oshawa 2 $1,640,000 $820,000 $820,000 1 0 97% 17
Pickering 0 $0 $0 - 1 0 - -
Scugog 0 $0 $0 - 0 0 - -
Uxbridge 0 $0 $0 - 1 1 - -
Whitby 3 $2,950,888 $983,629 $1,001,000 5 2 114% 3
Dufferin County 0 $0 $0 - 0 0 - -
Orangeville 0 $0 $0 - 0 0 - -
Simcoe County 6 $5,253,000 $875,500 $851,500 10 6 103% 10
Adjala-Tosorontio 0 $0 $0 - 0 0 - -
Bradford West Gwillimbury 1 $843,000 $843,000 $843,000 4 3 98% 4
Essa 4 $3,360,000 $840,000 $840,000 4 2 100% 13
Innisfil 0 $0 $0 - 1 0 - -
New Tecumseth 1 $1,050,000 $1,050,000 $1,050,000 1 1 117% 5
Municipality Number of Sales Dollar Volume Average Price Median Price New Listings Active Listings Avg. SP/LP Avg. LDOM
LINK, APRIL 2022
Toronto Regional Real Estate Board
SUMMARY OF EXISTING HOME TRANSACTIONS
ALL TRREB AREAS
1 1 2 4 5
1 1 3
17
Market Watch, April 2022
Copyright®
2021 Toronto Regional Real Estate Board
TRREB Total 38 $40,909,988 $1,076,579 $1,050,000 93 66 107% 9
City of Toronto 5 $5,710,000 $1,142,000 $1,125,000 11 10 101% 14
Toronto West 0 $0 $0 - 1 2 - -
Toronto W01 0 $0 $0 - 0 0 - -
Toronto W02 0 $0 $0 - 0 0 - -
Toronto W03 0 $0 $0 - 0 0 - -
Toronto W04 0 $0 $0 - 0 0 - -
Toronto W05 0 $0 $0 - 1 1 - -
Toronto W06 0 $0 $0 - 0 0 - -
Toronto W07 0 $0 $0 - 0 0 - -
Toronto W08 0 $0 $0 - 0 0 - -
Toronto W09 0 $0 $0 - 0 0 - -
Toronto W10 0 $0 $0 - 0 1 - -
Toronto Central 0 $0 $0 - 3 2 - -
Toronto C01 0 $0 $0 - 0 0 - -
Toronto C02 0 $0 $0 - 0 0 - -
Toronto C03 0 $0 $0 - 0 0 - -
Toronto C04 0 $0 $0 - 0 0 - -
Toronto C06 0 $0 $0 - 0 0 - -
Toronto C07 0 $0 $0 - 1 1 - -
Toronto C08 0 $0 $0 - 0 0 - -
Toronto C09 0 $0 $0 - 0 0 - -
Toronto C10 0 $0 $0 - 0 0 - -
Toronto C11 0 $0 $0 - 0 0 - -
Toronto C12 0 $0 $0 - 0 0 - -
Toronto C13 0 $0 $0 - 0 0 - -
Toronto C14 0 $0 $0 - 0 0 - -
Toronto C15 0 $0 $0 - 2 1 - -
Toronto East 5 $5,710,000 $1,142,000 $1,125,000 7 6 101% 14
Toronto E01 0 $0 $0 - 0 0 - -
Toronto E02 0 $0 $0 - 0 0 - -
Toronto E03 0 $0 $0 - 0 0 - -
Toronto E04 0 $0 $0 - 0 0 - -
Toronto E05 2 $2,385,000 $1,192,500 $1,192,500 3 2 92% 15
Toronto E06 0 $0 $0 - 0 0 - -
Toronto E07 2 $2,200,000 $1,100,000 $1,100,000 2 2 111% 16
Toronto E08 0 $0 $0 - 0 0 - -
Toronto E09 0 $0 $0 - 0 0 - -
Toronto E10 0 $0 $0 - 1 1 - -
Toronto E11 1 $1,125,000 $1,125,000 $1,125,000 1 1 102% 8
Municipality Number of Sales Dollar Volume Average Price Median Price New Listings Active Listings Avg. SP/LP Avg. LDOM
LINK, APRIL 2022
Toronto Regional Real Estate Board
SUMMARY OF EXISTING HOME TRANSACTIONS
CITY OF TORONTO MUNICIPAL BREAKDOWN
1 1 2 4 5
1 1 3
18
Market Watch, April 2022
Copyright®
2021 Toronto Regional Real Estate Board
TRREB Total 11 $7,986,000 $726,000 $460,000 21 22 99% 63
Halton Region 0 $0 $0 - 0 2 - -
Burlington 0 $0 $0 - 0 2 - -
Halton Hills 0 $0 $0 - 0 0 - -
Milton 0 $0 $0 - 0 0 - -
Oakville 0 $0 $0 - 0 0 - -
Peel Region 2 $870,000 $435,000 $435,000 1 0 99% 40
Brampton 0 $0 $0 - 0 0 - -
Caledon 0 $0 $0 - 0 0 - -
Mississauga 2 $870,000 $435,000 $435,000 1 0 99% 40
City of Toronto 9 $7,116,000 $790,667 $535,000 20 20 99% 68
Toronto West 4 $1,710,000 $427,500 $427,500 4 5 99% 109
Toronto Central 5 $5,406,000 $1,081,200 $971,000 11 12 99% 34
Toronto East 0 $0 $0 - 5 3 - -
York Region 0 $0 $0 - 0 0 - -
Aurora 0 $0 $0 - 0 0 - -
East Gwillimbury 0 $0 $0 - 0 0 - -
Georgina 0 $0 $0 - 0 0 - -
King 0 $0 $0 - 0 0 - -
Markham 0 $0 $0 - 0 0 - -
Newmarket 0 $0 $0 - 0 0 - -
Richmond Hill 0 $0 $0 - 0 0 - -
Vaughan 0 $0 $0 - 0 0 - -
Whitchurch-Stouffville 0 $0 $0 - 0 0 - -
Durham Region 0 $0 $0 - 0 0 - -
Ajax 0 $0 $0 - 0 0 - -
Brock 0 $0 $0 - 0 0 - -
Clarington 0 $0 $0 - 0 0 - -
Oshawa 0 $0 $0 - 0 0 - -
Pickering 0 $0 $0 - 0 0 - -
Scugog 0 $0 $0 - 0 0 - -
Uxbridge 0 $0 $0 - 0 0 - -
Whitby 0 $0 $0 - 0 0 - -
Dufferin County 0 $0 $0 - 0 0 - -
Orangeville 0 $0 $0 - 0 0 - -
Simcoe County 0 $0 $0 - 0 0 - -
Adjala-Tosorontio 0 $0 $0 - 0 0 - -
Bradford West Gwillimbury 0 $0 $0 - 0 0 - -
Essa 0 $0 $0 - 0 0 - -
Innisfil 0 $0 $0 - 0 0 - -
New Tecumseth 0 $0 $0 - 0 0 - -
Municipality Number of Sales Dollar Volume Average Price Median Price New Listings Active Listings Avg. SP/LP Avg. LDOM
CO-OP APT, APRIL 2022
Toronto Regional Real Estate Board
SUMMARY OF EXISTING HOME TRANSACTIONS
ALL TRREB AREAS
1 1 2 4 5
1 1 3
19
Market Watch, April 2022
Copyright®
2021 Toronto Regional Real Estate Board
TRREB Total 11 $7,986,000 $726,000 $460,000 21 22 99% 63
City of Toronto 9 $7,116,000 $790,667 $535,000 20 20 99% 68
Toronto West 4 $1,710,000 $427,500 $427,500 4 5 99% 109
Toronto W01 0 $0 $0 - 0 0 - -
Toronto W02 0 $0 $0 - 1 1 - -
Toronto W03 0 $0 $0 - 0 0 - -
Toronto W04 0 $0 $0 - 0 0 - -
Toronto W05 0 $0 $0 - 0 1 - -
Toronto W06 1 $320,000 $320,000 $320,000 1 1 96% 91
Toronto W07 0 $0 $0 - 0 0 - -
Toronto W08 3 $1,390,000 $463,333 $440,000 1 0 100% 115
Toronto W09 0 $0 $0 - 1 1 - -
Toronto W10 0 $0 $0 - 0 1 - -
Toronto Central 5 $5,406,000 $1,081,200 $971,000 11 12 99% 34
Toronto C01 0 $0 $0 - 0 0 - -
Toronto C02 1 $355,000 $355,000 $355,000 0 0 96% 26
Toronto C03 0 $0 $0 - 0 0 - -
Toronto C04 0 $0 $0 - 0 0 - -
Toronto C06 0 $0 $0 - 0 0 - -
Toronto C07 0 $0 $0 - 2 1 - -
Toronto C08 1 $1,475,000 $1,475,000 $1,475,000 1 1 100% 41
Toronto C09 3 $3,576,000 $1,192,000 $971,000 7 9 99% 35
Toronto C10 0 $0 $0 - 0 0 - -
Toronto C11 0 $0 $0 - 0 0 - -
Toronto C12 0 $0 $0 - 0 0 - -
Toronto C13 0 $0 $0 - 0 0 - -
Toronto C14 0 $0 $0 - 0 0 - -
Toronto C15 0 $0 $0 - 1 1 - -
Toronto East 0 $0 $0 - 5 3 - -
Toronto E01 0 $0 $0 - 0 0 - -
Toronto E02 0 $0 $0 - 0 0 - -
Toronto E03 0 $0 $0 - 0 0 - -
Toronto E04 0 $0 $0 - 1 1 - -
Toronto E05 0 $0 $0 - 0 0 - -
Toronto E06 0 $0 $0 - 0 0 - -
Toronto E07 0 $0 $0 - 0 0 - -
Toronto E08 0 $0 $0 - 0 0 - -
Toronto E09 0 $0 $0 - 0 0 - -
Toronto E10 0 $0 $0 - 4 2 - -
Toronto E11 0 $0 $0 - 0 0 - -
Municipality Number of Sales Dollar Volume Average Price Median Price New Listings Active Listings Avg. SP/LP Avg. LDOM
CO-OP APT, APRIL 2022
Toronto Regional Real Estate Board
SUMMARY OF EXISTING HOME TRANSACTIONS
CITY OF TORONTO MUNICIPAL BREAKDOWN
1 1 2 4 5
1 1 3
20
Market Watch, April 2022
Copyright® 2021 Toronto Regional Real Estate Board
TRREB Total 8 $8,826,999 $1,103,375 $1,012,500 15 13 107% 11
Halton Region 3 $4,653,000 $1,551,000 $1,770,000 2 2 107% 9
Burlington 1 $1,083,000 $1,083,000 $1,083,000 1 2 108% 8
Halton Hills 0 $0 $0 - 0 0 - -
Milton 0 $0 $0 - 0 0 - -
Oakville 2 $3,570,000 $1,785,000 $1,785,000 1 0 107% 9
Peel Region 1 $999,999 $999,999 $999,999 3 2 125% 7
Brampton 0 $0 $0 - 1 1 - -
Caledon 0 $0 $0 - 0 0 - -
Mississauga 1 $999,999 $999,999 $999,999 2 1 125% 7
City of Toronto 0 $0 $0 - 0 0 - -
Toronto West 0 $0 $0 - 0 0 - -
Toronto Central 0 $0 $0 - 0 0 - -
Toronto East 0 $0 $0 - 0 0 - -
York Region 0 $0 $0 - 1 3 - -
Aurora 0 $0 $0 - 0 0 - -
East Gwillimbury 0 $0 $0 - 0 0 - -
Georgina 0 $0 $0 - 0 0 - -
King 0 $0 $0 - 0 0 - -
Markham 0 $0 $0 - 0 2 - -
Newmarket 0 $0 $0 - 0 0 - -
Richmond Hill 0 $0 $0 - 0 0 - -
Vaughan 0 $0 $0 - 1 1 - -
Whitchurch-Stouffville 0 $0 $0 - 0 0 - -
Durham Region 0 $0 $0 - 2 1 - -
Ajax 0 $0 $0 - 2 1 - -
Brock 0 $0 $0 - 0 0 - -
Clarington 0 $0 $0 - 0 0 - -
Oshawa 0 $0 $0 - 0 0 - -
Pickering 0 $0 $0 - 0 0 - -
Scugog 0 $0 $0 - 0 0 - -
Uxbridge 0 $0 $0 - 0 0 - -
Whitby 0 $0 $0 - 0 0 - -
Dufferin County 0 $0 $0 - 0 0 - -
Orangeville 0 $0 $0 - 0 0 - -
Simcoe County 4 $3,174,000 $793,500 $734,500 7 5 102% 13
Adjala-Tosorontio 0 $0 $0 - 0 0 - -
Bradford West Gwillimbury 0 $0 $0 - 0 0 - -
Essa 0 $0 $0 - 0 0 - -
Innisfil 0 $0 $0 - 0 0 - -
New Tecumseth 4 $3,174,000 $793,500 $734,500 7 5 102% 13
Municipality Number of Sales Dollar Volume Average Price Median Price New Listings Active Listings Avg. SP/LP Avg. LDOM
DET CONDO, APRIL 2022
Toronto Regional Real Estate Board
SUMMARY OF EXISTING HOME TRANSACTIONS
ALL TRREB AREAS
1 1 2 4 5
1 1 3
21
Market Watch, April 2022
Copyright® 2021 Toronto Regional Real Estate Board
TRREB Total 8 $8,826,999 $1,103,375 $1,012,500 15 13 107% 11
City of Toronto 0 $0 $0 - 0 0 - -
Toronto West 0 $0 $0 - 0 0 - -
Toronto W01 0 $0 $0 - 0 0 - -
Toronto W02 0 $0 $0 - 0 0 - -
Toronto W03 0 $0 $0 - 0 0 - -
Toronto W04 0 $0 $0 - 0 0 - -
Toronto W05 0 $0 $0 - 0 0 - -
Toronto W06 0 $0 $0 - 0 0 - -
Toronto W07 0 $0 $0 - 0 0 - -
Toronto W08 0 $0 $0 - 0 0 - -
Toronto W09 0 $0 $0 - 0 0 - -
Toronto W10 0 $0 $0 - 0 0 - -
Toronto Central 0 $0 $0 - 0 0 - -
Toronto C01 0 $0 $0 - 0 0 - -
Toronto C02 0 $0 $0 - 0 0 - -
Toronto C03 0 $0 $0 - 0 0 - -
Toronto C04 0 $0 $0 - 0 0 - -
Toronto C06 0 $0 $0 - 0 0 - -
Toronto C07 0 $0 $0 - 0 0 - -
Toronto C08 0 $0 $0 - 0 0 - -
Toronto C09 0 $0 $0 - 0 0 - -
Toronto C10 0 $0 $0 - 0 0 - -
Toronto C11 0 $0 $0 - 0 0 - -
Toronto C12 0 $0 $0 - 0 0 - -
Toronto C13 0 $0 $0 - 0 0 - -
Toronto C14 0 $0 $0 - 0 0 - -
Toronto C15 0 $0 $0 - 0 0 - -
Toronto East 0 $0 $0 - 0 0 - -
Toronto E01 0 $0 $0 - 0 0 - -
Toronto E02 0 $0 $0 - 0 0 - -
Toronto E03 0 $0 $0 - 0 0 - -
Toronto E04 0 $0 $0 - 0 0 - -
Toronto E05 0 $0 $0 - 0 0 - -
Toronto E06 0 $0 $0 - 0 0 - -
Toronto E07 0 $0 $0 - 0 0 - -
Toronto E08 0 $0 $0 - 0 0 - -
Toronto E09 0 $0 $0 - 0 0 - -
Toronto E10 0 $0 $0 - 0 0 - -
Toronto E11 0 $0 $0 - 0 0 - -
Municipality Number of Sales Dollar Volume Average Price Median Price New Listings Active Listings Avg. SP/LP Avg. LDOM
DET CONDO, APRIL 2022
Toronto Regional Real Estate Board
SUMMARY OF EXISTING HOME TRANSACTIONS
CITY OF TORONTO MUNICIPAL BREAKDOWN
1 1 2 4 5
1 1 3
22
Market Watch, April 2022
Copyright® 2021 Toronto Regional Real Estate Board
TRREB Total 8 $5,000,000 $625,000 $645,000 17 16 99% 26
Halton Region 0 $0 $0 - 0 0 - -
Burlington 0 $0 $0 - 0 0 - -
Halton Hills 0 $0 $0 - 0 0 - -
Milton 0 $0 $0 - 0 0 - -
Oakville 0 $0 $0 - 0 0 - -
Peel Region 0 $0 $0 - 0 0 - -
Brampton 0 $0 $0 - 0 0 - -
Caledon 0 $0 $0 - 0 0 - -
Mississauga 0 $0 $0 - 0 0 - -
City of Toronto 8 $5,000,000 $625,000 $645,000 17 16 99% 26
Toronto West 1 $515,000 $515,000 $515,000 1 1 97% 33
Toronto Central 7 $4,485,000 $640,714 $660,000 16 15 99% 25
Toronto East 0 $0 $0 - 0 0 - -
York Region 0 $0 $0 - 0 0 - -
Aurora 0 $0 $0 - 0 0 - -
East Gwillimbury 0 $0 $0 - 0 0 - -
Georgina 0 $0 $0 - 0 0 - -
King 0 $0 $0 - 0 0 - -
Markham 0 $0 $0 - 0 0 - -
Newmarket 0 $0 $0 - 0 0 - -
Richmond Hill 0 $0 $0 - 0 0 - -
Vaughan 0 $0 $0 - 0 0 - -
Whitchurch-Stouffville 0 $0 $0 - 0 0 - -
Durham Region 0 $0 $0 - 0 0 - -
Ajax 0 $0 $0 - 0 0 - -
Brock 0 $0 $0 - 0 0 - -
Clarington 0 $0 $0 - 0 0 - -
Oshawa 0 $0 $0 - 0 0 - -
Pickering 0 $0 $0 - 0 0 - -
Scugog 0 $0 $0 - 0 0 - -
Uxbridge 0 $0 $0 - 0 0 - -
Whitby 0 $0 $0 - 0 0 - -
Dufferin County 0 $0 $0 - 0 0 - -
Orangeville 0 $0 $0 - 0 0 - -
Simcoe County 0 $0 $0 - 0 0 - -
Adjala-Tosorontio 0 $0 $0 - 0 0 - -
Bradford West Gwillimbury 0 $0 $0 - 0 0 - -
Essa 0 $0 $0 - 0 0 - -
Innisfil 0 $0 $0 - 0 0 - -
New Tecumseth 0 $0 $0 - 0 0 - -
Municipality Number of Sales Dollar Volume Average Price Median Price New Listings Active Listings Avg. SP/LP Avg. LDOM
CO-OWNERSHIP APT, APRIL 2022
Toronto Regional Real Estate Board
SUMMARY OF EXISTING HOME TRANSACTIONS
ALL TRREB AREAS
1 1 2 4 5
1 1 3
23
Market Watch, April 2022
Copyright® 2021 Toronto Regional Real Estate Board
TRREB Total 8 $5,000,000 $625,000 $645,000 17 16 99% 26
City of Toronto 8 $5,000,000 $625,000 $645,000 17 16 99% 26
Toronto West 1 $515,000 $515,000 $515,000 1 1 97% 33
Toronto W01 0 $0 $0 - 0 0 - -
Toronto W02 0 $0 $0 - 0 0 - -
Toronto W03 0 $0 $0 - 0 0 - -
Toronto W04 0 $0 $0 - 0 0 - -
Toronto W05 0 $0 $0 - 1 1 - -
Toronto W06 1 $515,000 $515,000 $515,000 0 0 97% 33
Toronto W07 0 $0 $0 - 0 0 - -
Toronto W08 0 $0 $0 - 0 0 - -
Toronto W09 0 $0 $0 - 0 0 - -
Toronto W10 0 $0 $0 - 0 0 - -
Toronto Central 7 $4,485,000 $640,714 $660,000 16 15 99% 25
Toronto C01 0 $0 $0 - 1 1 - -
Toronto C02 1 $615,000 $615,000 $615,000 3 3 99% 48
Toronto C03 3 $2,220,000 $740,000 $780,000 5 2 98% 15
Toronto C04 1 $630,000 $630,000 $630,000 3 2 102% 15
Toronto C06 0 $0 $0 - 0 0 - -
Toronto C07 0 $0 $0 - 0 0 - -
Toronto C08 0 $0 $0 - 1 1 - -
Toronto C09 1 $695,000 $695,000 $695,000 0 0 100% 29
Toronto C10 0 $0 $0 - 0 0 - -
Toronto C11 0 $0 $0 - 0 0 - -
Toronto C12 0 $0 $0 - 0 0 - -
Toronto C13 0 $0 $0 - 1 1 - -
Toronto C14 1 $325,000 $325,000 $325,000 1 4 96% 38
Toronto C15 0 $0 $0 - 1 1 - -
Toronto East 0 $0 $0 - 0 0 - -
Toronto E01 0 $0 $0 - 0 0 - -
Toronto E02 0 $0 $0 - 0 0 - -
Toronto E03 0 $0 $0 - 0 0 - -
Toronto E04 0 $0 $0 - 0 0 - -
Toronto E05 0 $0 $0 - 0 0 - -
Toronto E06 0 $0 $0 - 0 0 - -
Toronto E07 0 $0 $0 - 0 0 - -
Toronto E08 0 $0 $0 - 0 0 - -
Toronto E09 0 $0 $0 - 0 0 - -
Toronto E10 0 $0 $0 - 0 0 - -
Toronto E11 0 $0 $0 - 0 0 - -
Municipality Number of Sales Dollar Volume Average Price Median Price New Listings Active Listings Avg. SP/LP Avg. LDOM
CO-OWNERSHIP APT, APRIL 2022
Toronto Regional Real Estate Board
SUMMARY OF EXISTING HOME TRANSACTIONS
CITY OF TORONTO MUNICIPAL BREAKDOWN
1 1 2 4 5
1 1 3
24
Market Watch, April 2022
Copyright® 2021 Toronto Regional Real Estate Board
443.2 $1,354,000 30.58% 445.8 $1,667,800 29.93% 462.2 $1,302,000 30.05% 440.7 $948,700 30.69% 417.0 $825,800 31.42%
451.5 $1,390,700 24.31% 449.7 $1,641,000 22.70% 469.3 $1,187,800 24.38% 436.2 $840,400 21.50% 435.9 $824,900 28.09%
456.7 $1,317,700 23.40% 460.8 $1,586,000 21.74% 492.9 $1,201,700 22.43% 445.8 $833,100 22.54% 446.9 $737,800 28.72%
457.6 $1,349,700 28.83% 450.8 $1,470,300 29.61% 465.2 $1,036,600 26.69% 474.5 $755,500 25.96% 439.7 $671,400 29.63%
450.9 $1,372,400 29.01% 445.2 $1,639,800 26.80% 464.0 $1,118,500 27.65% 418.6 $718,000 20.88% 413.0 $849,700 28.10%
444.8 $1,502,100 21.50% 442.1 $1,792,700 19.23% 463.6 $1,292,300 21.30% 422.4 $959,300 20.27% 428.2 $855,400 27.02%
455.9 $1,292,000 35.48% 449.2 $1,590,800 34.69% 465.1 $1,188,500 34.54% 448.8 $948,900 33.65% 456.7 $780,900 39.15%
471.0 $1,199,700 37.32% 460.1 $1,355,600 37.22% 475.8 $1,111,200 35.75% 467.5 $845,300 35.51% 473.6 $698,500 48.00%
433.8 $1,585,300 38.68% 438.9 $1,668,400 38.80% 470.3 $1,161,800 35.07% 414.8 $897,900 36.67% - - -
444.4 $1,312,000 33.57% 436.7 $1,744,200 30.40% 445.8 $1,229,400 32.48% 441.2 $975,100 32.81% 453.5 $796,200 37.47%
416.5 $1,373,300 25.57% 418.1 $1,889,100 22.57% 432.9 $1,462,500 19.55% 419.2 $994,300 29.14% 408.7 $833,900 28.28%
449.5 $1,531,500 34.90% 455.7 $1,761,800 32.51% 463.2 $1,338,700 36.00% 415.2 $1,074,400 35.38% 392.8 $852,800 39.54%
444.6 $1,470,500 35.18% 446.2 $1,676,400 34.89% 476.1 $1,227,700 38.04% 399.0 $1,080,900 30.86% 388.8 $834,200 37.68%
433.1 $1,482,000 34.25% 432.2 $1,542,100 33.11% 480.5 $1,005,100 38.19% - - - - - -
475.2 $922,100 36.47% 485.7 $937,000 36.70% 483.1 $952,300 38.82% - - - - - -
456.2 $2,123,300 34.89% 463.5 $2,172,300 34.86% 459.8 $1,410,200 40.23% - - - 356.2 $880,500 34.36%
461.4 $1,621,800 37.20% 473.5 $1,982,400 31.78% 480.7 $1,431,000 37.58% 407.1 $1,098,700 38.89% 410.5 $945,400 43.78%
426.5 $1,255,900 36.17% 428.0 $1,442,600 35.96% 438.3 $1,032,300 38.26% 436.4 $903,100 29.84% 394.6 $675,300 38.85%
460.0 $1,652,800 32.95% 481.7 $2,057,500 29.42% 456.4 $1,387,600 32.60% 394.1 $999,100 37.94% 400.6 $810,600 38.95%
428.5 $1,564,000 32.99% 419.7 $1,783,200 30.18% 447.2 $1,357,700 34.05% 434.7 $1,202,000 36.10% 370.8 $856,400 36.37%
482.1 $1,679,500 35.76% 477.6 $1,761,700 34.54% 504.5 $1,258,800 41.83% 477.2 $847,000 23.24% 387.2 $774,800 36.82%
483.5 $1,128,900 37.63% 468.8 $1,223,400 37.16% 501.8 $1,000,800 37.03% 513.5 $807,900 37.15% 487.2 $808,500 45.48%
478.8 $1,180,800 39.11% 476.4 $1,278,000 38.93% 500.4 $1,079,800 39.46% 446.6 $839,200 32.52% 437.5 $702,600 42.88%
452.3 $762,800 37.94% 451.7 $769,400 37.84% 432.7 $872,800 32.32% - - - - - -
464.6 $981,300 32.36% 449.6 $1,082,800 32.12% 456.0 $871,100 29.22% 515.3 $832,400 39.31% 416.5 $613,800 43.32%
511.5 $972,700 38.84% 487.4 $1,040,200 38.15% 553.0 $925,500 37.56% 578.1 $732,700 41.03% 528.1 $597,400 58.97%
480.1 $1,280,600 37.53% 452.5 $1,409,700 36.67% 482.6 $1,126,100 35.87% 480.5 $819,900 34.71% 612.9 $1,154,500 43.54%
433.2 $1,112,200 37.09% 426.5 $1,130,500 37.09% 454.9 $845,700 41.80% - - - - - -
428.9 $1,429,100 35.51% 430.7 $1,487,600 35.53% 419.7 $973,300 37.02% 412.8 $751,700 30.76% 375.2 $896,000 42.28%
483.2 $1,255,400 39.65% 479.8 $1,379,900 39.15% 500.3 $1,102,100 39.63% 475.9 $799,600 32.97% 387.5 $719,400 42.62%
488.5 $1,078,100 31.64% 504.9 $1,150,700 29.03% 488.1 $914,700 30.40% 487.4 $644,300 44.03% 499.0 $732,000 48.20%
488.5 $1,078,100 31.64% 504.9 $1,150,600 29.03% 488.1 $914,700 30.40% 487.4 $644,300 44.03% 499.0 $732,000 48.20%
432.0 $943,700 29.77% 414.9 $951,900 30.84% 500.2 $934,200 36.97% 432.8 $683,300 41.21% 430.4 $680,700 42.99%
395.5 $1,057,400 25.08% 396.1 $1,060,500 25.15% - - - - - - - - -
464.8 $1,163,600 35.63% 432.1 $1,232,900 34.48% 522.9 $1,101,800 49.06% 477.4 $775,300 40.62% 390.7 $659,100 38.11%
463.0 $926,900 30.42% 442.1 $935,500 34.79% 512.0 $807,900 32.99% 457.0 $728,900 32.23% - - -
414.4 $817,300 24.56% 405.9 $825,200 27.48% 521.1 $796,800 32.60% 426.8 $358,900 54.92% 394.5 $775,200 37.12%
- - - - - - - - - - - - - - -
415.9 $977,000 32.88% 397.6 $1,035,200 28.92% 460.8 $839,100 30.98% 423.3 $855,500 40.49% 458.6 $715,300 44.76%
Composite Single Family Detached Single Family Attached Townhouse Apartment
Index Benchmark Yr./Yr. % Chg. Index Benchmark Yr./Yr. % Chg. Index Benchmark Yr./Yr. % Chg. Index Benchmark Yr./Yr. % Chg. Index Benchmark Yr./Yr. % Chg.
Toronto Regional Real Estate Board
FOCUS ON THE MLS HOME PRICE INDEX
ALL TRREB AREAS
INDEX AND BENCHMARK PRICE, APRIL 2022
TRREB Total
Halton Region
Burlington
Halton Hills
Milton
Oakville
Peel Region
Brampton
Caledon
Mississauga
City of Toronto
York Region
Aurora
East Gwillimbury
Georgina
King
Markham
Newmarket
Richmond Hill
Vaughan
Whitchurch-Stouffville
Durham Region
Ajax
Brock
Clarington
Oshawa
Pickering
Scugog
Uxbridge
Whitby
Dufferin County
Orangeville
Simcoe County
Adjala-Tosorontio
Bradford West Gwillimbury
Essa
Innisfil
Barrie
New Tecumseth
25
Market Watch, April 2022
Copyright® 2021 Toronto Regional Real Estate Board
443.2 $1,354,000 30.58% 445.8 $1,667,800 29.93% 462.2 $1,302,000 30.05% 440.7 $948,700 30.69% 417.0 $825,800 31.42%
416.5 $1,373,300 25.57% 418.1 $1,889,100 22.57% 432.9 $1,462,500 19.55% 419.2 $994,300 29.14% 408.7 $833,900 28.28%
392.1 $1,673,800 24.00% 404.6 $2,253,600 20.52% 427.0 $1,697,200 18.94% 351.6 $1,057,900 29.41% 380.9 $861,200 25.75%
455.5 $1,622,900 21.18% 424.2 $1,854,200 17.25% 475.6 $1,414,300 16.28% 499.3 $972,200 28.85% 445.1 $955,500 27.46%
461.3 $1,189,500 22.82% 468.0 $1,266,600 21.68% 470.8 $1,206,000 21.06% 366.1 $897,700 30.66% 448.9 $767,000 30.08%
425.4 $1,091,800 24.90% 405.9 $1,284,500 23.64% 409.5 $1,163,800 24.92% 376.3 $866,200 29.76% 456.5 $673,400 25.21%
403.7 $959,000 25.92% 406.2 $1,362,200 24.18% 392.3 $1,139,500 26.02% 388.7 $705,800 30.26% 426.2 $563,100 23.57%
360.1 $1,054,700 25.65% 453.2 $1,432,100 19.48% 410.7 $1,383,000 20.79% 441.4 $1,308,800 31.56% 299.9 $752,300 27.94%
372.4 $1,646,800 19.59% 401.4 $1,840,800 20.69% 391.6 $1,627,900 22.30% 293.0 $1,077,100 17.81% 219.3 $889,300 17.59%
361.7 $1,533,100 24.12% 367.5 $2,060,500 20.85% 399.8 $1,503,400 21.04% 418.2 $1,005,800 28.91% 347.1 $722,800 26.03%
402.5 $1,050,200 28.02% 394.7 $1,530,600 22.20% 420.1 $1,158,800 24.07% 320.6 $890,400 28.45% 433.2 $570,700 36.23%
475.1 $1,085,300 35.32% 431.8 $1,295,300 28.51% 424.2 $1,085,500 25.28% 516.2 $929,300 29.02% 513.9 $732,100 43.43%
421.8 $1,058,200 21.38% 458.3 $1,795,600 8.09% 449.9 $1,644,000 6.66% 415.1 $1,183,200 25.45% 418.8 $871,900 22.92%
383.1 $1,930,100 19.91% 368.5 $3,110,300 18.83% 383.0 $2,146,500 16.10% 367.4 $1,847,400 19.05% 381.5 $1,086,900 21.85%
444.1 $2,573,400 19.32% 418.0 $2,833,800 17.45% 436.7 $1,685,100 16.73% - - - 497.7 $1,301,900 27.35%
365.5 $2,357,300 24.19% 376.2 $2,753,900 23.43% 392.6 $1,836,000 23.65% - - - 317.3 $848,800 27.48%
397.1 $1,600,000 22.07% 393.7 $1,752,900 17.52% 376.0 $1,386,000 20.82% 363.8 $975,700 23.57% 402.2 $865,000 26.28%
413.4 $1,413,000 24.52% 425.2 $2,024,300 15.70% 352.5 $1,329,400 22.23% 364.8 $1,028,200 23.24% 416.2 $867,300 30.35%
383.2 $995,100 26.01% 372.0 $2,178,200 14.08% 387.3 $1,847,600 12.85% 391.2 $1,011,700 18.76% 382.8 $820,000 27.39%
321.3 $2,305,000 23.20% 332.5 $4,286,900 24.16% 332.4 $3,146,200 22.12% 359.7 $2,124,400 19.70% 304.1 $1,007,500 23.37%
407.1 $1,609,100 28.42% 371.7 $2,294,900 23.16% 371.7 $1,836,400 27.21% 349.2 $1,170,500 22.61% 425.8 $1,016,800 30.53%
445.1 $1,614,700 24.26% 404.5 $2,912,400 22.28% 432.4 $2,005,000 19.84% 380.4 $659,000 32.36% 470.6 $683,300 25.80%
350.9 $3,031,500 23.69% 340.0 $3,686,400 20.01% 414.1 $1,702,500 22.44% 296.7 $1,187,100 24.66% 414.8 $1,300,500 33.85%
398.5 $1,492,300 24.38% 386.7 $2,152,800 16.44% 380.8 $1,187,600 20.39% 356.4 $1,030,300 27.60% 410.1 $837,800 31.06%
406.5 $1,379,800 29.71% 422.9 $2,544,100 17.05% 356.4 $1,840,100 29.27% 461.5 $1,242,800 33.50% 396.5 $998,500 32.74%
423.5 $1,371,500 32.22% 406.5 $1,908,600 19.81% 359.7 $1,169,400 26.39% 413.3 $989,200 27.84% 437.7 $1,007,700 38.43%
482.0 $1,500,200 18.17% 485.5 $1,710,300 13.73% 495.4 $1,562,400 14.73% 587.9 $1,075,300 22.53% 395.2 $884,000 30.69%
444.3 $1,658,700 21.43% 386.5 $1,749,100 19.47% 463.2 $1,550,100 18.01% 454.1 $1,307,900 22.56% 425.8 $1,209,900 33.10%
438.7 $1,364,700 21.66% 440.7 $1,498,000 19.01% 421.4 $1,406,500 19.58% - - - 455.2 $680,400 40.15%
447.3 $1,103,200 28.02% 427.7 $1,260,900 26.39% 447.4 $1,078,200 26.74% 407.3 $866,000 32.07% 504.0 $768,600 30.64%
394.3 $1,047,700 29.07% 427.0 $1,503,700 28.31% 425.7 $1,173,100 31.75% 404.9 $880,500 25.16% 347.7 $713,700 29.59%
448.3 $1,246,700 26.75% 453.6 $1,295,700 24.34% 453.4 $1,078,300 25.04% 433.4 $957,800 34.81% 418.3 $861,100 36.92%
450.6 $1,104,500 35.07% 453.6 $1,486,800 34.20% 444.2 $1,161,400 34.89% 408.4 $884,700 23.80% 456.4 $781,600 37.64%
451.0 $1,039,700 29.90% 434.2 $1,353,400 26.33% 391.3 $1,014,400 26.96% 434.7 $797,000 38.97% 483.5 $659,700 33.05%
450.4 $1,075,400 34.45% 445.2 $1,264,100 31.33% 422.8 $1,034,000 29.18% 490.8 $883,600 38.21% 452.5 $848,800 37.62%
466.7 $1,308,800 33.76% 448.6 $1,437,300 32.45% 454.1 $1,177,500 31.05% 540.0 $880,900 38.50% 425.9 $687,100 35.68%
467.6 $997,200 27.41% 454.8 $1,264,900 27.68% 462.8 $1,048,300 26.38% 383.1 $751,900 35.04% 583.7 $739,900 28.74%
Composite Single Family Detached Single Family Attached Townhouse Apartment
Index Benchmark Yr./Yr. % Chg. Index Benchmark Yr./Yr. % Chg. Index Benchmark Yr./Yr. % Chg. Index Benchmark Yr./Yr. % Chg. Index Benchmark Yr./Yr. % Chg.
Toronto Regional Real Estate Board
FOCUS ON THE MLS HOME PRICE INDEX
CITY OF TORONTO
INDEX AND BENCHMARK PRICE, APRIL 2022
TRREB Total
City of Toronto
Toronto W01
Toronto W02
Toronto W03
Toronto W04
Toronto W05
Toronto W06
Toronto W07
Toronto W08
Toronto W09
Toronto W10
Toronto C01
Toronto C02
Toronto C03
Toronto C04
Toronto C06
Toronto C07
Toronto C08
Toronto C09
Toronto C10
Toronto C11
Toronto C12
Toronto C13
Toronto C14
Toronto C15
Toronto E01
Toronto E02
Toronto E03
Toronto E04
Toronto E05
Toronto E06
Toronto E07
Toronto E08
Toronto E09
Toronto E10
Toronto E11
26
Market Watch, April 2022
Copyright® 2021 Toronto Regional Real Estate Board
2010 85,860 $431,262
2011 89,110 $464,989
2012 85,488 $497,073
2013 87,047 $522,951
2014 92,776 $566,611
2015 101,213 $622,118
2016 113,040 $729,821
2017 92,340 $822,496
2018 78,017 $787,800
2019 87,746 $819,043
2020 95,065 $929,623
Year Sales Average Price
Toronto Regional Real Estate Board
January 6,888 966,068
February 10,928 1,044,925
March 15,628 1,097,351
April 13,613 1,090,414
May 11,903 1,108,124
June 11,053 1,088,991
July 9,339 1,061,724
August 8,552 1,070,140
September 9,010 1,135,027
October 9,744 1,155,604
November 8,985 1,163,035
December 6,015 1,157,896
January 5,602 $1,242,325
February 9,061 $1,334,408
March 10,939 $1,300,082
April 8,008 $1,254,436
May - -
June - -
July - -
August - -
September - -
October - -
November - -
December - -
Annual 121,658 $1,095,380
HISTORIC ANNUAL STATISTICS1,6,7
Year to Date 33,610 $1,288,834
NOTES
*For historic annual sales and average price data over a longer time frame go to:
http://www.torontorealestateboard.com/market_news/market_watch/historic_stats/
pdf/TREB_historic_statistics.pdf
Ajax
Aurora
Bradford West
Gwillimbury
Brampton
Brock
Burlington
C01
C02
C03
C04
C06
C07
C08
C10 C11
C12 C13
C14
C15
Caledon
Clarington
E01
E02
E03
E04
E06
E07
E08
E09
E10
E11
East Gwillimbury
Essa
Georgina
Halton Hills
Innisfil
King
Markham
Milton
Mississauga
New Tecumseth
Newmarket
Oakville
Oshawa
Pickering
Richmond
Hill
Scugog
Uxbridge
Vaughan
W02
W03
W04
W05
W06
W07
W08
W09
W10
Whitchurch-Stouffville
Adjala-Tosorontio
Orangeville
Whitby
Dufferin
Durham
Halton
Peel
Simcoe
Toronto
York
27
Market Watch, April 2022
Copyright® 2021 Toronto Regional Real Estate Board
1 - Sales, dollar volume, average sale prices and median sale prices are based on firm transactions entered into the TRREB
MLS® system between the first and last day of the month/period being reported.
2 - New listings entered into the TRREB MLS® system between the first and last day of the month/period being reported.
3 - Active listings at the end of the last day of the month/period being reported.
4 - Ratio of the average selling price to the average listing price for firm transactions entered into the TRREB MLS® system
between the first and last day of the month/period being reported.
5 - Average Listing Days on Market (Avg. LDOM) refers to the average number of days sold listings were on the market.
Average Property Days on Market (Avg. PDOM) refers to the average number of days a property was on the market before
selling irrespective of whether the property was listed more than once by the same combination of seller and brokerage during
the original listing contract period.
6 - Active listings at the end of the last day of the month/period being reported.
7 - Past monthly and year-to-date figures are revised on a monthly basis.
8 - SNLR = Sales-to-New Listings Ratio. Calculated using a 12-month moving average (sales/new listings).
9 - Mos. Inv. = Months of Inventory. Calculated using a 12-month moving average (active listings/sales).
2022 MONTHLY STATISTICS1,7
2021 MONTHLY STATISTICS1,7

Más contenido relacionado

Similar a Full Market April Market Watch 2022

Market Watch APRIL 2015
Market Watch APRIL 2015Market Watch APRIL 2015
Market Watch APRIL 2015
Chaba Tamasi
 
TORONTO REAL ESTATE BOARD'S -- MARKET WATCH - JULY 2019
TORONTO REAL ESTATE BOARD'S -- MARKET WATCH - JULY 2019TORONTO REAL ESTATE BOARD'S -- MARKET WATCH - JULY 2019
TORONTO REAL ESTATE BOARD'S -- MARKET WATCH - JULY 2019
Shawn Venasse
 
Toronto real estate market watch october 2010
Toronto real estate market watch   october 2010Toronto real estate market watch   october 2010
Toronto real estate market watch october 2010
Vahab Jalali
 
Toronto Real Estate Statistics October 2010
Toronto Real Estate Statistics October 2010Toronto Real Estate Statistics October 2010
Toronto Real Estate Statistics October 2010
John Helfrich
 

Similar a Full Market April Market Watch 2022 (20)

Market Watch June 2013
Market Watch June 2013Market Watch June 2013
Market Watch June 2013
 
Market Watch - September 2019
Market Watch - September 2019Market Watch - September 2019
Market Watch - September 2019
 
April 2021 - TRREB Market Report
April 2021 - TRREB Market Report April 2021 - TRREB Market Report
April 2021 - TRREB Market Report
 
Market Report for August 2017 - Residential Resale
Market Report for August 2017 - Residential ResaleMarket Report for August 2017 - Residential Resale
Market Report for August 2017 - Residential Resale
 
2013 04 market watch
2013 04 market watch2013 04 market watch
2013 04 market watch
 
October Market Watch is Here !
October Market Watch is Here !October Market Watch is Here !
October Market Watch is Here !
 
Market Watch APRIL 2015
Market Watch APRIL 2015Market Watch APRIL 2015
Market Watch APRIL 2015
 
June Market Report 2014
June Market Report 2014June Market Report 2014
June Market Report 2014
 
Market Report for October 2017 - Residential Resale
Market Report for October 2017 - Residential ResaleMarket Report for October 2017 - Residential Resale
Market Report for October 2017 - Residential Resale
 
Market watch jan 2019 frank yu oakville
Market watch jan 2019 frank yu oakvilleMarket watch jan 2019 frank yu oakville
Market watch jan 2019 frank yu oakville
 
Treb Market Watch - January 2016
Treb Market Watch - January 2016Treb Market Watch - January 2016
Treb Market Watch - January 2016
 
Market Watch TORONTO 2015 SEPTEMBER
Market Watch TORONTO 2015 SEPTEMBERMarket Watch TORONTO 2015 SEPTEMBER
Market Watch TORONTO 2015 SEPTEMBER
 
Market watch jul 2019 frank yu oakville
Market watch jul 2019 frank yu oakvilleMarket watch jul 2019 frank yu oakville
Market watch jul 2019 frank yu oakville
 
Market watch jul 2019 frank yu oakville
Market watch jul 2019 frank yu oakvilleMarket watch jul 2019 frank yu oakville
Market watch jul 2019 frank yu oakville
 
TORONTO REAL ESTATE BOARD'S -- MARKET WATCH - JULY 2019
TORONTO REAL ESTATE BOARD'S -- MARKET WATCH - JULY 2019TORONTO REAL ESTATE BOARD'S -- MARKET WATCH - JULY 2019
TORONTO REAL ESTATE BOARD'S -- MARKET WATCH - JULY 2019
 
TREB MARKET WATCH 2017
TREB MARKET WATCH 2017TREB MARKET WATCH 2017
TREB MARKET WATCH 2017
 
Toronto real estate market watch october 2010
Toronto real estate market watch   october 2010Toronto real estate market watch   october 2010
Toronto real estate market watch october 2010
 
Toronto Real Estate Statistics October 2010
Toronto Real Estate Statistics October 2010Toronto Real Estate Statistics October 2010
Toronto Real Estate Statistics October 2010
 
Market Watch TORONTO 2015 OCTOBER
Market Watch TORONTO 2015 OCTOBERMarket Watch TORONTO 2015 OCTOBER
Market Watch TORONTO 2015 OCTOBER
 
THE TORONTO REAL ESTATE BOARD'S MAY 2018 MARKET SALES STATISTICS WITH MEDIA R...
THE TORONTO REAL ESTATE BOARD'S MAY 2018 MARKET SALES STATISTICS WITH MEDIA R...THE TORONTO REAL ESTATE BOARD'S MAY 2018 MARKET SALES STATISTICS WITH MEDIA R...
THE TORONTO REAL ESTATE BOARD'S MAY 2018 MARKET SALES STATISTICS WITH MEDIA R...
 

Más de Michelle Makos

Más de Michelle Makos (16)

October Stats.pdf
October Stats.pdfOctober Stats.pdf
October Stats.pdf
 
March 2023 Market Watch
March 2023 Market WatchMarch 2023 Market Watch
March 2023 Market Watch
 
February 2022 Market Watch
February 2022 Market WatchFebruary 2022 Market Watch
February 2022 Market Watch
 
January 2023 Market Report
January 2023 Market ReportJanuary 2023 Market Report
January 2023 Market Report
 
August Market Watch 2022
August Market Watch 2022August Market Watch 2022
August Market Watch 2022
 
2020 TREB Year in Review
2020  TREB Year in Review2020  TREB Year in Review
2020 TREB Year in Review
 
January 2018 TREB Market Report
January 2018 TREB Market ReportJanuary 2018 TREB Market Report
January 2018 TREB Market Report
 
Market Watch July 2017
Market Watch July 2017Market Watch July 2017
Market Watch July 2017
 
Q2 2017 CONDO MARKET REPORT
Q2 2017 CONDO MARKET REPORTQ2 2017 CONDO MARKET REPORT
Q2 2017 CONDO MARKET REPORT
 
Mid Month Stats from TREB for July 2017
Mid Month Stats from TREB for July 2017Mid Month Stats from TREB for July 2017
Mid Month Stats from TREB for July 2017
 
MAY 2017 - MARKET STATS
MAY 2017 - MARKET STATSMAY 2017 - MARKET STATS
MAY 2017 - MARKET STATS
 
March 2017 - TREB Market
March 2017 - TREB MarketMarch 2017 - TREB Market
March 2017 - TREB Market
 
February 2017 Market Watch - JUST RELEASED
February 2017 Market Watch - JUST RELEASEDFebruary 2017 Market Watch - JUST RELEASED
February 2017 Market Watch - JUST RELEASED
 
TREB January 2017 Market Watch
TREB January 2017 Market WatchTREB January 2017 Market Watch
TREB January 2017 Market Watch
 
2017 Market - Year in Review
2017 Market - Year in Review2017 Market - Year in Review
2017 Market - Year in Review
 
December 2016 Market Watch
December 2016 Market WatchDecember 2016 Market Watch
December 2016 Market Watch
 

Último

Call Girls in shastri nagar Delhi 8264348440 ✅ call girls ❤️
Call Girls in shastri nagar Delhi 8264348440 ✅ call girls ❤️Call Girls in shastri nagar Delhi 8264348440 ✅ call girls ❤️
Call Girls in shastri nagar Delhi 8264348440 ✅ call girls ❤️
soniya singh
 
9990771857 Call Girls in Dwarka Sector 137 Noida (Call Girls) Delhi
9990771857 Call Girls in Dwarka Sector 137 Noida (Call Girls) Delhi9990771857 Call Girls in Dwarka Sector 137 Noida (Call Girls) Delhi
9990771857 Call Girls in Dwarka Sector 137 Noida (Call Girls) Delhi
delhimodel235
 
Low Rate ↬Call Girls in Trilokpuri Delhi ↫8447779280}Escorts Service In Delhi
Low Rate ↬Call Girls in Trilokpuri Delhi ↫8447779280}Escorts Service In DelhiLow Rate ↬Call Girls in Trilokpuri Delhi ↫8447779280}Escorts Service In Delhi
Low Rate ↬Call Girls in Trilokpuri Delhi ↫8447779280}Escorts Service In Delhi
asmaqueen5
 
9990771857 Call Girls in Dwarka Sector 6 Delhi (Call Girls) Delhi
9990771857 Call Girls in Dwarka Sector 6 Delhi (Call Girls) Delhi9990771857 Call Girls in Dwarka Sector 6 Delhi (Call Girls) Delhi
9990771857 Call Girls in Dwarka Sector 6 Delhi (Call Girls) Delhi
delhimodel235
 
Call Girls in Karkardooma Delhi +91 84487779280}Woman Seeking Man in Delhi NCR
Call Girls in Karkardooma Delhi +91 84487779280}Woman Seeking Man in Delhi NCRCall Girls in Karkardooma Delhi +91 84487779280}Woman Seeking Man in Delhi NCR
Call Girls in Karkardooma Delhi +91 84487779280}Woman Seeking Man in Delhi NCR
asmaqueen5
 
9990771857 Call Girls in Dwarka Sector 3 Delhi (Call Girls) Delhi
9990771857 Call Girls in Dwarka Sector 3 Delhi (Call Girls) Delhi9990771857 Call Girls in Dwarka Sector 3 Delhi (Call Girls) Delhi
9990771857 Call Girls in Dwarka Sector 3 Delhi (Call Girls) Delhi
delhimodel235
 
Best Deal Virtual Space in Satya The Hive Tata Zudio 750 Sqft 1.89 Cr All inc...
Best Deal Virtual Space in Satya The Hive Tata Zudio 750 Sqft 1.89 Cr All inc...Best Deal Virtual Space in Satya The Hive Tata Zudio 750 Sqft 1.89 Cr All inc...
Best Deal Virtual Space in Satya The Hive Tata Zudio 750 Sqft 1.89 Cr All inc...
ApartmentWala1
 

Último (20)

Call Girls in shastri nagar Delhi 8264348440 ✅ call girls ❤️
Call Girls in shastri nagar Delhi 8264348440 ✅ call girls ❤️Call Girls in shastri nagar Delhi 8264348440 ✅ call girls ❤️
Call Girls in shastri nagar Delhi 8264348440 ✅ call girls ❤️
 
M3M 129 E Brochure Noida Expressway, Sector 129, Noida
M3M 129 E Brochure Noida Expressway, Sector 129, NoidaM3M 129 E Brochure Noida Expressway, Sector 129, Noida
M3M 129 E Brochure Noida Expressway, Sector 129, Noida
 
9990771857 Call Girls in Dwarka Sector 137 Noida (Call Girls) Delhi
9990771857 Call Girls in Dwarka Sector 137 Noida (Call Girls) Delhi9990771857 Call Girls in Dwarka Sector 137 Noida (Call Girls) Delhi
9990771857 Call Girls in Dwarka Sector 137 Noida (Call Girls) Delhi
 
Kohinoor Flats In Hinjewadi Phase 2 | Homes Built To Suit Your Needs
Kohinoor Flats In Hinjewadi Phase 2 | Homes Built To Suit Your NeedsKohinoor Flats In Hinjewadi Phase 2 | Homes Built To Suit Your Needs
Kohinoor Flats In Hinjewadi Phase 2 | Homes Built To Suit Your Needs
 
Low Rate ↬Call Girls in Trilokpuri Delhi ↫8447779280}Escorts Service In Delhi
Low Rate ↬Call Girls in Trilokpuri Delhi ↫8447779280}Escorts Service In DelhiLow Rate ↬Call Girls in Trilokpuri Delhi ↫8447779280}Escorts Service In Delhi
Low Rate ↬Call Girls in Trilokpuri Delhi ↫8447779280}Escorts Service In Delhi
 
Maha Mauka Squarefeet Brochure |Maha Mauka Squarefeet PDF Brochure|
Maha Mauka Squarefeet Brochure |Maha Mauka Squarefeet PDF Brochure|Maha Mauka Squarefeet Brochure |Maha Mauka Squarefeet PDF Brochure|
Maha Mauka Squarefeet Brochure |Maha Mauka Squarefeet PDF Brochure|
 
SVN Live 5.6.24 Weekly Property Broadcast
SVN Live 5.6.24 Weekly Property BroadcastSVN Live 5.6.24 Weekly Property Broadcast
SVN Live 5.6.24 Weekly Property Broadcast
 
9990771857 Call Girls in Dwarka Sector 6 Delhi (Call Girls) Delhi
9990771857 Call Girls in Dwarka Sector 6 Delhi (Call Girls) Delhi9990771857 Call Girls in Dwarka Sector 6 Delhi (Call Girls) Delhi
9990771857 Call Girls in Dwarka Sector 6 Delhi (Call Girls) Delhi
 
TENANT SCREENING REPORT SERVICES​ How Tenant Screening Reports Work
TENANT SCREENING REPORT SERVICES​ How Tenant Screening Reports WorkTENANT SCREENING REPORT SERVICES​ How Tenant Screening Reports Work
TENANT SCREENING REPORT SERVICES​ How Tenant Screening Reports Work
 
Majestique Viman Nagar Pune Brochure.pdf
Majestique Viman Nagar Pune Brochure.pdfMajestique Viman Nagar Pune Brochure.pdf
Majestique Viman Nagar Pune Brochure.pdf
 
M3M The Line Brochure - Premium Investment Opportunity for Commercial Ventures
M3M The Line Brochure - Premium Investment Opportunity for Commercial VenturesM3M The Line Brochure - Premium Investment Opportunity for Commercial Ventures
M3M The Line Brochure - Premium Investment Opportunity for Commercial Ventures
 
3D Architectural Rendering Company by Panoram CGI
3D Architectural Rendering Company by Panoram CGI3D Architectural Rendering Company by Panoram CGI
3D Architectural Rendering Company by Panoram CGI
 
Call Girls in Karkardooma Delhi +91 84487779280}Woman Seeking Man in Delhi NCR
Call Girls in Karkardooma Delhi +91 84487779280}Woman Seeking Man in Delhi NCRCall Girls in Karkardooma Delhi +91 84487779280}Woman Seeking Man in Delhi NCR
Call Girls in Karkardooma Delhi +91 84487779280}Woman Seeking Man in Delhi NCR
 
Greater Vancouver Realtors Statistics Package April 2024
Greater Vancouver Realtors Statistics Package April 2024Greater Vancouver Realtors Statistics Package April 2024
Greater Vancouver Realtors Statistics Package April 2024
 
Shapoorji Pallonji Joyville Vista Pune | Spend Your Family Time Together
Shapoorji Pallonji Joyville Vista Pune | Spend Your Family Time TogetherShapoorji Pallonji Joyville Vista Pune | Spend Your Family Time Together
Shapoorji Pallonji Joyville Vista Pune | Spend Your Family Time Together
 
2k Shots ≽ 9205541914 ≼ Call Girls In Sainik Farm (Delhi)
2k Shots ≽ 9205541914 ≼ Call Girls In Sainik Farm (Delhi)2k Shots ≽ 9205541914 ≼ Call Girls In Sainik Farm (Delhi)
2k Shots ≽ 9205541914 ≼ Call Girls In Sainik Farm (Delhi)
 
9990771857 Call Girls in Dwarka Sector 3 Delhi (Call Girls) Delhi
9990771857 Call Girls in Dwarka Sector 3 Delhi (Call Girls) Delhi9990771857 Call Girls in Dwarka Sector 3 Delhi (Call Girls) Delhi
9990771857 Call Girls in Dwarka Sector 3 Delhi (Call Girls) Delhi
 
Best Deal Virtual Space in Satya The Hive Tata Zudio 750 Sqft 1.89 Cr All inc...
Best Deal Virtual Space in Satya The Hive Tata Zudio 750 Sqft 1.89 Cr All inc...Best Deal Virtual Space in Satya The Hive Tata Zudio 750 Sqft 1.89 Cr All inc...
Best Deal Virtual Space in Satya The Hive Tata Zudio 750 Sqft 1.89 Cr All inc...
 
Magarpatta Nova Elegance Mundhwa Pune E-Brochure.pdf
Magarpatta Nova Elegance Mundhwa Pune  E-Brochure.pdfMagarpatta Nova Elegance Mundhwa Pune  E-Brochure.pdf
Magarpatta Nova Elegance Mundhwa Pune E-Brochure.pdf
 
Premium Villa Projects in Sarjapur Road Bengaluru
Premium Villa Projects in Sarjapur Road BengaluruPremium Villa Projects in Sarjapur Road Bengaluru
Premium Villa Projects in Sarjapur Road Bengaluru
 

Full Market April Market Watch 2022

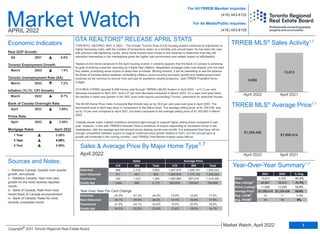
  • 1. Sales New Listings Active Listings Average Price Avg. LDOM Avg. PDOM 13,613 8,008 -41.2% 20,841 18,413 -11.7% 11,668 13,098 12.3% $1,090,414 $1,254,436 15.0% 10 11 1.1% 14 14 0% 2021 2022 % Chg. Year Market Watch APRIL 2022 Economic Indicators April 2022 GTA REALTORS® RELEASE APRIL STATS TORONTO, ONTARIO, MAY 4, 2022 – The Greater Toronto Area (GTA) housing market continued its adjustment to higher borrowing costs, with the number of transactions down on a monthly and annual basis. As has been the case with previous rate tightening cycles, some home buyers have moved to the sidelines to determine how they will reposition themselves in the marketplace given the higher rate environment and related impact on affordability. “Based on the trends observed in the April housing market, it certainly appears that the Bank of Canada is achieving its goal of slowing consumer spending as it fights high inflation. Negotiated mortgage rates rose sharply over the past four weeks, prompting some buyers to delay their purchase. Moving forward, it will be interesting to see the balance the Bank of Canada strikes between combatting inflation versus stunting economic growth and related government revenues as we continue to recover from and pay for pandemic-related programs,” said TRREB President Kevin Crigger. GTA REALTORS® reported 8,008 homes sold through TRREB’s MLS® System in April 2022 – a 41.2 per cent decrease compared to April 2021 and a 27 per cent decrease compared to March 2022. On a year-over-year basis, the decline in sales was greater in the ‘905’ area code regions surrounding Toronto, particularly for detached houses. The MLS® Home Price Index Composite Benchmark was up by 30.6 per cent year-over-year in April 2022. The benchmark level in April was down in comparison to the March level. The average selling price, at $1,254,436, was up by 15 per cent compared to April 2021, but down compared to the average selling price of $1,300,082 in March 2022. “Despite slower sales, market conditions remained tight enough to support higher selling prices compared to last year. However, in line with TRREB’s forecast, there is evidence of buyers responding to increased choice in the marketplace, with the average and benchmark prices dipping month-over-month. It is anticipated that there will be enough competition between buyers to support continued price growth relative to 2021, but the annual pace of growth will moderate in the coming months,” said TRREB Chief Market Analyst Jason Mercer. Sources and Notes: i - Statistics Canada, Quarter-over-quarter growth, annualized ii - Statistics Canada, Year-over-year growth for the most recently reported month iii - Bank of Canada, Rate from most recent Bank of Canada announcement iv - Bank of Canada, Rates for most recently completed month For All TRREB Member Inquiries: For All Media/Public Inquiries: (416) 443-8152 (416) 443-8158 April 2021 April 2022 8,008 13,613 Detached Semi-Detached Townhouse Condo Apt 868 2,732 3,600 1,947,975 1,526,791 1,628,343 311 491 802 1,494,640 1,110,142 1,259,243 335 1,033 1,368 1,086,986 997,416 1,019,350 1,488 685 2,173 820,835 722,601 789,869 Sales Average Price 416 905 Total 416 905 Total Home Type Year-Over-Year Per Cent Change April 2021 April 2022 $1,254,436 $1,090,414 Detached Semi-Detached Townhouse Condo Apt -34.0% -47.2% -44.5% 14.9% 16.8% 17.5% -35.7% -39.6% -38.2% 14.1% 19.9% 17.8% -41.6% -44.1% -43.5% 15.0% 20.0% 18.8% -34.5% -32.2% -33.8% 12.8% 18.0% 14.1% TRREB MLS® Sales Activity1,7 TRREB MLS® Average Price1,7 Sales & Average Price By Major Home Type1,7 Year-Over-Year Summary1,7 April 2022 1.00% April 2022 3.20% 1 Year 3.29% 3 Year 4.09% 5 Year 4.99% March 2022 6.7% March 2022 7.2% March 2022 7.8% Q4 2021 6.6% Real GDP Growth Toronto Employment Growth Toronto Unemployment Rate (SA) Inflation (Yr./Yr. CPI Growth) Bank of Canada Overnight Rate Prime Rate 1 Market Watch, April 2022 Copyright® 2021 Toronto Regional Real Estate Board April 2022 Mortgage Rates 2 3 1 5 5
  • 2. Toronto Regional Real Estate Board YEAR-TO-DATE, 2022 $0 to $99,999 $100,000 to $199,999 $200,000 to $299,999 $300,000 to $399,999 $400,000 to $499,999 $500,000 to $599,999 $600,000 to $699,999 $700,000 to $799,999 $800,000 to $899,999 $900,000 to $999,999 $1,000,000 to $1,249,999 $1,250,000 to $1,499,999 $1,500,000 to $1,749,999 $1,750,000 to $1,999,999 $2,000,000+ 1 0 0 0 2 0 0 0 0 3 0 0 0 0 0 0 0 0 0 0 0 0 0 0 7 0 0 0 0 7 6 0 0 0 13 0 2 0 1 22 6 1 0 3 51 0 4 0 0 65 11 1 1 21 275 0 1 0 1 311 29 7 5 56 617 0 0 1 4 719 74 28 28 125 539 2 0 2 2 800 143 46 91 164 275 6 1 0 0 726 248 110 191 152 150 8 1 1 0 861 644 285 209 83 117 13 0 2 0 1,353 775 188 125 28 59 7 1 0 0 1,183 587 71 49 13 22 2 1 0 0 745 363 30 9 3 20 0 0 2 0 427 712 35 8 4 26 0 0 0 0 785 Detached Semi-Detached Att/Row/Twnhouse Condo Townhouse Condo Apt Link Co-Op Apt Det Condo Co-Ownership Apt Total Name $0 to $99,999 $100,000 to $199,999 $200,000 to $299,999 $300,000 to $399,999 $400,000 to $499,999 $500,000 to $599,999 $600,000 to $699,999 $700,000 to $799,999 $800,000 to $899,999 $900,000 to $999,999 $1,000,000 to $1,249,999 $1,250,000 to $1,499,999 $1,500,000 to $1,749,999 $1,750,000 to $1,999,999 $2,000,000+ 1 0 0 0 5 0 0 0 0 6 0 0 0 0 4 0 0 0 0 4 1 0 0 1 23 0 0 0 0 25 10 0 2 2 50 0 5 0 5 74 21 1 0 8 267 0 11 0 12 320 28 1 4 58 1,097 0 3 0 5 1,196 79 10 7 177 2,692 1 6 1 8 2,981 204 51 46 392 2,613 4 3 2 3 3,318 376 122 179 594 1,453 14 2 1 1 2,742 707 260 569 708 760 23 3 7 0 3,037 2,120 939 1,019 513 628 44 0 10 0 5,273 3,198 1,041 800 138 251 57 1 6 0 5,492 2,822 317 251 47 95 24 1 3 1 3,561 1,699 106 65 16 62 4 0 3 0 1,955 3,342 128 46 12 93 0 0 0 0 3,621 Detached Semi-Detached Att/Row/Twnhouse Condo Townhouse Condo Apt Link Co-Op Apt Det Condo Co-Ownership Apt Total Name APRIL 2022 SALES BY PRICE RANGE AND HOUSE TYPE 1,7 SALES BY PRICE RANGE AND HOUSE TYPE 1,7 Total Sales Share of Total Sales (%) Average Price ($) 3,600 802 716 652 2,173 38 11 8 8 8,008 45.0% 10.0% 8.9% 8.1% 27.1% 0.5% 0.1% 0.1% 0.1% 100.0% $1,628,343 $1,259,243 $1,119,648 $909,207 $789,869 $1,076,579 $726,000 $1,103,375 $625,000 $1,254,436 14,610 2,976 2,989 2,666 10,095 171 35 33 35 33,610 43.5% 8.9% 8.9% 7.9% 30.0% 0.5% 0.1% 0.1% 0.1% 100.0% $1,713,945 $1,311,358 $1,203,724 $941,127 $790,247 $1,218,771 $634,940 $1,195,035 $565,062 $1,288,834 Total Sales Share of Total Sales (%) Average Price ($)
  • 3. TRREB Total 8,008 $10,045,524,994 $1,254,436 $1,098,000 18,413 68.0% 13,098 0.9 107% 11 14 Halton Region 824 $1,140,373,440 $1,383,948 $1,230,000 1,922 72.2% 1,273 0.7 104% 10 13 Burlington 291 $358,021,492 $1,230,314 $1,083,000 584 75.3% 358 0.6 106% 9 11 Halton Hills 89 $121,007,416 $1,359,634 $1,200,000 203 73.8% 129 0.7 106% 9 12 Milton 176 $207,889,389 $1,181,190 $1,139,950 469 70.6% 293 0.6 105% 10 14 Oakville 268 $453,455,143 $1,691,997 $1,572,500 666 70.3% 493 0.9 102% 11 15 Peel Region 1,535 $1,906,995,823 $1,242,343 $1,132,500 3,893 69.4% 2,564 0.8 106% 10 15 Brampton 716 $889,027,068 $1,241,658 $1,155,250 1,997 68.5% 1,285 0.7 106% 10 15 Caledon 99 $175,417,100 $1,771,890 $1,522,000 237 63.9% 178 1.2 103% 14 22 Mississauga 720 $842,551,655 $1,170,211 $1,028,500 1,659 71.1% 1,101 0.8 106% 10 13 City of Toronto 3,024 $3,759,044,412 $1,243,070 $980,000 6,164 65.4% 4,732 1.2 108% 12 15 Toronto West 847 $981,902,357 $1,159,271 $1,005,000 1,609 67.3% 1,151 1.1 109% 13 15 Toronto Central 1,411 $1,875,334,304 $1,329,082 $882,250 3,080 62.2% 2,679 1.4 105% 13 17 Toronto East 766 $901,807,751 $1,177,295 $1,123,500 1,475 71.0% 902 0.8 113% 9 11 York Region 1,230 $1,754,780,008 $1,426,650 $1,325,000 3,269 66.1% 2,665 1.1 105% 12 16 Aurora 76 $114,944,576 $1,512,429 $1,327,500 223 66.0% 196 1.0 106% 11 15 East Gwillimbury 50 $75,169,500 $1,503,390 $1,291,000 139 66.4% 114 1.0 104% 15 19 Georgina 69 $69,825,000 $1,011,957 $920,000 205 66.8% 152 1.0 106% 12 17 King 25 $51,541,850 $2,061,674 $2,012,850 84 61.7% 98 2.1 101% 16 17 Markham 293 $428,117,914 $1,461,153 $1,400,000 753 67.2% 597 1.0 106% 12 15 Newmarket 115 $145,696,300 $1,266,924 $1,205,000 256 73.9% 166 0.7 108% 9 14 Richmond Hill 198 $294,831,444 $1,489,048 $1,450,000 582 63.0% 525 1.3 106% 12 16 Vaughan 336 $481,640,015 $1,433,452 $1,346,500 854 65.7% 668 1.1 105% 11 17 Whitchurch-Stouffville 68 $93,013,409 $1,367,844 $1,257,500 173 64.6% 149 1.1 104% 11 15 Durham Region 1,089 $1,171,036,798 $1,075,332 $999,999 2,338 74.5% 1,278 0.6 114% 8 11 Ajax 152 $179,258,839 $1,179,334 $1,145,000 394 72.3% 207 0.5 114% 9 11 Brock 13 $11,143,910 $857,224 $875,000 51 69.2% 45 1.0 106% 13 15 Clarington 224 $230,183,125 $1,027,603 $950,000 406 75.3% 200 0.5 116% 7 10 Oshawa 296 $277,221,913 $936,561 $860,000 636 75.5% 367 0.6 116% 9 12 Pickering 123 $138,250,506 $1,123,988 $999,999 276 74.6% 159 0.6 113% 8 10 Scugog 32 $38,786,300 $1,212,072 $1,100,000 50 77.2% 30 0.9 111% 7 8 Uxbridge 33 $45,554,614 $1,380,443 $1,225,000 60 74.9% 32 0.9 110% 7 9 Whitby 216 $250,637,591 $1,160,359 $1,100,578 465 74.0% 238 0.5 114% 7 11 Dufferin County 64 $60,077,500 $938,711 $842,000 118 76.6% 66 0.5 104% 9 13 Orangeville 64 $60,077,500 $938,711 $842,000 118 76.6% 66 0.5 104% 9 13 Simcoe County 242 $253,217,013 $1,046,351 $970,000 709 66.7% 520 0.9 103% 12 15 Adjala-Tosorontio 14 $16,056,500 $1,146,893 $1,125,000 27 70.4% 22 1.2 103% 9 11 Bradford West Gwillimbury 43 $51,695,899 $1,202,230 $1,130,000 171 62.4% 128 0.9 102% 10 15 Essa 39 $35,806,900 $918,126 $860,000 96 68.0% 73 0.8 105% 12 16 Innisfil 72 $72,007,013 $1,000,097 $890,000 230 64.4% 165 1.1 103% 10 13 New Tecumseth 74 $77,650,701 $1,049,334 $975,000 185 72.2% 132 0.8 104% 14 17 Sub_Municipality # of Sales Dollar Volume Average Price Median Price New Listings SNLR (Trend) Active Listings Mos Inv (Trend) Avg. SP/LP Avg. LDOM Avg. PDOM Toronto Regional Real Estate Board SUMMARY OF EXISTING HOME TRANSACTIONS ALL TRREB AREAS ALL HOME TYPES, APRIL 2022 1 1 1 2 8 3 9 4 5 3 Market Watch, April 2022 Copyright® 2021 Toronto Regional Real Estate Board 5
  • 4. TRREB Total 8,008 $10,045,524,994 $1,254,436 $1,098,000 18,413 68.0% 13,098 0.9 107% 11 14 City of Toronto Total 3,024 $3,759,044,412 $1,243,070 $980,000 6,164 65.4% 4,732 1.2 108% 12 15 Toronto West 847 $981,902,357 $1,159,271 $1,005,000 1,609 67.3% 1,151 1.1 109% 13 15 Toronto W01 49 $64,106,918 $1,308,304 $960,000 86 67.1% 62 0.9 112% 8 11 Toronto W02 102 $153,467,312 $1,504,581 $1,365,000 163 67.5% 85 0.8 115% 11 13 Toronto W03 58 $65,203,994 $1,124,207 $1,100,500 110 65.4% 84 1.0 114% 9 12 Toronto W04 100 $104,480,670 $1,044,807 $950,000 148 64.8% 106 1.3 107% 14 16 Toronto W05 126 $118,795,025 $942,818 $926,500 252 69.5% 183 1.1 108% 11 13 Toronto W06 141 $144,399,979 $1,024,113 $850,000 297 62.4% 247 1.4 107% 16 21 Toronto W07 31 $51,048,005 $1,646,710 $1,505,000 53 69.1% 32 0.9 108% 9 10 Toronto W08 138 $181,976,838 $1,318,673 $885,000 276 71.3% 187 0.9 106% 16 17 Toronto W09 46 $50,343,642 $1,094,427 $954,000 88 68.4% 61 1.1 105% 14 15 Toronto W10 56 $48,079,974 $858,571 $750,000 136 69.2% 104 0.9 109% 12 14 Toronto Central 1,411 $1,875,334,304 $1,329,082 $882,250 3,080 62.2% 2,679 1.4 105% 13 17 Toronto C01 431 $420,170,060 $974,873 $786,000 894 63.6% 754 1.3 106% 12 16 Toronto C02 94 $177,339,815 $1,886,594 $1,339,750 202 55.8% 188 2.1 103% 14 22 Toronto C03 50 $96,899,335 $1,937,987 $1,670,000 115 56.7% 100 1.6 110% 11 17 Toronto C04 76 $195,790,868 $2,576,196 $2,300,000 117 66.7% 88 1.2 103% 12 16 Toronto C06 39 $42,418,611 $1,087,657 $775,000 75 61.0% 54 1.3 106% 13 17 Toronto C07 77 $95,824,847 $1,244,479 $960,000 200 61.8% 177 1.4 104% 12 16 Toronto C08 176 $162,087,262 $920,950 $776,000 464 59.1% 424 1.5 105% 12 17 Toronto C09 26 $61,454,388 $2,363,630 $2,118,500 53 63.2% 46 1.8 102% 26 28 Toronto C10 79 $96,782,799 $1,225,099 $921,000 167 64.0% 126 1.3 106% 13 17 Toronto C11 43 $78,699,004 $1,830,209 $1,600,000 81 68.9% 45 1.0 111% 11 12 Toronto C12 24 $96,391,000 $4,016,292 $3,582,000 61 50.7% 98 3.4 100% 16 34 Toronto C13 50 $68,184,624 $1,363,692 $906,850 104 67.4% 96 1.2 103% 19 22 Toronto C14 115 $137,957,814 $1,199,633 $818,000 260 61.9% 245 1.4 103% 13 17 Toronto C15 131 $145,333,877 $1,109,419 $872,000 287 65.0% 238 1.2 105% 13 18 Toronto East 766 $901,807,751 $1,177,295 $1,123,500 1,475 71.0% 902 0.8 113% 9 11 Toronto E01 83 $115,663,239 $1,393,533 $1,348,200 128 69.4% 58 0.7 114% 8 10 Toronto E02 78 $122,708,380 $1,573,184 $1,425,000 120 70.7% 46 0.7 115% 7 9 Toronto E03 99 $136,945,913 $1,383,292 $1,310,000 161 65.9% 79 0.9 118% 7 10 Toronto E04 82 $84,072,600 $1,025,276 $1,037,450 186 71.0% 113 0.7 115% 8 9 Toronto E05 69 $67,177,444 $973,586 $900,000 138 74.3% 108 0.8 107% 13 15 Toronto E06 36 $44,019,610 $1,222,767 $1,189,950 71 61.6% 40 1.0 110% 7 9 Toronto E07 63 $65,318,488 $1,036,801 $990,000 148 71.3% 119 0.8 110% 13 15 Toronto E08 60 $61,379,340 $1,022,989 $940,257 111 71.3% 80 0.9 111% 8 9 Toronto E09 76 $74,333,889 $978,077 $980,500 192 74.4% 126 0.7 113% 10 12 Toronto E10 51 $66,138,629 $1,296,836 $1,210,000 108 73.3% 58 0.7 112% 11 12 Toronto E11 69 $64,050,219 $928,264 $875,000 112 74.4% 75 0.7 114% 10 12 Municipality # of Sales Dollar Volume Average Price Median Price New Listings SNLR (Trend) Active Listings Mos Inv (Trend) Avg. SP/LP Avg. LDOM Avg. PDOM Toronto Regional Real Estate Board ALL HOME TYPES, APRIL 2022 SUMMARY OF EXISTING HOME TRANSACTIONS CITY OF TORONTO MUNICIPAL BREAKDOWN 1 1 1 2 8 3 9 4 5 4 Market Watch, April 2022 Copyright® 2021 Toronto Regional Real Estate Board 5
  • 5. TRREB Total 33,610 $43,317,702,308 $1,288,834 $1,150,000 60,608 112% 10 13 Halton Region 3,337 $4,946,943,862 $1,482,452 $1,336,500 6,020 111% 8 11 Burlington 1,055 $1,399,724,081 $1,326,753 $1,210,000 1,749 112% 8 10 Halton Hills 348 $487,317,823 $1,400,339 $1,250,000 595 112% 8 11 Milton 793 $1,019,402,945 $1,285,502 $1,243,000 1,538 114% 7 9 Oakville 1,141 $2,040,499,013 $1,788,343 $1,608,000 2,138 108% 10 12 Peel Region 6,658 $8,524,997,821 $1,280,414 $1,200,000 12,490 112% 8 10 Brampton 3,150 $4,145,115,821 $1,315,910 $1,257,000 6,408 112% 7 10 Caledon 367 $651,131,386 $1,774,200 $1,540,000 723 107% 11 16 Mississauga 3,141 $3,728,750,614 $1,187,122 $1,025,000 5,359 112% 8 11 City of Toronto 12,465 $14,913,801,967 $1,196,454 $940,000 20,712 111% 12 15 Toronto West 3,137 $3,542,291,715 $1,129,197 $999,999 5,129 112% 12 14 Toronto Central 6,294 $7,769,146,378 $1,234,373 $851,000 10,739 107% 14 18 Toronto East 3,034 $3,602,363,874 $1,187,332 $1,175,000 4,844 119% 9 10 York Region 5,720 $8,680,023,223 $1,517,487 $1,420,000 11,591 111% 10 13 Aurora 393 $623,416,759 $1,586,302 $1,485,000 824 112% 9 12 East Gwillimbury 243 $382,005,399 $1,572,039 $1,500,000 512 113% 10 13 Georgina 339 $368,573,699 $1,087,238 $1,050,000 677 115% 11 14 King 122 $312,224,331 $2,559,216 $2,344,000 269 100% 19 27 Markham 1,357 $2,011,696,072 $1,482,458 $1,430,000 2,758 113% 10 13 Newmarket 482 $657,179,617 $1,363,443 $1,302,400 906 114% 8 10 Richmond Hill 1,009 $1,576,534,822 $1,562,473 $1,500,000 2,124 112% 10 14 Vaughan 1,512 $2,318,183,904 $1,533,190 $1,450,000 2,949 109% 11 14 Whitchurch-Stouffville 263 $430,208,620 $1,635,774 $1,428,000 572 109% 11 13 Durham Region 4,200 $4,848,797,202 $1,154,476 $1,100,000 7,301 123% 7 9 Ajax 608 $746,275,268 $1,227,426 $1,180,000 1,162 124% 7 9 Brock 82 $87,053,710 $1,061,631 $925,000 153 112% 9 12 Clarington 774 $844,995,001 $1,091,725 $1,025,000 1,305 124% 7 8 Oshawa 1,213 $1,234,907,969 $1,018,061 $968,000 2,092 125% 7 9 Pickering 521 $639,573,843 $1,227,589 $1,150,000 870 121% 8 10 Scugog 94 $121,426,831 $1,291,775 $1,117,500 138 113% 11 15 Uxbridge 112 $164,678,109 $1,470,340 $1,285,000 166 112% 11 12 Whitby 796 $1,009,886,471 $1,268,702 $1,220,000 1,415 124% 6 8 Dufferin County 232 $232,899,283 $1,003,876 $961,000 379 112% 7 9 Orangeville 232 $232,899,283 $1,003,876 $961,000 379 112% 7 9 Simcoe County 998 $1,170,238,950 $1,172,584 $1,075,000 2,115 109% 10 13 Adjala-Tosorontio 49 $71,895,900 $1,467,263 $1,215,000 78 106% 13 15 Bradford West Gwillimbury 202 $277,597,736 $1,374,246 $1,294,000 528 111% 10 14 Essa 148 $146,291,075 $988,453 $925,000 302 110% 8 10 Innisfil 302 $337,784,321 $1,118,491 $1,040,000 651 108% 10 12 New Tecumseth 297 $336,669,918 $1,133,569 $1,022,000 556 108% 11 12 Sub_Municipality Number of Sales Dollar Volume Average Price Median Price New Listings Avg. SP/LP Avg. LDOM Avg. PDOM Toronto Regional Real Estate Board SUMMARY OF EXISTING HOME TRANSACTIONS ALL TRREB AREAS ALL HOME TYPES, YEAR-TO-DATE 2022 1 1 1 2 4 5 5 Market Watch, April 2022 Copyright® 2021 Toronto Regional Real Estate Board 5
  • 6. TRREB Total 33,610 $43,317,702,308 $1,288,834 $1,150,000 60,608 112% 10 13 City of Toronto Total 12,465 $14,913,801,967 $1,196,454 $940,000 20,712 111% 12 15 Toronto West 3,137 $3,542,291,715 $1,129,197 $999,999 5,129 112% 12 14 Toronto W01 215 $302,074,724 $1,404,999 $1,030,000 331 114% 10 13 Toronto W02 337 $455,377,298 $1,351,268 $1,300,000 497 117% 10 13 Toronto W03 208 $237,802,025 $1,143,279 $1,177,500 359 118% 9 12 Toronto W04 326 $332,445,813 $1,019,772 $930,000 498 111% 13 16 Toronto W05 422 $397,530,100 $942,014 $934,000 734 112% 11 13 Toronto W06 535 $551,554,170 $1,030,942 $880,000 956 109% 15 18 Toronto W07 101 $171,121,466 $1,694,272 $1,600,000 152 113% 10 11 Toronto W08 556 $668,036,284 $1,201,504 $830,000 880 110% 11 13 Toronto W09 170 $178,568,063 $1,050,400 $977,000 263 111% 13 16 Toronto W10 267 $247,781,772 $928,022 $810,000 459 113% 9 11 Toronto Central 6,294 $7,769,146,378 $1,234,373 $851,000 10,739 107% 14 18 Toronto C01 1,978 $1,856,361,714 $938,504 $787,750 3,230 108% 14 18 Toronto C02 341 $623,237,108 $1,827,675 $1,400,888 640 104% 16 24 Toronto C03 210 $406,200,274 $1,934,287 $1,510,000 380 108% 12 17 Toronto C04 261 $638,436,171 $2,446,116 $2,300,000 428 106% 12 17 Toronto C06 150 $165,690,435 $1,104,603 $806,250 261 110% 14 17 Toronto C07 368 $474,447,149 $1,289,259 $931,000 673 108% 12 15 Toronto C08 966 $839,167,286 $868,703 $756,000 1,627 107% 15 20 Toronto C09 104 $208,936,433 $2,009,004 $1,412,500 175 104% 24 29 Toronto C10 296 $344,485,918 $1,163,804 $875,700 520 109% 11 15 Toronto C11 159 $206,350,101 $1,297,799 $765,000 246 111% 11 12 Toronto C12 114 $438,059,864 $3,842,630 $3,229,000 240 100% 21 37 Toronto C13 248 $334,920,470 $1,350,486 $975,000 392 108% 14 19 Toronto C14 495 $602,767,153 $1,217,711 $840,000 931 108% 12 17 Toronto C15 604 $630,086,302 $1,043,189 $832,500 996 111% 14 16 Toronto East 3,034 $3,602,363,874 $1,187,332 $1,175,000 4,844 119% 9 10 Toronto E01 295 $402,660,614 $1,364,951 $1,354,000 428 122% 7 9 Toronto E02 253 $402,380,120 $1,590,435 $1,500,000 355 116% 8 10 Toronto E03 346 $470,862,059 $1,360,873 $1,300,000 530 120% 10 13 Toronto E04 347 $365,829,915 $1,054,265 $1,100,000 564 119% 7 9 Toronto E05 307 $327,261,769 $1,065,999 $940,000 503 118% 10 11 Toronto E06 143 $186,529,464 $1,304,402 $1,200,000 235 113% 9 12 Toronto E07 253 $267,122,878 $1,055,822 $1,030,000 477 120% 8 10 Toronto E08 253 $281,496,180 $1,112,633 $1,110,000 382 116% 10 11 Toronto E09 313 $311,560,763 $995,402 $900,000 576 121% 7 9 Toronto E10 236 $299,068,703 $1,267,240 $1,290,000 361 121% 9 10 Toronto E11 288 $287,591,409 $998,581 $944,000 433 119% 9 10 Municipality Number of Sales Dollar Volume Average Price Median Price New Listings Avg. SP/LP Avg. LDOM Avg. PDOM Toronto Regional Real Estate Board SUMMARY OF EXISTING HOME TRANSACTIONS CITY OF TORONTO MUNICIPAL BREAKDOWN ALL HOME TYPES, YEAR-TO-DATE 2022 1 1 1 2 4 5 6 Market Watch, April 2022 Copyright® 2021 Toronto Regional Real Estate Board 5
  • 7. TRREB Total 3,600 $5,862,033,851 $1,628,343 $1,445,000 8,629 6,151 106% 10 Halton Region 428 $761,819,188 $1,779,951 $1,630,000 1,032 704 103% 10 Burlington 131 $218,759,944 $1,669,923 $1,550,000 302 195 105% 8 Halton Hills 72 $105,442,400 $1,464,478 $1,334,000 159 99 106% 9 Milton 68 $100,538,864 $1,478,513 $1,423,000 211 142 104% 11 Oakville 157 $337,077,980 $2,146,994 $1,930,000 360 268 101% 11 Peel Region 680 $1,105,699,985 $1,626,029 $1,475,000 1,792 1,217 104% 11 Brampton 368 $542,787,923 $1,474,967 $1,400,000 1,080 691 104% 10 Caledon 83 $157,729,100 $1,900,351 $1,700,000 168 137 103% 15 Mississauga 229 $405,182,962 $1,769,358 $1,560,000 544 389 104% 10 City of Toronto 868 $1,690,842,132 $1,947,975 $1,560,935 1,725 1,303 107% 11 Toronto West 287 $489,043,518 $1,703,984 $1,500,000 556 384 108% 11 Toronto Central 253 $716,268,466 $2,831,101 $2,366,000 514 542 103% 14 Toronto East 328 $485,530,148 $1,480,275 $1,347,250 655 377 114% 8 York Region 673 $1,185,714,266 $1,761,834 $1,675,000 1,852 1,598 104% 12 Aurora 41 $77,536,776 $1,891,141 $1,720,000 131 133 105% 11 East Gwillimbury 44 $68,911,500 $1,566,170 $1,420,000 115 99 105% 15 Georgina 65 $67,059,000 $1,031,677 $950,000 189 137 106% 12 King 18 $43,630,850 $2,423,936 $2,281,500 75 93 100% 19 Markham 136 $263,655,612 $1,938,644 $1,788,000 342 291 104% 12 Newmarket 79 $110,014,000 $1,392,582 $1,340,000 163 108 106% 10 Richmond Hill 93 $187,303,291 $2,014,014 $1,865,800 314 314 105% 13 Vaughan 155 $300,058,518 $1,935,861 $1,825,000 414 320 104% 11 Whitchurch-Stouffville 42 $67,544,719 $1,608,208 $1,500,000 109 103 103% 11 Durham Region 735 $876,167,954 $1,192,065 $1,150,000 1,592 862 114% 8 Ajax 109 $138,724,530 $1,272,702 $1,249,900 261 128 112% 9 Brock 12 $10,268,910 $855,743 $862,500 48 44 106% 13 Clarington 162 $180,600,689 $1,114,819 $1,010,000 316 158 115% 7 Oshawa 200 $208,879,971 $1,044,400 $975,000 426 236 116% 8 Pickering 53 $77,509,752 $1,462,448 $1,325,000 131 86 114% 7 Scugog 32 $38,786,300 $1,212,072 $1,100,000 50 30 111% 7 Uxbridge 28 $41,509,510 $1,482,483 $1,330,000 47 26 109% 7 Whitby 139 $179,888,292 $1,294,160 $1,240,000 313 154 113% 7 Dufferin County 36 $39,862,500 $1,107,292 $990,000 67 39 105% 8 Orangeville 36 $39,862,500 $1,107,292 $990,000 67 39 105% 8 Simcoe County 180 $201,927,826 $1,121,821 $1,047,500 569 428 103% 12 Adjala-Tosorontio 14 $16,056,500 $1,146,893 $1,125,000 27 22 103% 9 Bradford West Gwillimbury 28 $37,354,900 $1,334,104 $1,375,000 134 111 102% 10 Essa 27 $26,314,500 $974,611 $955,000 77 60 105% 11 Innisfil 59 $61,947,013 $1,049,949 $930,000 194 136 102% 10 New Tecumseth 52 $60,254,913 $1,158,748 $1,062,500 137 99 104% 17 Municipality Number of Sales Dollar Volume Average Price Median Price New Listings Active Listings Avg. SP/LP Avg. LDOM DETACHED, APRIL 2022 Toronto Regional Real Estate Board SUMMARY OF EXISTING HOME TRANSACTIONS ALL TRREB AREAS 1 1 2 4 5 1 1 3 7 Market Watch, April 2022 Copyright® 2021 Toronto Regional Real Estate Board
  • 8. TRREB Total 3,600 $5,862,033,851 $1,628,343 $1,445,000 8,629 6,151 106% 10 City of Toronto 868 $1,690,842,132 $1,947,975 $1,560,935 1,725 1,303 107% 11 Toronto West 287 $489,043,518 $1,703,984 $1,500,000 556 384 108% 11 Toronto W01 10 $24,148,818 $2,414,882 $2,285,000 15 10 113% 7 Toronto W02 30 $66,718,134 $2,223,938 $1,848,521 58 33 117% 6 Toronto W03 20 $24,607,400 $1,230,370 $1,175,000 56 53 112% 8 Toronto W04 50 $67,102,542 $1,342,051 $1,265,000 71 53 106% 11 Toronto W05 26 $37,651,776 $1,448,145 $1,343,944 47 30 109% 9 Toronto W06 30 $49,045,887 $1,634,863 $1,495,500 70 46 107% 7 Toronto W07 25 $44,224,005 $1,768,960 $1,620,000 41 22 108% 9 Toronto W08 56 $118,503,100 $2,116,127 $1,962,500 107 75 105% 20 Toronto W09 21 $33,623,368 $1,601,113 $1,482,000 38 19 105% 10 Toronto W10 19 $23,418,488 $1,232,552 $1,215,000 53 43 111% 9 Toronto Central 253 $716,268,466 $2,831,101 $2,366,000 514 542 103% 14 Toronto C01 8 $20,597,800 $2,574,725 $2,401,400 15 11 103% 7 Toronto C02 11 $40,046,000 $3,640,545 $2,363,000 29 22 100% 16 Toronto C03 26 $69,160,011 $2,660,000 $2,187,500 52 42 113% 7 Toronto C04 52 $158,813,050 $3,054,097 $2,500,500 81 57 102% 12 Toronto C06 13 $24,409,111 $1,877,624 $1,600,000 27 24 103% 22 Toronto C07 26 $51,063,099 $1,963,965 $1,772,000 66 75 102% 17 Toronto C08 3 $7,690,000 $2,563,333 $2,750,000 4 5 103% 29 Toronto C09 11 $38,509,388 $3,500,853 $3,690,000 20 13 103% 19 Toronto C10 8 $20,725,503 $2,590,688 $2,310,000 17 16 100% 9 Toronto C11 15 $48,881,016 $3,258,734 $2,951,016 20 4 113% 5 Toronto C12 17 $84,131,000 $4,948,882 $4,150,000 39 78 100% 19 Toronto C13 13 $36,108,800 $2,777,600 $1,900,000 34 44 101% 26 Toronto C14 26 $64,552,800 $2,482,800 $2,268,000 64 96 101% 16 Toronto C15 24 $51,580,888 $2,149,204 $1,835,000 46 55 100% 14 Toronto East 328 $485,530,148 $1,480,275 $1,347,250 655 377 114% 8 Toronto E01 17 $30,901,961 $1,817,762 $1,741,800 30 14 114% 9 Toronto E02 28 $58,050,342 $2,073,227 $1,998,000 41 12 114% 6 Toronto E03 55 $84,183,230 $1,530,604 $1,350,000 104 56 119% 7 Toronto E04 42 $52,748,800 $1,255,924 $1,250,000 95 55 117% 7 Toronto E05 20 $28,783,400 $1,439,170 $1,390,000 53 38 107% 12 Toronto E06 29 $38,324,510 $1,321,535 $1,260,000 51 24 110% 8 Toronto E07 26 $36,692,888 $1,411,265 $1,419,000 51 40 109% 14 Toronto E08 24 $34,919,988 $1,455,000 $1,366,000 45 33 111% 7 Toronto E09 41 $51,180,899 $1,248,315 $1,200,000 90 49 116% 9 Toronto E10 32 $50,361,130 $1,573,785 $1,455,000 69 36 112% 7 Toronto E11 14 $19,383,000 $1,384,500 $1,450,000 26 20 114% 11 Municipality Number of Sales Dollar Volume Average Price Median Price New Listings Active Listings Avg. SP/LP Avg. LDOM DETACHED, APRIL 2022 Toronto Regional Real Estate Board SUMMARY OF EXISTING HOME TRANSACTIONS CITY OF TORONTO MUNICIPAL BREAKDOWN 1 1 2 4 5 1 1 3 8 Market Watch, April 2022 Copyright® 2021 Toronto Regional Real Estate Board
  • 9. TRREB Total 802 $1,009,912,607 $1,259,243 $1,180,000 1,714 1,006 111% 9 Halton Region 48 $52,783,108 $1,099,648 $1,100,000 107 65 107% 11 Burlington 19 $19,525,309 $1,027,648 $975,309 34 17 108% 9 Halton Hills 3 $2,515,000 $838,333 $900,000 3 3 111% 7 Milton 17 $19,936,799 $1,172,753 $1,185,000 46 30 108% 10 Oakville 9 $10,806,000 $1,200,667 $1,141,000 24 15 103% 14 Peel Region 270 $309,136,317 $1,144,949 $1,145,000 636 368 108% 9 Brampton 155 $173,976,314 $1,122,428 $1,125,000 376 220 109% 10 Caledon 4 $4,781,000 $1,195,250 $1,178,000 26 17 104% 7 Mississauga 111 $130,379,003 $1,174,586 $1,160,000 234 131 108% 9 City of Toronto 311 $464,832,970 $1,494,640 $1,350,000 553 326 112% 9 Toronto West 110 $142,259,459 $1,293,268 $1,270,000 195 108 112% 9 Toronto Central 91 $170,059,045 $1,868,781 $1,610,000 175 132 109% 10 Toronto East 110 $152,514,466 $1,386,495 $1,310,000 183 86 117% 7 York Region 85 $107,044,464 $1,259,347 $1,250,000 248 162 110% 10 Aurora 5 $5,335,000 $1,067,000 $1,070,000 15 9 101% 8 East Gwillimbury 2 $2,500,000 $1,250,000 $1,250,000 8 6 104% 12 Georgina 0 $0 $0 - 7 4 - - King 0 $0 $0 - 0 0 - - Markham 19 $25,974,600 $1,367,084 $1,300,000 62 40 113% 9 Newmarket 12 $12,790,000 $1,065,833 $1,070,000 36 22 114% 7 Richmond Hill 13 $18,289,665 $1,406,897 $1,388,000 45 32 111% 10 Vaughan 27 $34,090,199 $1,262,600 $1,265,000 61 39 107% 13 Whitchurch-Stouffville 7 $8,065,000 $1,152,143 $1,160,000 14 10 111% 8 Durham Region 65 $56,594,761 $870,689 $825,000 137 70 118% 7 Ajax 7 $7,382,038 $1,054,577 $1,000,000 22 15 125% 5 Brock 1 $875,000 $875,000 $875,000 0 0 105% 7 Clarington 8 $6,439,000 $804,875 $820,000 11 5 122% 4 Oshawa 37 $28,704,723 $775,803 $770,000 72 31 119% 7 Pickering 7 $7,479,000 $1,068,429 $1,075,000 18 9 113% 6 Scugog 0 $0 $0 - 0 0 - - Uxbridge 0 $0 $0 - 1 1 - - Whitby 5 $5,715,000 $1,143,000 $1,190,000 13 9 108% 10 Dufferin County 10 $7,535,000 $753,500 $796,500 8 3 102% 11 Orangeville 10 $7,535,000 $753,500 $796,500 8 3 102% 11 Simcoe County 13 $11,985,987 $921,999 $850,000 25 12 106% 13 Adjala-Tosorontio 0 $0 $0 - 0 0 - - Bradford West Gwillimbury 7 $7,171,999 $1,024,571 $1,085,000 11 3 106% 9 Essa 3 $2,254,000 $751,333 $750,000 2 1 106% 23 Innisfil 0 $0 $0 - 0 0 - - New Tecumseth 3 $2,559,988 $853,329 $850,000 12 8 103% 9 Municipality Number of Sales Dollar Volume Average Price Median Price New Listings Active Listings Avg. SP/LP Avg. LDOM SEMI-DETACHED, APRIL 2022 Toronto Regional Real Estate Board SUMMARY OF EXISTING HOME TRANSACTIONS ALL TRREB AREAS 1 1 2 4 5 1 1 3 9 Market Watch, April 2022 Copyright® 2021 Toronto Regional Real Estate Board
  • 10. TRREB Total 802 $1,009,912,607 $1,259,243 $1,180,000 1,714 1,006 111% 9 City of Toronto 311 $464,832,970 $1,494,640 $1,350,000 553 326 112% 9 Toronto West 110 $142,259,459 $1,293,268 $1,270,000 195 108 112% 9 Toronto W01 7 $11,330,000 $1,618,571 $1,700,000 13 10 115% 12 Toronto W02 28 $42,640,500 $1,522,875 $1,542,500 43 17 114% 7 Toronto W03 25 $30,205,694 $1,208,228 $1,300,000 32 20 115% 10 Toronto W04 7 $7,668,111 $1,095,444 $1,135,000 9 6 112% 16 Toronto W05 34 $37,331,999 $1,098,000 $1,090,000 72 40 107% 9 Toronto W06 6 $8,403,155 $1,400,526 $1,331,578 18 11 109% 8 Toronto W07 1 $1,305,000 $1,305,000 $1,305,000 0 0 145% 8 Toronto W08 2 $3,375,000 $1,687,500 $1,687,500 5 2 102% 5 Toronto W09 0 $0 $0 - 2 1 - - Toronto W10 0 $0 $0 - 1 1 - - Toronto Central 91 $170,059,045 $1,868,781 $1,610,000 175 132 109% 10 Toronto C01 23 $43,155,339 $1,876,319 $1,788,888 45 41 109% 11 Toronto C02 10 $30,511,000 $3,051,100 $2,850,000 24 15 103% 11 Toronto C03 5 $8,618,818 $1,723,764 $1,650,000 20 14 111% 6 Toronto C04 6 $10,875,000 $1,812,500 $1,860,000 9 6 114% 9 Toronto C06 0 $0 $0 - 1 1 - - Toronto C07 7 $8,907,000 $1,272,429 $1,200,000 10 8 106% 7 Toronto C08 1 $1,750,000 $1,750,000 $1,750,000 6 12 109% 1 Toronto C09 3 $8,980,000 $2,993,333 $2,895,000 3 3 103% 7 Toronto C10 9 $18,765,000 $2,085,000 $1,950,000 14 7 112% 6 Toronto C11 8 $14,201,000 $1,775,125 $1,801,500 8 3 114% 14 Toronto C12 1 $1,300,000 $1,300,000 $1,300,000 2 1 108% 6 Toronto C13 7 $8,996,888 $1,285,270 $1,173,888 12 8 107% 9 Toronto C14 0 $0 $0 - 0 0 - - Toronto C15 11 $13,999,000 $1,272,636 $1,251,000 21 13 109% 11 Toronto East 110 $152,514,466 $1,386,495 $1,310,000 183 86 117% 7 Toronto E01 32 $47,637,228 $1,488,663 $1,442,500 54 21 115% 6 Toronto E02 24 $36,276,042 $1,511,502 $1,501,001 35 14 122% 7 Toronto E03 27 $40,058,183 $1,483,636 $1,508,000 31 9 121% 6 Toronto E04 4 $4,203,000 $1,050,750 $1,027,500 16 10 107% 10 Toronto E05 4 $4,623,000 $1,155,750 $1,150,000 10 8 111% 14 Toronto E06 0 $0 $0 - 3 2 - - Toronto E07 3 $3,228,000 $1,076,000 $1,098,000 7 7 112% 13 Toronto E08 5 $5,145,513 $1,029,103 $1,035,000 3 0 108% 13 Toronto E09 1 $1,020,000 $1,020,000 $1,020,000 6 4 93% 19 Toronto E10 7 $6,963,500 $994,786 $980,000 9 3 122% 5 Toronto E11 3 $3,360,000 $1,120,000 $1,100,000 9 8 114% 3 Municipality Number of Sales Dollar Volume Average Price Median Price New Listings Active Listings Avg. SP/LP Avg. LDOM SEMI-DETACHED, APRIL 2022 Toronto Regional Real Estate Board SUMMARY OF EXISTING HOME TRANSACTIONS CITY OF TORONTO MUNICIPAL BREAKDOWN 1 1 2 4 5 1 1 3 10 Market Watch, April 2022 Copyright® 2021 Toronto Regional Real Estate Board
  • 11. TRREB Total 716 $801,667,897 $1,119,648 $1,047,500 1,755 1,127 109% 10 Halton Region 139 $153,154,332 $1,101,830 $1,050,000 330 189 106% 9 Burlington 26 $27,904,499 $1,073,250 $1,032,500 46 19 108% 7 Halton Hills 4 $5,150,000 $1,287,500 $1,295,000 24 16 106% 14 Milton 70 $71,536,740 $1,021,953 $999,999 145 77 105% 9 Oakville 39 $48,563,093 $1,245,208 $1,250,000 115 77 106% 9 Peel Region 125 $130,065,995 $1,040,528 $999,999 359 241 107% 10 Brampton 98 $98,932,495 $1,009,515 $992,000 258 180 107% 11 Caledon 10 $11,152,500 $1,115,250 $1,100,000 39 23 106% 10 Mississauga 17 $19,981,000 $1,175,353 $1,155,000 62 38 109% 9 City of Toronto 115 $154,725,929 $1,345,443 $1,300,000 190 119 110% 12 Toronto West 30 $37,447,200 $1,248,240 $1,302,600 57 33 108% 15 Toronto Central 37 $61,660,042 $1,666,488 $1,625,000 66 52 107% 13 Toronto East 48 $55,618,687 $1,158,723 $1,042,500 67 34 115% 9 York Region 163 $206,241,417 $1,265,285 $1,270,000 456 329 108% 11 Aurora 13 $14,982,000 $1,152,462 $1,100,000 48 34 115% 9 East Gwillimbury 4 $3,758,000 $939,500 $919,500 16 9 101% 12 Georgina 2 $1,725,000 $862,500 $862,500 8 6 105% 6 King 4 $5,631,000 $1,407,750 $1,550,000 4 2 103% 8 Markham 46 $58,994,939 $1,282,499 $1,277,500 94 75 108% 13 Newmarket 9 $9,912,800 $1,101,422 $1,150,000 25 23 114% 9 Richmond Hill 30 $40,518,188 $1,350,606 $1,360,000 86 68 109% 10 Vaughan 46 $61,030,600 $1,326,752 $1,312,500 146 91 106% 10 Whitchurch-Stouffville 9 $9,688,890 $1,076,543 $1,075,000 29 21 103% 13 Durham Region 132 $122,627,824 $928,999 $918,000 307 182 117% 9 Ajax 24 $23,784,499 $991,021 $965,500 69 40 118% 8 Brock 0 $0 $0 - 0 0 - - Clarington 31 $25,972,436 $837,821 $839,938 43 18 120% 9 Oshawa 14 $12,013,999 $858,143 $860,000 48 43 119% 12 Pickering 18 $18,291,154 $1,016,175 $994,500 48 24 112% 8 Scugog 0 $0 $0 - 0 0 - - Uxbridge 2 $1,930,000 $965,000 $965,000 6 2 121% 8 Whitby 43 $40,635,736 $945,017 $931,000 93 55 115% 9 Dufferin County 11 $9,130,000 $830,000 $825,000 34 17 105% 9 Orangeville 11 $9,130,000 $830,000 $825,000 34 17 105% 9 Simcoe County 31 $25,722,400 $829,755 $840,000 79 50 106% 9 Adjala-Tosorontio 0 $0 $0 - 0 0 - - Bradford West Gwillimbury 6 $5,836,000 $972,667 $973,000 19 10 100% 12 Essa 5 $3,878,400 $775,680 $777,000 13 10 109% 8 Innisfil 11 $8,440,000 $767,273 $740,000 27 17 107% 8 New Tecumseth 9 $7,568,000 $840,889 $875,000 20 13 106% 8 Municipality Number of Sales Dollar Volume Average Price Median Price New Listings Active Listings Avg. SP/LP Avg. LDOM ATT/ROW/TWNHOUSE, APRIL 2022 Toronto Regional Real Estate Board SUMMARY OF EXISTING HOME TRANSACTIONS ALL TRREB AREAS 1 1 2 4 5 1 1 3 11 Market Watch, April 2022 Copyright® 2021 Toronto Regional Real Estate Board
  • 12. TRREB Total 716 $801,667,897 $1,119,648 $1,047,500 1,755 1,127 109% 10 City of Toronto 115 $154,725,929 $1,345,443 $1,300,000 190 119 110% 12 Toronto West 30 $37,447,200 $1,248,240 $1,302,600 57 33 108% 15 Toronto W01 2 $2,860,000 $1,430,000 $1,430,000 2 1 98% 2 Toronto W02 7 $8,793,200 $1,256,171 $1,305,200 8 4 108% 38 Toronto W03 4 $4,175,000 $1,043,750 $1,100,000 1 0 120% 8 Toronto W04 1 $1,350,000 $1,350,000 $1,350,000 6 3 100% 6 Toronto W05 4 $4,114,500 $1,028,625 $1,058,500 17 12 108% 8 Toronto W06 5 $6,906,500 $1,381,300 $1,370,500 8 5 107% 10 Toronto W07 2 $2,850,000 $1,425,000 $1,425,000 3 2 102% 9 Toronto W08 1 $1,548,000 $1,548,000 $1,548,000 5 2 129% 6 Toronto W09 3 $3,800,000 $1,266,667 $1,450,000 2 1 114% 9 Toronto W10 1 $1,050,000 $1,050,000 $1,050,000 5 3 95% 4 Toronto Central 37 $61,660,042 $1,666,488 $1,625,000 66 52 107% 13 Toronto C01 14 $21,135,154 $1,509,654 $1,581,500 18 15 111% 8 Toronto C02 7 $16,399,000 $2,342,714 $2,420,000 9 7 108% 6 Toronto C03 1 $1,038,000 $1,038,000 $1,038,000 0 2 88% 85 Toronto C04 0 $0 $0 - 1 2 - - Toronto C06 0 $0 $0 - 0 1 - - Toronto C07 2 $3,068,800 $1,534,400 $1,534,400 10 6 119% 8 Toronto C08 8 $11,846,088 $1,480,761 $1,459,044 13 9 106% 12 Toronto C09 0 $0 $0 - 0 0 - - Toronto C10 1 $1,460,000 $1,460,000 $1,460,000 1 0 98% 40 Toronto C11 2 $3,388,000 $1,694,000 $1,694,000 0 0 96% 30 Toronto C12 0 $0 $0 - 1 1 - - Toronto C13 0 $0 $0 - 4 3 - - Toronto C14 2 $3,325,000 $1,662,500 $1,662,500 9 6 95% 19 Toronto C15 0 $0 $0 - 0 0 - - Toronto East 48 $55,618,687 $1,158,723 $1,042,500 67 34 115% 9 Toronto E01 11 $15,886,000 $1,444,182 $1,425,000 10 4 118% 10 Toronto E02 5 $6,625,000 $1,325,000 $1,305,000 6 2 110% 12 Toronto E03 2 $3,166,000 $1,583,000 $1,583,000 2 1 144% 3 Toronto E04 4 $5,125,000 $1,281,250 $1,277,500 12 9 120% 4 Toronto E05 0 $0 $0 - 0 0 - - Toronto E06 1 $895,000 $895,000 $895,000 1 0 112% 9 Toronto E07 5 $4,806,800 $961,360 $970,000 5 2 115% 12 Toronto E08 2 $1,881,000 $940,500 $940,500 7 6 105% 6 Toronto E09 0 $0 $0 - 1 0 - - Toronto E10 4 $3,854,999 $963,750 $970,000 8 4 100% 12 Toronto E11 14 $13,378,888 $955,635 $931,000 15 6 114% 9 Municipality Number of Sales Dollar Volume Average Price Median Price New Listings Active Listings Avg. SP/LP Avg. LDOM ATT/ROW/TWNHOUSE, APRIL 2022 Toronto Regional Real Estate Board SUMMARY OF EXISTING HOME TRANSACTIONS CITY OF TORONTO MUNICIPAL BREAKDOWN 1 1 2 4 5 1 1 3 12 Market Watch, April 2022 Copyright® 2021 Toronto Regional Real Estate Board
  • 13. TRREB Total 652 $592,802,778 $909,207 $870,000 1,446 944 109% 10 Halton Region 85 $76,792,871 $903,446 $850,016 172 98 107% 10 Burlington 46 $41,350,508 $898,924 $880,000 81 44 108% 9 Halton Hills 10 $7,900,016 $790,002 $822,500 15 8 107% 13 Milton 6 $4,942,700 $823,783 $842,500 19 11 116% 6 Oakville 23 $22,599,647 $982,593 $850,000 57 35 102% 12 Peel Region 200 $179,088,531 $895,443 $889,500 468 292 108% 11 Brampton 58 $48,337,836 $833,411 $808,500 167 107 107% 11 Caledon 1 $844,500 $844,500 $844,500 3 1 99% 8 Mississauga 141 $129,906,195 $921,321 $924,800 298 184 108% 10 City of Toronto 220 $209,414,355 $951,883 $885,000 445 329 110% 11 Toronto West 90 $77,366,882 $859,632 $840,000 146 96 110% 12 Toronto Central 65 $77,433,069 $1,191,278 $950,000 173 143 109% 9 Toronto East 65 $54,614,404 $840,222 $840,000 126 90 112% 10 York Region 64 $63,608,300 $993,880 $920,000 179 123 108% 11 Aurora 9 $9,654,800 $1,072,756 $947,000 18 16 102% 16 East Gwillimbury 0 $0 $0 - 0 0 - - Georgina 1 $530,000 $530,000 $530,000 0 0 99% 30 King 0 $0 $0 - 0 0 - - Markham 23 $23,515,111 $1,022,396 $920,000 77 54 109% 11 Newmarket 9 $8,432,400 $936,933 $920,000 25 11 109% 9 Richmond Hill 5 $6,688,000 $1,337,600 $1,300,000 14 9 115% 12 Vaughan 12 $10,856,989 $904,749 $885,000 38 29 105% 10 Whitchurch-Stouffville 5 $3,931,000 $786,200 $792,000 7 4 112% 4 Durham Region 79 $61,138,821 $773,909 $787,500 173 94 116% 9 Ajax 3 $2,682,500 $894,167 $900,000 21 12 118% 8 Brock 0 $0 $0 - 3 1 - - Clarington 4 $3,508,000 $877,000 $741,500 8 3 107% 13 Oshawa 27 $18,169,720 $672,953 $660,000 63 40 119% 10 Pickering 26 $21,480,601 $826,177 $805,000 46 26 113% 9 Scugog 0 $0 $0 - 0 0 - - Uxbridge 2 $1,404,000 $702,000 $702,000 4 2 111% 6 Whitby 17 $13,894,000 $817,294 $820,000 28 10 121% 7 Dufferin County 3 $2,080,000 $693,333 $700,000 6 5 106% 11 Orangeville 3 $2,080,000 $693,333 $700,000 6 5 106% 11 Simcoe County 1 $679,900 $679,900 $679,900 3 3 117% 5 Adjala-Tosorontio 0 $0 $0 - 0 0 - - Bradford West Gwillimbury 0 $0 $0 - 0 0 - - Essa 0 $0 $0 - 0 0 - - Innisfil 0 $0 $0 - 0 1 - - New Tecumseth 1 $679,900 $679,900 $679,900 3 2 117% 5 Municipality Number of Sales Dollar Volume Average Price Median Price New Listings Active Listings Avg. SP/LP Avg. LDOM CONDO TOWNHOUSE, APRIL 2022 Toronto Regional Real Estate Board SUMMARY OF EXISTING HOME TRANSACTIONS ALL TRREB AREAS 1 1 2 4 5 1 1 3 13 Market Watch, April 2022 Copyright® 2021 Toronto Regional Real Estate Board
  • 14. TRREB Total 652 $592,802,778 $909,207 $870,000 1,446 944 109% 10 City of Toronto 220 $209,414,355 $951,883 $885,000 445 329 110% 11 Toronto West 90 $77,366,882 $859,632 $840,000 146 96 110% 12 Toronto W01 5 $4,030,000 $806,000 $775,000 5 4 111% 4 Toronto W02 19 $19,571,998 $1,030,105 $999,999 23 9 116% 11 Toronto W03 0 $0 $0 - 3 3 - - Toronto W04 11 $8,399,999 $763,636 $740,000 12 4 106% 24 Toronto W05 26 $19,482,250 $749,317 $737,500 49 28 111% 10 Toronto W06 10 $10,052,110 $1,005,211 $1,062,000 24 22 104% 7 Toronto W07 0 $0 $0 - 0 0 - - Toronto W08 10 $8,638,500 $863,850 $867,500 16 15 101% 13 Toronto W09 1 $1,000,025 $1,000,025 $1,000,025 8 7 118% 10 Toronto W10 8 $6,192,000 $774,000 $785,000 6 4 115% 12 Toronto Central 65 $77,433,069 $1,191,278 $950,000 173 143 109% 9 Toronto C01 16 $19,016,600 $1,188,538 $945,000 33 28 108% 10 Toronto C02 5 $9,973,000 $1,994,600 $1,788,000 6 6 100% 11 Toronto C03 0 $0 $0 - 0 1 - - Toronto C04 2 $2,410,018 $1,205,009 $1,205,009 2 1 115% 7 Toronto C06 0 $0 $0 - 0 0 - - Toronto C07 4 $4,110,000 $1,027,500 $965,000 14 14 109% 9 Toronto C08 3 $2,227,500 $742,500 $750,000 16 15 112% 6 Toronto C09 1 $1,400,000 $1,400,000 $1,400,000 6 4 108% 6 Toronto C10 2 $2,673,000 $1,336,500 $1,336,500 4 3 119% 7 Toronto C11 0 $0 $0 - 4 5 - - Toronto C12 5 $9,000,000 $1,800,000 $1,600,000 13 9 109% 7 Toronto C13 2 $1,721,450 $860,725 $860,725 10 7 108% 16 Toronto C14 7 $7,928,000 $1,132,571 $1,028,000 22 23 109% 7 Toronto C15 18 $16,973,501 $942,972 $925,000 43 27 112% 10 Toronto East 65 $54,614,404 $840,222 $840,000 126 90 112% 10 Toronto E01 9 $8,308,300 $923,144 $898,000 11 4 109% 9 Toronto E02 3 $3,031,999 $1,010,666 $1,007,000 5 2 117% 12 Toronto E03 0 $0 $0 - 1 1 - - Toronto E04 8 $6,788,300 $848,538 $848,400 21 13 112% 9 Toronto E05 12 $10,755,000 $896,250 $900,000 21 17 107% 12 Toronto E06 0 $0 $0 - 3 2 - - Toronto E07 2 $1,808,000 $904,000 $904,000 4 3 113% 10 Toronto E08 8 $6,205,800 $775,725 $742,500 14 13 117% 9 Toronto E09 3 $2,075,000 $691,667 $620,000 8 8 122% 14 Toronto E10 4 $2,690,000 $672,500 $722,500 13 10 110% 8 Toronto E11 16 $12,952,005 $809,500 $788,500 25 17 116% 11 Municipality Number of Sales Dollar Volume Average Price Median Price New Listings Active Listings Avg. SP/LP Avg. LDOM CONDO TOWNHOUSE, APRIL 2022 Toronto Regional Real Estate Board SUMMARY OF EXISTING HOME TRANSACTIONS CITY OF TORONTO MUNICIPAL BREAKDOWN 1 1 2 4 5 1 1 3 14 Market Watch, April 2022 Copyright® 2021 Toronto Regional Real Estate Board
  • 15. TRREB Total 2,173 $1,716,384,874 $789,869 $715,000 4,723 3,753 106% 12 Halton Region 119 $88,830,941 $746,478 $675,000 270 204 104% 12 Burlington 66 $47,058,232 $713,004 $665,000 117 77 105% 11 Halton Hills 0 $0 $0 - 2 3 - - Milton 15 $10,934,286 $728,952 $721,000 47 31 102% 11 Oakville 38 $30,838,423 $811,537 $677,500 104 93 104% 14 Peel Region 254 $178,122,996 $701,272 $689,500 618 436 108% 10 Brampton 35 $23,047,500 $658,500 $655,000 109 82 104% 11 Caledon 1 $910,000 $910,000 $910,000 1 0 107% 7 Mississauga 218 $154,165,496 $707,181 $690,000 508 354 108% 10 City of Toronto 1,488 $1,221,403,026 $820,835 $728,500 3,203 2,609 106% 13 Toronto West 325 $233,560,298 $718,647 $685,000 649 522 108% 15 Toronto Central 953 $840,022,682 $881,451 $760,000 2,122 1,781 105% 13 Toronto East 210 $147,820,046 $703,905 $655,500 432 306 109% 11 York Region 235 $178,541,561 $759,751 $740,000 506 425 105% 12 Aurora 8 $7,436,000 $929,500 $836,000 11 4 116% 8 East Gwillimbury 0 $0 $0 - 0 0 - - Georgina 1 $511,000 $511,000 $511,000 1 5 114% 8 King 3 $2,280,000 $760,000 $735,000 4 2 102% 11 Markham 62 $46,236,652 $745,752 $732,500 164 118 106% 12 Newmarket 6 $4,547,100 $757,850 $815,000 7 2 112% 4 Richmond Hill 56 $40,732,300 $727,363 $702,500 115 96 105% 12 Vaughan 94 $73,014,709 $776,752 $757,000 190 187 103% 12 Whitchurch-Stouffville 5 $3,783,800 $756,760 $700,000 14 11 102% 11 Durham Region 66 $43,542,450 $659,734 $651,500 107 61 117% 9 Ajax 7 $4,791,172 $684,453 $700,000 15 9 133% 8 Brock 0 $0 $0 - 0 0 - - Clarington 14 $9,183,000 $655,929 $625,000 20 13 119% 6 Oshawa 16 $7,813,500 $488,344 $486,000 26 17 115% 12 Pickering 19 $13,489,999 $710,000 $680,000 32 14 110% 9 Scugog 0 $0 $0 - 0 0 - - Uxbridge 1 $711,104 $711,104 $711,104 1 0 119% 5 Whitby 9 $7,553,675 $839,297 $807,019 13 8 118% 7 Dufferin County 4 $1,470,000 $367,500 $392,500 3 2 99% 7 Orangeville 4 $1,470,000 $367,500 $392,500 3 2 99% 7 Simcoe County 7 $4,473,900 $639,129 $629,000 16 16 98% 12 Adjala-Tosorontio 0 $0 $0 - 0 0 - - Bradford West Gwillimbury 1 $490,000 $490,000 $490,000 3 1 98% 17 Essa 0 $0 $0 - 0 0 - - Innisfil 2 $1,620,000 $810,000 $810,000 8 11 98% 13 New Tecumseth 4 $2,363,900 $590,975 $602,000 5 4 99% 11 Municipality Number of Sales Dollar Volume Average Price Median Price New Listings Active Listings Avg. SP/LP Avg. LDOM CONDO APT, APRIL 2022 Toronto Regional Real Estate Board SUMMARY OF EXISTING HOME TRANSACTIONS ALL TRREB AREAS 1 1 2 4 5 1 1 3 15 Market Watch, April 2022 Copyright® 2021 Toronto Regional Real Estate Board
  • 16. TRREB Total 2,173 $1,716,384,874 $789,869 $715,000 4,723 3,753 106% 12 City of Toronto 1,488 $1,221,403,026 $820,835 $728,500 3,203 2,609 106% 13 Toronto West 325 $233,560,298 $718,647 $685,000 649 522 108% 15 Toronto W01 25 $21,738,100 $869,524 $780,000 51 37 111% 8 Toronto W02 18 $15,743,480 $874,638 $816,495 30 21 111% 17 Toronto W03 9 $6,215,900 $690,656 $749,000 18 8 110% 7 Toronto W04 31 $19,960,018 $643,872 $630,000 50 40 107% 15 Toronto W05 36 $20,214,500 $561,514 $607,500 65 70 105% 14 Toronto W06 88 $69,157,327 $785,879 $733,500 176 162 108% 21 Toronto W07 3 $2,669,000 $889,667 $819,000 9 8 102% 11 Toronto W08 66 $48,522,238 $735,185 $690,000 142 93 108% 9 Toronto W09 21 $11,920,249 $567,631 $500,000 37 32 102% 18 Toronto W10 28 $17,419,486 $622,125 $626,250 71 51 105% 14 Toronto Central 953 $840,022,682 $881,451 $760,000 2,122 1,781 105% 13 Toronto C01 370 $316,265,167 $854,771 $760,000 782 658 105% 13 Toronto C02 59 $79,440,815 $1,346,454 $956,800 131 135 104% 14 Toronto C03 15 $15,862,506 $1,057,500 $870,100 38 39 102% 14 Toronto C04 15 $23,062,800 $1,537,520 $1,125,000 21 20 103% 15 Toronto C06 26 $18,009,500 $692,673 $695,000 47 28 109% 8 Toronto C07 38 $28,675,948 $754,630 $742,500 97 72 105% 11 Toronto C08 160 $137,098,674 $856,867 $747,750 423 381 105% 12 Toronto C09 7 $8,294,000 $1,184,857 $967,000 17 17 97% 45 Toronto C10 59 $53,159,296 $901,005 $785,000 131 100 105% 14 Toronto C11 18 $12,228,988 $679,388 $631,500 49 33 106% 12 Toronto C12 1 $1,960,000 $1,960,000 $1,960,000 6 9 98% 15 Toronto C13 28 $21,357,486 $762,767 $740,000 43 33 103% 19 Toronto C14 79 $61,827,014 $782,620 $750,000 164 116 105% 12 Toronto C15 78 $62,780,488 $804,878 $705,400 173 140 105% 14 Toronto East 210 $147,820,046 $703,905 $655,500 432 306 109% 11 Toronto E01 14 $12,929,750 $923,554 $914,500 23 15 112% 7 Toronto E02 18 $18,724,997 $1,040,278 $992,500 33 16 108% 7 Toronto E03 15 $9,538,500 $635,900 $565,000 23 12 101% 6 Toronto E04 24 $15,207,500 $633,646 $645,000 41 25 110% 9 Toronto E05 31 $20,631,044 $665,518 $675,000 51 43 109% 15 Toronto E06 6 $4,800,100 $800,017 $745,050 13 12 112% 5 Toronto E07 25 $16,582,800 $663,312 $660,000 79 65 110% 12 Toronto E08 21 $13,227,039 $629,859 $574,000 42 28 113% 8 Toronto E09 31 $20,057,990 $647,032 $625,000 87 65 106% 10 Toronto E10 4 $2,269,000 $567,250 $565,000 4 2 110% 55 Toronto E11 21 $13,851,326 $659,587 $640,000 36 23 113% 9 Municipality Number of Sales Dollar Volume Average Price Median Price New Listings Active Listings Avg. SP/LP Avg. LDOM CONDO APT, APRIL 2022 Toronto Regional Real Estate Board SUMMARY OF EXISTING HOME TRANSACTIONS CITY OF TORONTO MUNICIPAL BREAKDOWN 1 1 2 4 5 1 1 3 16 Market Watch, April 2022 Copyright® 2021 Toronto Regional Real Estate Board
  • 17. TRREB Total 38 $40,909,988 $1,076,579 $1,050,000 93 66 107% 9 Halton Region 2 $2,340,000 $1,170,000 $1,170,000 9 9 102% 5 Burlington 2 $2,340,000 $1,170,000 $1,170,000 3 2 102% 5 Halton Hills 0 $0 $0 - 0 0 - - Milton 0 $0 $0 - 1 2 - - Oakville 0 $0 $0 - 5 5 - - Peel Region 3 $3,012,000 $1,004,000 $995,000 16 8 107% 5 Brampton 2 $1,945,000 $972,500 $972,500 6 4 111% 6 Caledon 0 $0 $0 - 0 0 - - Mississauga 1 $1,067,000 $1,067,000 $1,067,000 10 4 99% 3 City of Toronto 5 $5,710,000 $1,142,000 $1,125,000 11 10 101% 14 Toronto West 0 $0 $0 - 1 2 - - Toronto Central 0 $0 $0 - 3 2 - - Toronto East 5 $5,710,000 $1,142,000 $1,125,000 7 6 101% 14 York Region 10 $13,630,000 $1,363,000 $1,353,500 27 25 109% 10 Aurora 0 $0 $0 - 0 0 - - East Gwillimbury 0 $0 $0 - 0 0 - - Georgina 0 $0 $0 - 0 0 - - King 0 $0 $0 - 1 1 - - Markham 7 $9,741,000 $1,391,571 $1,480,000 14 17 107% 12 Newmarket 0 $0 $0 - 0 0 - - Richmond Hill 1 $1,300,000 $1,300,000 $1,300,000 8 6 130% 2 Vaughan 2 $2,589,000 $1,294,500 $1,294,500 4 1 105% 5 Whitchurch-Stouffville 0 $0 $0 - 0 0 - - Durham Region 12 $10,964,988 $913,749 $922,000 20 8 112% 7 Ajax 2 $1,894,100 $947,050 $947,050 4 2 110% 10 Brock 0 $0 $0 - 0 0 - - Clarington 5 $4,480,000 $896,000 $906,000 8 3 118% 4 Oshawa 2 $1,640,000 $820,000 $820,000 1 0 97% 17 Pickering 0 $0 $0 - 1 0 - - Scugog 0 $0 $0 - 0 0 - - Uxbridge 0 $0 $0 - 1 1 - - Whitby 3 $2,950,888 $983,629 $1,001,000 5 2 114% 3 Dufferin County 0 $0 $0 - 0 0 - - Orangeville 0 $0 $0 - 0 0 - - Simcoe County 6 $5,253,000 $875,500 $851,500 10 6 103% 10 Adjala-Tosorontio 0 $0 $0 - 0 0 - - Bradford West Gwillimbury 1 $843,000 $843,000 $843,000 4 3 98% 4 Essa 4 $3,360,000 $840,000 $840,000 4 2 100% 13 Innisfil 0 $0 $0 - 1 0 - - New Tecumseth 1 $1,050,000 $1,050,000 $1,050,000 1 1 117% 5 Municipality Number of Sales Dollar Volume Average Price Median Price New Listings Active Listings Avg. SP/LP Avg. LDOM LINK, APRIL 2022 Toronto Regional Real Estate Board SUMMARY OF EXISTING HOME TRANSACTIONS ALL TRREB AREAS 1 1 2 4 5 1 1 3 17 Market Watch, April 2022 Copyright® 2021 Toronto Regional Real Estate Board
  • 18. TRREB Total 38 $40,909,988 $1,076,579 $1,050,000 93 66 107% 9 City of Toronto 5 $5,710,000 $1,142,000 $1,125,000 11 10 101% 14 Toronto West 0 $0 $0 - 1 2 - - Toronto W01 0 $0 $0 - 0 0 - - Toronto W02 0 $0 $0 - 0 0 - - Toronto W03 0 $0 $0 - 0 0 - - Toronto W04 0 $0 $0 - 0 0 - - Toronto W05 0 $0 $0 - 1 1 - - Toronto W06 0 $0 $0 - 0 0 - - Toronto W07 0 $0 $0 - 0 0 - - Toronto W08 0 $0 $0 - 0 0 - - Toronto W09 0 $0 $0 - 0 0 - - Toronto W10 0 $0 $0 - 0 1 - - Toronto Central 0 $0 $0 - 3 2 - - Toronto C01 0 $0 $0 - 0 0 - - Toronto C02 0 $0 $0 - 0 0 - - Toronto C03 0 $0 $0 - 0 0 - - Toronto C04 0 $0 $0 - 0 0 - - Toronto C06 0 $0 $0 - 0 0 - - Toronto C07 0 $0 $0 - 1 1 - - Toronto C08 0 $0 $0 - 0 0 - - Toronto C09 0 $0 $0 - 0 0 - - Toronto C10 0 $0 $0 - 0 0 - - Toronto C11 0 $0 $0 - 0 0 - - Toronto C12 0 $0 $0 - 0 0 - - Toronto C13 0 $0 $0 - 0 0 - - Toronto C14 0 $0 $0 - 0 0 - - Toronto C15 0 $0 $0 - 2 1 - - Toronto East 5 $5,710,000 $1,142,000 $1,125,000 7 6 101% 14 Toronto E01 0 $0 $0 - 0 0 - - Toronto E02 0 $0 $0 - 0 0 - - Toronto E03 0 $0 $0 - 0 0 - - Toronto E04 0 $0 $0 - 0 0 - - Toronto E05 2 $2,385,000 $1,192,500 $1,192,500 3 2 92% 15 Toronto E06 0 $0 $0 - 0 0 - - Toronto E07 2 $2,200,000 $1,100,000 $1,100,000 2 2 111% 16 Toronto E08 0 $0 $0 - 0 0 - - Toronto E09 0 $0 $0 - 0 0 - - Toronto E10 0 $0 $0 - 1 1 - - Toronto E11 1 $1,125,000 $1,125,000 $1,125,000 1 1 102% 8 Municipality Number of Sales Dollar Volume Average Price Median Price New Listings Active Listings Avg. SP/LP Avg. LDOM LINK, APRIL 2022 Toronto Regional Real Estate Board SUMMARY OF EXISTING HOME TRANSACTIONS CITY OF TORONTO MUNICIPAL BREAKDOWN 1 1 2 4 5 1 1 3 18 Market Watch, April 2022 Copyright® 2021 Toronto Regional Real Estate Board
  • 19. TRREB Total 11 $7,986,000 $726,000 $460,000 21 22 99% 63 Halton Region 0 $0 $0 - 0 2 - - Burlington 0 $0 $0 - 0 2 - - Halton Hills 0 $0 $0 - 0 0 - - Milton 0 $0 $0 - 0 0 - - Oakville 0 $0 $0 - 0 0 - - Peel Region 2 $870,000 $435,000 $435,000 1 0 99% 40 Brampton 0 $0 $0 - 0 0 - - Caledon 0 $0 $0 - 0 0 - - Mississauga 2 $870,000 $435,000 $435,000 1 0 99% 40 City of Toronto 9 $7,116,000 $790,667 $535,000 20 20 99% 68 Toronto West 4 $1,710,000 $427,500 $427,500 4 5 99% 109 Toronto Central 5 $5,406,000 $1,081,200 $971,000 11 12 99% 34 Toronto East 0 $0 $0 - 5 3 - - York Region 0 $0 $0 - 0 0 - - Aurora 0 $0 $0 - 0 0 - - East Gwillimbury 0 $0 $0 - 0 0 - - Georgina 0 $0 $0 - 0 0 - - King 0 $0 $0 - 0 0 - - Markham 0 $0 $0 - 0 0 - - Newmarket 0 $0 $0 - 0 0 - - Richmond Hill 0 $0 $0 - 0 0 - - Vaughan 0 $0 $0 - 0 0 - - Whitchurch-Stouffville 0 $0 $0 - 0 0 - - Durham Region 0 $0 $0 - 0 0 - - Ajax 0 $0 $0 - 0 0 - - Brock 0 $0 $0 - 0 0 - - Clarington 0 $0 $0 - 0 0 - - Oshawa 0 $0 $0 - 0 0 - - Pickering 0 $0 $0 - 0 0 - - Scugog 0 $0 $0 - 0 0 - - Uxbridge 0 $0 $0 - 0 0 - - Whitby 0 $0 $0 - 0 0 - - Dufferin County 0 $0 $0 - 0 0 - - Orangeville 0 $0 $0 - 0 0 - - Simcoe County 0 $0 $0 - 0 0 - - Adjala-Tosorontio 0 $0 $0 - 0 0 - - Bradford West Gwillimbury 0 $0 $0 - 0 0 - - Essa 0 $0 $0 - 0 0 - - Innisfil 0 $0 $0 - 0 0 - - New Tecumseth 0 $0 $0 - 0 0 - - Municipality Number of Sales Dollar Volume Average Price Median Price New Listings Active Listings Avg. SP/LP Avg. LDOM CO-OP APT, APRIL 2022 Toronto Regional Real Estate Board SUMMARY OF EXISTING HOME TRANSACTIONS ALL TRREB AREAS 1 1 2 4 5 1 1 3 19 Market Watch, April 2022 Copyright® 2021 Toronto Regional Real Estate Board
  • 20. TRREB Total 11 $7,986,000 $726,000 $460,000 21 22 99% 63 City of Toronto 9 $7,116,000 $790,667 $535,000 20 20 99% 68 Toronto West 4 $1,710,000 $427,500 $427,500 4 5 99% 109 Toronto W01 0 $0 $0 - 0 0 - - Toronto W02 0 $0 $0 - 1 1 - - Toronto W03 0 $0 $0 - 0 0 - - Toronto W04 0 $0 $0 - 0 0 - - Toronto W05 0 $0 $0 - 0 1 - - Toronto W06 1 $320,000 $320,000 $320,000 1 1 96% 91 Toronto W07 0 $0 $0 - 0 0 - - Toronto W08 3 $1,390,000 $463,333 $440,000 1 0 100% 115 Toronto W09 0 $0 $0 - 1 1 - - Toronto W10 0 $0 $0 - 0 1 - - Toronto Central 5 $5,406,000 $1,081,200 $971,000 11 12 99% 34 Toronto C01 0 $0 $0 - 0 0 - - Toronto C02 1 $355,000 $355,000 $355,000 0 0 96% 26 Toronto C03 0 $0 $0 - 0 0 - - Toronto C04 0 $0 $0 - 0 0 - - Toronto C06 0 $0 $0 - 0 0 - - Toronto C07 0 $0 $0 - 2 1 - - Toronto C08 1 $1,475,000 $1,475,000 $1,475,000 1 1 100% 41 Toronto C09 3 $3,576,000 $1,192,000 $971,000 7 9 99% 35 Toronto C10 0 $0 $0 - 0 0 - - Toronto C11 0 $0 $0 - 0 0 - - Toronto C12 0 $0 $0 - 0 0 - - Toronto C13 0 $0 $0 - 0 0 - - Toronto C14 0 $0 $0 - 0 0 - - Toronto C15 0 $0 $0 - 1 1 - - Toronto East 0 $0 $0 - 5 3 - - Toronto E01 0 $0 $0 - 0 0 - - Toronto E02 0 $0 $0 - 0 0 - - Toronto E03 0 $0 $0 - 0 0 - - Toronto E04 0 $0 $0 - 1 1 - - Toronto E05 0 $0 $0 - 0 0 - - Toronto E06 0 $0 $0 - 0 0 - - Toronto E07 0 $0 $0 - 0 0 - - Toronto E08 0 $0 $0 - 0 0 - - Toronto E09 0 $0 $0 - 0 0 - - Toronto E10 0 $0 $0 - 4 2 - - Toronto E11 0 $0 $0 - 0 0 - - Municipality Number of Sales Dollar Volume Average Price Median Price New Listings Active Listings Avg. SP/LP Avg. LDOM CO-OP APT, APRIL 2022 Toronto Regional Real Estate Board SUMMARY OF EXISTING HOME TRANSACTIONS CITY OF TORONTO MUNICIPAL BREAKDOWN 1 1 2 4 5 1 1 3 20 Market Watch, April 2022 Copyright® 2021 Toronto Regional Real Estate Board
  • 21. TRREB Total 8 $8,826,999 $1,103,375 $1,012,500 15 13 107% 11 Halton Region 3 $4,653,000 $1,551,000 $1,770,000 2 2 107% 9 Burlington 1 $1,083,000 $1,083,000 $1,083,000 1 2 108% 8 Halton Hills 0 $0 $0 - 0 0 - - Milton 0 $0 $0 - 0 0 - - Oakville 2 $3,570,000 $1,785,000 $1,785,000 1 0 107% 9 Peel Region 1 $999,999 $999,999 $999,999 3 2 125% 7 Brampton 0 $0 $0 - 1 1 - - Caledon 0 $0 $0 - 0 0 - - Mississauga 1 $999,999 $999,999 $999,999 2 1 125% 7 City of Toronto 0 $0 $0 - 0 0 - - Toronto West 0 $0 $0 - 0 0 - - Toronto Central 0 $0 $0 - 0 0 - - Toronto East 0 $0 $0 - 0 0 - - York Region 0 $0 $0 - 1 3 - - Aurora 0 $0 $0 - 0 0 - - East Gwillimbury 0 $0 $0 - 0 0 - - Georgina 0 $0 $0 - 0 0 - - King 0 $0 $0 - 0 0 - - Markham 0 $0 $0 - 0 2 - - Newmarket 0 $0 $0 - 0 0 - - Richmond Hill 0 $0 $0 - 0 0 - - Vaughan 0 $0 $0 - 1 1 - - Whitchurch-Stouffville 0 $0 $0 - 0 0 - - Durham Region 0 $0 $0 - 2 1 - - Ajax 0 $0 $0 - 2 1 - - Brock 0 $0 $0 - 0 0 - - Clarington 0 $0 $0 - 0 0 - - Oshawa 0 $0 $0 - 0 0 - - Pickering 0 $0 $0 - 0 0 - - Scugog 0 $0 $0 - 0 0 - - Uxbridge 0 $0 $0 - 0 0 - - Whitby 0 $0 $0 - 0 0 - - Dufferin County 0 $0 $0 - 0 0 - - Orangeville 0 $0 $0 - 0 0 - - Simcoe County 4 $3,174,000 $793,500 $734,500 7 5 102% 13 Adjala-Tosorontio 0 $0 $0 - 0 0 - - Bradford West Gwillimbury 0 $0 $0 - 0 0 - - Essa 0 $0 $0 - 0 0 - - Innisfil 0 $0 $0 - 0 0 - - New Tecumseth 4 $3,174,000 $793,500 $734,500 7 5 102% 13 Municipality Number of Sales Dollar Volume Average Price Median Price New Listings Active Listings Avg. SP/LP Avg. LDOM DET CONDO, APRIL 2022 Toronto Regional Real Estate Board SUMMARY OF EXISTING HOME TRANSACTIONS ALL TRREB AREAS 1 1 2 4 5 1 1 3 21 Market Watch, April 2022 Copyright® 2021 Toronto Regional Real Estate Board
  • 22. TRREB Total 8 $8,826,999 $1,103,375 $1,012,500 15 13 107% 11 City of Toronto 0 $0 $0 - 0 0 - - Toronto West 0 $0 $0 - 0 0 - - Toronto W01 0 $0 $0 - 0 0 - - Toronto W02 0 $0 $0 - 0 0 - - Toronto W03 0 $0 $0 - 0 0 - - Toronto W04 0 $0 $0 - 0 0 - - Toronto W05 0 $0 $0 - 0 0 - - Toronto W06 0 $0 $0 - 0 0 - - Toronto W07 0 $0 $0 - 0 0 - - Toronto W08 0 $0 $0 - 0 0 - - Toronto W09 0 $0 $0 - 0 0 - - Toronto W10 0 $0 $0 - 0 0 - - Toronto Central 0 $0 $0 - 0 0 - - Toronto C01 0 $0 $0 - 0 0 - - Toronto C02 0 $0 $0 - 0 0 - - Toronto C03 0 $0 $0 - 0 0 - - Toronto C04 0 $0 $0 - 0 0 - - Toronto C06 0 $0 $0 - 0 0 - - Toronto C07 0 $0 $0 - 0 0 - - Toronto C08 0 $0 $0 - 0 0 - - Toronto C09 0 $0 $0 - 0 0 - - Toronto C10 0 $0 $0 - 0 0 - - Toronto C11 0 $0 $0 - 0 0 - - Toronto C12 0 $0 $0 - 0 0 - - Toronto C13 0 $0 $0 - 0 0 - - Toronto C14 0 $0 $0 - 0 0 - - Toronto C15 0 $0 $0 - 0 0 - - Toronto East 0 $0 $0 - 0 0 - - Toronto E01 0 $0 $0 - 0 0 - - Toronto E02 0 $0 $0 - 0 0 - - Toronto E03 0 $0 $0 - 0 0 - - Toronto E04 0 $0 $0 - 0 0 - - Toronto E05 0 $0 $0 - 0 0 - - Toronto E06 0 $0 $0 - 0 0 - - Toronto E07 0 $0 $0 - 0 0 - - Toronto E08 0 $0 $0 - 0 0 - - Toronto E09 0 $0 $0 - 0 0 - - Toronto E10 0 $0 $0 - 0 0 - - Toronto E11 0 $0 $0 - 0 0 - - Municipality Number of Sales Dollar Volume Average Price Median Price New Listings Active Listings Avg. SP/LP Avg. LDOM DET CONDO, APRIL 2022 Toronto Regional Real Estate Board SUMMARY OF EXISTING HOME TRANSACTIONS CITY OF TORONTO MUNICIPAL BREAKDOWN 1 1 2 4 5 1 1 3 22 Market Watch, April 2022 Copyright® 2021 Toronto Regional Real Estate Board
  • 23. TRREB Total 8 $5,000,000 $625,000 $645,000 17 16 99% 26 Halton Region 0 $0 $0 - 0 0 - - Burlington 0 $0 $0 - 0 0 - - Halton Hills 0 $0 $0 - 0 0 - - Milton 0 $0 $0 - 0 0 - - Oakville 0 $0 $0 - 0 0 - - Peel Region 0 $0 $0 - 0 0 - - Brampton 0 $0 $0 - 0 0 - - Caledon 0 $0 $0 - 0 0 - - Mississauga 0 $0 $0 - 0 0 - - City of Toronto 8 $5,000,000 $625,000 $645,000 17 16 99% 26 Toronto West 1 $515,000 $515,000 $515,000 1 1 97% 33 Toronto Central 7 $4,485,000 $640,714 $660,000 16 15 99% 25 Toronto East 0 $0 $0 - 0 0 - - York Region 0 $0 $0 - 0 0 - - Aurora 0 $0 $0 - 0 0 - - East Gwillimbury 0 $0 $0 - 0 0 - - Georgina 0 $0 $0 - 0 0 - - King 0 $0 $0 - 0 0 - - Markham 0 $0 $0 - 0 0 - - Newmarket 0 $0 $0 - 0 0 - - Richmond Hill 0 $0 $0 - 0 0 - - Vaughan 0 $0 $0 - 0 0 - - Whitchurch-Stouffville 0 $0 $0 - 0 0 - - Durham Region 0 $0 $0 - 0 0 - - Ajax 0 $0 $0 - 0 0 - - Brock 0 $0 $0 - 0 0 - - Clarington 0 $0 $0 - 0 0 - - Oshawa 0 $0 $0 - 0 0 - - Pickering 0 $0 $0 - 0 0 - - Scugog 0 $0 $0 - 0 0 - - Uxbridge 0 $0 $0 - 0 0 - - Whitby 0 $0 $0 - 0 0 - - Dufferin County 0 $0 $0 - 0 0 - - Orangeville 0 $0 $0 - 0 0 - - Simcoe County 0 $0 $0 - 0 0 - - Adjala-Tosorontio 0 $0 $0 - 0 0 - - Bradford West Gwillimbury 0 $0 $0 - 0 0 - - Essa 0 $0 $0 - 0 0 - - Innisfil 0 $0 $0 - 0 0 - - New Tecumseth 0 $0 $0 - 0 0 - - Municipality Number of Sales Dollar Volume Average Price Median Price New Listings Active Listings Avg. SP/LP Avg. LDOM CO-OWNERSHIP APT, APRIL 2022 Toronto Regional Real Estate Board SUMMARY OF EXISTING HOME TRANSACTIONS ALL TRREB AREAS 1 1 2 4 5 1 1 3 23 Market Watch, April 2022 Copyright® 2021 Toronto Regional Real Estate Board
  • 24. TRREB Total 8 $5,000,000 $625,000 $645,000 17 16 99% 26 City of Toronto 8 $5,000,000 $625,000 $645,000 17 16 99% 26 Toronto West 1 $515,000 $515,000 $515,000 1 1 97% 33 Toronto W01 0 $0 $0 - 0 0 - - Toronto W02 0 $0 $0 - 0 0 - - Toronto W03 0 $0 $0 - 0 0 - - Toronto W04 0 $0 $0 - 0 0 - - Toronto W05 0 $0 $0 - 1 1 - - Toronto W06 1 $515,000 $515,000 $515,000 0 0 97% 33 Toronto W07 0 $0 $0 - 0 0 - - Toronto W08 0 $0 $0 - 0 0 - - Toronto W09 0 $0 $0 - 0 0 - - Toronto W10 0 $0 $0 - 0 0 - - Toronto Central 7 $4,485,000 $640,714 $660,000 16 15 99% 25 Toronto C01 0 $0 $0 - 1 1 - - Toronto C02 1 $615,000 $615,000 $615,000 3 3 99% 48 Toronto C03 3 $2,220,000 $740,000 $780,000 5 2 98% 15 Toronto C04 1 $630,000 $630,000 $630,000 3 2 102% 15 Toronto C06 0 $0 $0 - 0 0 - - Toronto C07 0 $0 $0 - 0 0 - - Toronto C08 0 $0 $0 - 1 1 - - Toronto C09 1 $695,000 $695,000 $695,000 0 0 100% 29 Toronto C10 0 $0 $0 - 0 0 - - Toronto C11 0 $0 $0 - 0 0 - - Toronto C12 0 $0 $0 - 0 0 - - Toronto C13 0 $0 $0 - 1 1 - - Toronto C14 1 $325,000 $325,000 $325,000 1 4 96% 38 Toronto C15 0 $0 $0 - 1 1 - - Toronto East 0 $0 $0 - 0 0 - - Toronto E01 0 $0 $0 - 0 0 - - Toronto E02 0 $0 $0 - 0 0 - - Toronto E03 0 $0 $0 - 0 0 - - Toronto E04 0 $0 $0 - 0 0 - - Toronto E05 0 $0 $0 - 0 0 - - Toronto E06 0 $0 $0 - 0 0 - - Toronto E07 0 $0 $0 - 0 0 - - Toronto E08 0 $0 $0 - 0 0 - - Toronto E09 0 $0 $0 - 0 0 - - Toronto E10 0 $0 $0 - 0 0 - - Toronto E11 0 $0 $0 - 0 0 - - Municipality Number of Sales Dollar Volume Average Price Median Price New Listings Active Listings Avg. SP/LP Avg. LDOM CO-OWNERSHIP APT, APRIL 2022 Toronto Regional Real Estate Board SUMMARY OF EXISTING HOME TRANSACTIONS CITY OF TORONTO MUNICIPAL BREAKDOWN 1 1 2 4 5 1 1 3 24 Market Watch, April 2022 Copyright® 2021 Toronto Regional Real Estate Board
  • 25. 443.2 $1,354,000 30.58% 445.8 $1,667,800 29.93% 462.2 $1,302,000 30.05% 440.7 $948,700 30.69% 417.0 $825,800 31.42% 451.5 $1,390,700 24.31% 449.7 $1,641,000 22.70% 469.3 $1,187,800 24.38% 436.2 $840,400 21.50% 435.9 $824,900 28.09% 456.7 $1,317,700 23.40% 460.8 $1,586,000 21.74% 492.9 $1,201,700 22.43% 445.8 $833,100 22.54% 446.9 $737,800 28.72% 457.6 $1,349,700 28.83% 450.8 $1,470,300 29.61% 465.2 $1,036,600 26.69% 474.5 $755,500 25.96% 439.7 $671,400 29.63% 450.9 $1,372,400 29.01% 445.2 $1,639,800 26.80% 464.0 $1,118,500 27.65% 418.6 $718,000 20.88% 413.0 $849,700 28.10% 444.8 $1,502,100 21.50% 442.1 $1,792,700 19.23% 463.6 $1,292,300 21.30% 422.4 $959,300 20.27% 428.2 $855,400 27.02% 455.9 $1,292,000 35.48% 449.2 $1,590,800 34.69% 465.1 $1,188,500 34.54% 448.8 $948,900 33.65% 456.7 $780,900 39.15% 471.0 $1,199,700 37.32% 460.1 $1,355,600 37.22% 475.8 $1,111,200 35.75% 467.5 $845,300 35.51% 473.6 $698,500 48.00% 433.8 $1,585,300 38.68% 438.9 $1,668,400 38.80% 470.3 $1,161,800 35.07% 414.8 $897,900 36.67% - - - 444.4 $1,312,000 33.57% 436.7 $1,744,200 30.40% 445.8 $1,229,400 32.48% 441.2 $975,100 32.81% 453.5 $796,200 37.47% 416.5 $1,373,300 25.57% 418.1 $1,889,100 22.57% 432.9 $1,462,500 19.55% 419.2 $994,300 29.14% 408.7 $833,900 28.28% 449.5 $1,531,500 34.90% 455.7 $1,761,800 32.51% 463.2 $1,338,700 36.00% 415.2 $1,074,400 35.38% 392.8 $852,800 39.54% 444.6 $1,470,500 35.18% 446.2 $1,676,400 34.89% 476.1 $1,227,700 38.04% 399.0 $1,080,900 30.86% 388.8 $834,200 37.68% 433.1 $1,482,000 34.25% 432.2 $1,542,100 33.11% 480.5 $1,005,100 38.19% - - - - - - 475.2 $922,100 36.47% 485.7 $937,000 36.70% 483.1 $952,300 38.82% - - - - - - 456.2 $2,123,300 34.89% 463.5 $2,172,300 34.86% 459.8 $1,410,200 40.23% - - - 356.2 $880,500 34.36% 461.4 $1,621,800 37.20% 473.5 $1,982,400 31.78% 480.7 $1,431,000 37.58% 407.1 $1,098,700 38.89% 410.5 $945,400 43.78% 426.5 $1,255,900 36.17% 428.0 $1,442,600 35.96% 438.3 $1,032,300 38.26% 436.4 $903,100 29.84% 394.6 $675,300 38.85% 460.0 $1,652,800 32.95% 481.7 $2,057,500 29.42% 456.4 $1,387,600 32.60% 394.1 $999,100 37.94% 400.6 $810,600 38.95% 428.5 $1,564,000 32.99% 419.7 $1,783,200 30.18% 447.2 $1,357,700 34.05% 434.7 $1,202,000 36.10% 370.8 $856,400 36.37% 482.1 $1,679,500 35.76% 477.6 $1,761,700 34.54% 504.5 $1,258,800 41.83% 477.2 $847,000 23.24% 387.2 $774,800 36.82% 483.5 $1,128,900 37.63% 468.8 $1,223,400 37.16% 501.8 $1,000,800 37.03% 513.5 $807,900 37.15% 487.2 $808,500 45.48% 478.8 $1,180,800 39.11% 476.4 $1,278,000 38.93% 500.4 $1,079,800 39.46% 446.6 $839,200 32.52% 437.5 $702,600 42.88% 452.3 $762,800 37.94% 451.7 $769,400 37.84% 432.7 $872,800 32.32% - - - - - - 464.6 $981,300 32.36% 449.6 $1,082,800 32.12% 456.0 $871,100 29.22% 515.3 $832,400 39.31% 416.5 $613,800 43.32% 511.5 $972,700 38.84% 487.4 $1,040,200 38.15% 553.0 $925,500 37.56% 578.1 $732,700 41.03% 528.1 $597,400 58.97% 480.1 $1,280,600 37.53% 452.5 $1,409,700 36.67% 482.6 $1,126,100 35.87% 480.5 $819,900 34.71% 612.9 $1,154,500 43.54% 433.2 $1,112,200 37.09% 426.5 $1,130,500 37.09% 454.9 $845,700 41.80% - - - - - - 428.9 $1,429,100 35.51% 430.7 $1,487,600 35.53% 419.7 $973,300 37.02% 412.8 $751,700 30.76% 375.2 $896,000 42.28% 483.2 $1,255,400 39.65% 479.8 $1,379,900 39.15% 500.3 $1,102,100 39.63% 475.9 $799,600 32.97% 387.5 $719,400 42.62% 488.5 $1,078,100 31.64% 504.9 $1,150,700 29.03% 488.1 $914,700 30.40% 487.4 $644,300 44.03% 499.0 $732,000 48.20% 488.5 $1,078,100 31.64% 504.9 $1,150,600 29.03% 488.1 $914,700 30.40% 487.4 $644,300 44.03% 499.0 $732,000 48.20% 432.0 $943,700 29.77% 414.9 $951,900 30.84% 500.2 $934,200 36.97% 432.8 $683,300 41.21% 430.4 $680,700 42.99% 395.5 $1,057,400 25.08% 396.1 $1,060,500 25.15% - - - - - - - - - 464.8 $1,163,600 35.63% 432.1 $1,232,900 34.48% 522.9 $1,101,800 49.06% 477.4 $775,300 40.62% 390.7 $659,100 38.11% 463.0 $926,900 30.42% 442.1 $935,500 34.79% 512.0 $807,900 32.99% 457.0 $728,900 32.23% - - - 414.4 $817,300 24.56% 405.9 $825,200 27.48% 521.1 $796,800 32.60% 426.8 $358,900 54.92% 394.5 $775,200 37.12% - - - - - - - - - - - - - - - 415.9 $977,000 32.88% 397.6 $1,035,200 28.92% 460.8 $839,100 30.98% 423.3 $855,500 40.49% 458.6 $715,300 44.76% Composite Single Family Detached Single Family Attached Townhouse Apartment Index Benchmark Yr./Yr. % Chg. Index Benchmark Yr./Yr. % Chg. Index Benchmark Yr./Yr. % Chg. Index Benchmark Yr./Yr. % Chg. Index Benchmark Yr./Yr. % Chg. Toronto Regional Real Estate Board FOCUS ON THE MLS HOME PRICE INDEX ALL TRREB AREAS INDEX AND BENCHMARK PRICE, APRIL 2022 TRREB Total Halton Region Burlington Halton Hills Milton Oakville Peel Region Brampton Caledon Mississauga City of Toronto York Region Aurora East Gwillimbury Georgina King Markham Newmarket Richmond Hill Vaughan Whitchurch-Stouffville Durham Region Ajax Brock Clarington Oshawa Pickering Scugog Uxbridge Whitby Dufferin County Orangeville Simcoe County Adjala-Tosorontio Bradford West Gwillimbury Essa Innisfil Barrie New Tecumseth 25 Market Watch, April 2022 Copyright® 2021 Toronto Regional Real Estate Board
  • 26. 443.2 $1,354,000 30.58% 445.8 $1,667,800 29.93% 462.2 $1,302,000 30.05% 440.7 $948,700 30.69% 417.0 $825,800 31.42% 416.5 $1,373,300 25.57% 418.1 $1,889,100 22.57% 432.9 $1,462,500 19.55% 419.2 $994,300 29.14% 408.7 $833,900 28.28% 392.1 $1,673,800 24.00% 404.6 $2,253,600 20.52% 427.0 $1,697,200 18.94% 351.6 $1,057,900 29.41% 380.9 $861,200 25.75% 455.5 $1,622,900 21.18% 424.2 $1,854,200 17.25% 475.6 $1,414,300 16.28% 499.3 $972,200 28.85% 445.1 $955,500 27.46% 461.3 $1,189,500 22.82% 468.0 $1,266,600 21.68% 470.8 $1,206,000 21.06% 366.1 $897,700 30.66% 448.9 $767,000 30.08% 425.4 $1,091,800 24.90% 405.9 $1,284,500 23.64% 409.5 $1,163,800 24.92% 376.3 $866,200 29.76% 456.5 $673,400 25.21% 403.7 $959,000 25.92% 406.2 $1,362,200 24.18% 392.3 $1,139,500 26.02% 388.7 $705,800 30.26% 426.2 $563,100 23.57% 360.1 $1,054,700 25.65% 453.2 $1,432,100 19.48% 410.7 $1,383,000 20.79% 441.4 $1,308,800 31.56% 299.9 $752,300 27.94% 372.4 $1,646,800 19.59% 401.4 $1,840,800 20.69% 391.6 $1,627,900 22.30% 293.0 $1,077,100 17.81% 219.3 $889,300 17.59% 361.7 $1,533,100 24.12% 367.5 $2,060,500 20.85% 399.8 $1,503,400 21.04% 418.2 $1,005,800 28.91% 347.1 $722,800 26.03% 402.5 $1,050,200 28.02% 394.7 $1,530,600 22.20% 420.1 $1,158,800 24.07% 320.6 $890,400 28.45% 433.2 $570,700 36.23% 475.1 $1,085,300 35.32% 431.8 $1,295,300 28.51% 424.2 $1,085,500 25.28% 516.2 $929,300 29.02% 513.9 $732,100 43.43% 421.8 $1,058,200 21.38% 458.3 $1,795,600 8.09% 449.9 $1,644,000 6.66% 415.1 $1,183,200 25.45% 418.8 $871,900 22.92% 383.1 $1,930,100 19.91% 368.5 $3,110,300 18.83% 383.0 $2,146,500 16.10% 367.4 $1,847,400 19.05% 381.5 $1,086,900 21.85% 444.1 $2,573,400 19.32% 418.0 $2,833,800 17.45% 436.7 $1,685,100 16.73% - - - 497.7 $1,301,900 27.35% 365.5 $2,357,300 24.19% 376.2 $2,753,900 23.43% 392.6 $1,836,000 23.65% - - - 317.3 $848,800 27.48% 397.1 $1,600,000 22.07% 393.7 $1,752,900 17.52% 376.0 $1,386,000 20.82% 363.8 $975,700 23.57% 402.2 $865,000 26.28% 413.4 $1,413,000 24.52% 425.2 $2,024,300 15.70% 352.5 $1,329,400 22.23% 364.8 $1,028,200 23.24% 416.2 $867,300 30.35% 383.2 $995,100 26.01% 372.0 $2,178,200 14.08% 387.3 $1,847,600 12.85% 391.2 $1,011,700 18.76% 382.8 $820,000 27.39% 321.3 $2,305,000 23.20% 332.5 $4,286,900 24.16% 332.4 $3,146,200 22.12% 359.7 $2,124,400 19.70% 304.1 $1,007,500 23.37% 407.1 $1,609,100 28.42% 371.7 $2,294,900 23.16% 371.7 $1,836,400 27.21% 349.2 $1,170,500 22.61% 425.8 $1,016,800 30.53% 445.1 $1,614,700 24.26% 404.5 $2,912,400 22.28% 432.4 $2,005,000 19.84% 380.4 $659,000 32.36% 470.6 $683,300 25.80% 350.9 $3,031,500 23.69% 340.0 $3,686,400 20.01% 414.1 $1,702,500 22.44% 296.7 $1,187,100 24.66% 414.8 $1,300,500 33.85% 398.5 $1,492,300 24.38% 386.7 $2,152,800 16.44% 380.8 $1,187,600 20.39% 356.4 $1,030,300 27.60% 410.1 $837,800 31.06% 406.5 $1,379,800 29.71% 422.9 $2,544,100 17.05% 356.4 $1,840,100 29.27% 461.5 $1,242,800 33.50% 396.5 $998,500 32.74% 423.5 $1,371,500 32.22% 406.5 $1,908,600 19.81% 359.7 $1,169,400 26.39% 413.3 $989,200 27.84% 437.7 $1,007,700 38.43% 482.0 $1,500,200 18.17% 485.5 $1,710,300 13.73% 495.4 $1,562,400 14.73% 587.9 $1,075,300 22.53% 395.2 $884,000 30.69% 444.3 $1,658,700 21.43% 386.5 $1,749,100 19.47% 463.2 $1,550,100 18.01% 454.1 $1,307,900 22.56% 425.8 $1,209,900 33.10% 438.7 $1,364,700 21.66% 440.7 $1,498,000 19.01% 421.4 $1,406,500 19.58% - - - 455.2 $680,400 40.15% 447.3 $1,103,200 28.02% 427.7 $1,260,900 26.39% 447.4 $1,078,200 26.74% 407.3 $866,000 32.07% 504.0 $768,600 30.64% 394.3 $1,047,700 29.07% 427.0 $1,503,700 28.31% 425.7 $1,173,100 31.75% 404.9 $880,500 25.16% 347.7 $713,700 29.59% 448.3 $1,246,700 26.75% 453.6 $1,295,700 24.34% 453.4 $1,078,300 25.04% 433.4 $957,800 34.81% 418.3 $861,100 36.92% 450.6 $1,104,500 35.07% 453.6 $1,486,800 34.20% 444.2 $1,161,400 34.89% 408.4 $884,700 23.80% 456.4 $781,600 37.64% 451.0 $1,039,700 29.90% 434.2 $1,353,400 26.33% 391.3 $1,014,400 26.96% 434.7 $797,000 38.97% 483.5 $659,700 33.05% 450.4 $1,075,400 34.45% 445.2 $1,264,100 31.33% 422.8 $1,034,000 29.18% 490.8 $883,600 38.21% 452.5 $848,800 37.62% 466.7 $1,308,800 33.76% 448.6 $1,437,300 32.45% 454.1 $1,177,500 31.05% 540.0 $880,900 38.50% 425.9 $687,100 35.68% 467.6 $997,200 27.41% 454.8 $1,264,900 27.68% 462.8 $1,048,300 26.38% 383.1 $751,900 35.04% 583.7 $739,900 28.74% Composite Single Family Detached Single Family Attached Townhouse Apartment Index Benchmark Yr./Yr. % Chg. Index Benchmark Yr./Yr. % Chg. Index Benchmark Yr./Yr. % Chg. Index Benchmark Yr./Yr. % Chg. Index Benchmark Yr./Yr. % Chg. Toronto Regional Real Estate Board FOCUS ON THE MLS HOME PRICE INDEX CITY OF TORONTO INDEX AND BENCHMARK PRICE, APRIL 2022 TRREB Total City of Toronto Toronto W01 Toronto W02 Toronto W03 Toronto W04 Toronto W05 Toronto W06 Toronto W07 Toronto W08 Toronto W09 Toronto W10 Toronto C01 Toronto C02 Toronto C03 Toronto C04 Toronto C06 Toronto C07 Toronto C08 Toronto C09 Toronto C10 Toronto C11 Toronto C12 Toronto C13 Toronto C14 Toronto C15 Toronto E01 Toronto E02 Toronto E03 Toronto E04 Toronto E05 Toronto E06 Toronto E07 Toronto E08 Toronto E09 Toronto E10 Toronto E11 26 Market Watch, April 2022 Copyright® 2021 Toronto Regional Real Estate Board
  • 27. 2010 85,860 $431,262 2011 89,110 $464,989 2012 85,488 $497,073 2013 87,047 $522,951 2014 92,776 $566,611 2015 101,213 $622,118 2016 113,040 $729,821 2017 92,340 $822,496 2018 78,017 $787,800 2019 87,746 $819,043 2020 95,065 $929,623 Year Sales Average Price Toronto Regional Real Estate Board January 6,888 966,068 February 10,928 1,044,925 March 15,628 1,097,351 April 13,613 1,090,414 May 11,903 1,108,124 June 11,053 1,088,991 July 9,339 1,061,724 August 8,552 1,070,140 September 9,010 1,135,027 October 9,744 1,155,604 November 8,985 1,163,035 December 6,015 1,157,896 January 5,602 $1,242,325 February 9,061 $1,334,408 March 10,939 $1,300,082 April 8,008 $1,254,436 May - - June - - July - - August - - September - - October - - November - - December - - Annual 121,658 $1,095,380 HISTORIC ANNUAL STATISTICS1,6,7 Year to Date 33,610 $1,288,834 NOTES *For historic annual sales and average price data over a longer time frame go to: http://www.torontorealestateboard.com/market_news/market_watch/historic_stats/ pdf/TREB_historic_statistics.pdf Ajax Aurora Bradford West Gwillimbury Brampton Brock Burlington C01 C02 C03 C04 C06 C07 C08 C10 C11 C12 C13 C14 C15 Caledon Clarington E01 E02 E03 E04 E06 E07 E08 E09 E10 E11 East Gwillimbury Essa Georgina Halton Hills Innisfil King Markham Milton Mississauga New Tecumseth Newmarket Oakville Oshawa Pickering Richmond Hill Scugog Uxbridge Vaughan W02 W03 W04 W05 W06 W07 W08 W09 W10 Whitchurch-Stouffville Adjala-Tosorontio Orangeville Whitby Dufferin Durham Halton Peel Simcoe Toronto York 27 Market Watch, April 2022 Copyright® 2021 Toronto Regional Real Estate Board 1 - Sales, dollar volume, average sale prices and median sale prices are based on firm transactions entered into the TRREB MLS® system between the first and last day of the month/period being reported. 2 - New listings entered into the TRREB MLS® system between the first and last day of the month/period being reported. 3 - Active listings at the end of the last day of the month/period being reported. 4 - Ratio of the average selling price to the average listing price for firm transactions entered into the TRREB MLS® system between the first and last day of the month/period being reported. 5 - Average Listing Days on Market (Avg. LDOM) refers to the average number of days sold listings were on the market. Average Property Days on Market (Avg. PDOM) refers to the average number of days a property was on the market before selling irrespective of whether the property was listed more than once by the same combination of seller and brokerage during the original listing contract period. 6 - Active listings at the end of the last day of the month/period being reported. 7 - Past monthly and year-to-date figures are revised on a monthly basis. 8 - SNLR = Sales-to-New Listings Ratio. Calculated using a 12-month moving average (sales/new listings). 9 - Mos. Inv. = Months of Inventory. Calculated using a 12-month moving average (active listings/sales). 2022 MONTHLY STATISTICS1,7 2021 MONTHLY STATISTICS1,7