Cfd simulation for wind comfort and safety

Concern towards the quality of public urban areas has increased in recent years. Wind comfort and safety in pedestrian areas has become one important environmental parameter when designing new cities. Hence, architects and town planners need guidelines and simplified design tools to take account of the wind in their projects. The objectives of this study provide more insight in the pedestrian living conditions around the Hub, a newly built structure, part of Coventry University campus and at the same time study the influence of building shapes on the wind distribution. The latter is based on a series of computational fluid dynamics simulations (CFD), used to advise the University’s Estates Department of the possibility of wind nuisance around the central campus area. The velocity field was computed using the finite volume method. The simulations were performed for different wind speeds and directions. The predicted results showed that the distribution of the velocity field varied and had different characteristics with different wind directions. Also, it was established that the wind speed amplification factors in diverging passages were generally larger than those in converging passages. The case study incorporated is intended to support and guide future studies of wind comfort and safety with CFD and thus makes a modest contribution in improving wind environmental quality in urban areas.

Recomendados
Recomendados
Más contenido relacionado
La actualidad más candente
La actualidad más candente (20)
Destacado
Similar a Cfd simulation for wind comfort and safety
Similar a Cfd simulation for wind comfort and safety (20)
Más de Mohamed Fadl
Más de Mohamed Fadl (6)
Último
Último (20)
Cfd simulation for wind comfort and safety
- 1. International Journal of Architecture, Engineering and Construction Vol 2, No 2, June 2013, 131-143 CFD Simulation for Wind Comfort and Safety in Urban Area: A Case Study of Coventry University Central Campus Mohamed Sakr Fadl1,∗ , John Karadelis2 1 Department of Civil Engineering, Architecture and Building, Coventry University, Coventry CV1 5FB, United Kingdom 2 Mechanical Engineering Department, Mansoura University, Mansoura 35516, Egypt Abstract: Concern towards the quality of public urban areas has increased in recent years. Wind comfort and safety in pedestrian areas has become one important environmental parameter when designing new cities. Hence, architects and town planners need guidelines and simplified design tools to take account of the wind in their projects. The objectives of this study provide more insight in the pedestrian living conditions around the Hub, a newly built structure, part of Coventry University campus and at the same time study the influence of building shapes on the wind distribution. The latter is based on a series of computational fluid dynamics simulations (CFD), used to advise the University’s Estates Department of the possibility of wind nuisance around the central campus area. The velocity field was computed using the finite volume method. The simulations were performed for different wind speeds and directions. The predicted results showed that the distribution of the velocity field varied and had different characteristics with different wind directions. Also, it was established that the wind speed amplification factors in diverging passages were generally larger than those in converging passages. The case study incorporated is intended to support and guide future studies of wind comfort and safety with CFD and thus makes a modest contribution in improving wind environmental quality in urban areas. Keywords: Computational fluid dynamics, pedestrian wind comfort, built environment and modelling DOI: 10.7492/IJAEC.2013.013 1 INTRODUCTION Pedestrian-level wind (micro)-conditions is one of the first microclimatic issues to be considered in modern city planning and building design (Wu and Kriksic 2012). The construction of a new building alters the microclimate in its vicinity; hence wind comfort and safety for pedestrians become important requirements in urban planning and design. Today, some city au- thorities request studies of pedestrian wind comfort and safety for new buildings and new urban develop- ments. High-rise buildings are particularly influential to wind effects. Therefore, information about wind flow patterns around buildings can be important to archi- tects and urban planners. As a result of the public’s growing awareness of the latest scientific and engineer- ing achievements, contemporary architects, designers and engineers should pay more attention in creating more comfortable and functional buildings and their surroundings. In particular, near and around high-rise buildings, high wind velocities are often introduced at pedes- trian level that can be experienced as uncomfortable, or sometimes even dangerous. Traditionally, wind flow at pedestrian level can be simulated in boundary-layer wind tunnels. However, with the advent of computa- tional power and the introduction of numerical meth- ods like the Finite Element Analysis, it is possible to accurately simulate the same conditions in a virtual environment using advanced modelling techniques like the Computational Fluid Dynamics (CFD). The latter can provide significant cost benefits for assessing and optimising engineering design solutions related to en- *Corresponding author. Email: ab4393@coventry.ac.uk 131
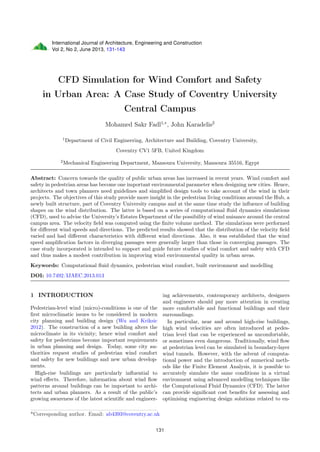
- 2. Fadl and Karadelis/International Journal of Architecture, Engineering and Construction 2 (2013) 131-143 vironmental concerns. CFD allows the investigator to analyze the full domain of the model, provides a com- plete picture of the problem and presents the results in an easy-to-understand graphical way, as opposed to relying on expensive and time consuming collection of several dozens of discrete points, as it is usually the case with physical wind tunnel modelling. CFD modelling has been used by enviro-metrics to assess comfort levels with respect to wind climate, based on evaluating the wind flow fields around buildings, as well as the asso- ciated outdoor thermal comfort, air ventilation, snow accumulation, rain infiltration and other microclimatic conditions (Stathopoulos and Baskaran 1996). Over the last two decades, along with the perfection of the CFD method, many researchers have concen- trated on the numerical simulations of air flow past a single building. Their studies revealed some compli- cated flow phenomena, such as separation, vortex shed- ding, recirculation and reattachment and predicted some accurate numerical results (Paterson and Apelt 1986; Murakami 1998; Bosch and Rodi 1998). Pedestrian-level winds can be described quite ade- quately in terms of mean velocities in the presence and absence of a new building within a specific urban en- vironment. Although it can be argued that pedestri- ans are mostly affected by gust effects and mean wind speeds may not be sufficient to cause results for con- cern, the fact remains that several major cities plan- ners require only the fulfilment of certain mean (sus- tainable) speeds with a specified probability of ex- ceedance (Stathopoulos 2006). The process of compar- ison between computational and experimental results has already been challenged and appears problematic on its own. For instance, is it more meaningful to carry out point-by-point comparisons or does it make more sense to examine pedestrian-level wind speeds affect- ing a particular zone or area of influence for a specific activity within the urban environment? 2 CLIMATE-RESPONSIVE DESIGN STRATEGIES Outdoor human comfort in an urban climate may be affected by a wide range of parameters, including wind speed, air temperature, relative humidity, solar radi- ation, air quality, human activity, clothing level, age, etc. Several criteria have been developed by the wind engineering community for evaluating only the wind- induced mechanical forces on the human body and the resulting pedestrian comfort and safety. There are sig- nificant differences among the criteria used by various countries and research institutions to establish thresh- old values for tolerable and unacceptable wind condi- tions even if a single parameter, such as the wind speed, is used as a criterion. These differences range from the speed averaging period (mean or gust) and its prob- ability of exceedance (frequency of occurrence) to the evaluation of its magnitude (experimental or compu- tational) (Blocken et al. 2012; Chronis et al. 2012; Mochida and Lun 2008; Blocken and Persoon 2009; Tominaga et al. 2008; Yoshie et al. 2007). The presence of tall buildings influences wind speeds at low level in their immediate surroundings. The ef- fects on the local microclimate may be favourable or unfavourable depending on the building shape, size, orientation and interaction with neighbouring build- ings or obstacles. The faster winds at high level may be deflected down to ground level by tall buildings causing unpleasant and even dangerous conditions for pedestrians. Wind may be channelled around build- ings, between buildings or along avenues causing accel- erated wind speeds at pedestrian level and giving rise to pedestrian discomfort. On the opposite end, suitably arranged tall buildings may provide sheltered areas for pedestrians, although this can lead to accumulation of traffic fumes and/or other pollutants, if there is insuf- ficient air circulation (wind speeds) (Tan et al. 2007; Figure 1. Regions of high surface wind speeds around a tall building 132
- 3. Fadl and Karadelis/International Journal of Architecture, Engineering and Construction 2 (2013) 131-143 Stathopoulos et al. 2004; Mohammadipour and Alavi 2009). 2.1 Typical Locations of Strong Wind in Built up Areas When a gust of wind strikes a tall building surface it tends to deflect towards the ground causing high speed winds on the windward side, as well as near the cor- ners of the buildings at street/pedestrian level. Based on strong wind, occurrences at pedestrian areas often occur at the three regions shown in Figure 1 and are as- sociated with the three types of flow (Emil and Robert 1996): 1. Type I : Vortex flow between buildings, near ground level (region A), 2. Type II: Descending air flows passing around lee- ward building corners (region B), 3. Type III. Air flows passing through openings (passages) at ground level connecting the wind- ward and leeward sides of buildings (region C). 2.2 Pedestrian Comfort Pedestrian comfort criteria are based on mechanical wind effects without consideration of other meteorolog- ical conditions (temperature, relative humidity). These criteria provide an assessment of comfort, assuming that pedestrians are appropriately dressed for a spec- ified outdoor activity during any given season. Five pedestrian comfort classes and their corresponding gust wind and speed ranges are used to assess pedestrian comfort. More specifically, the comfort classes, associ- ated wind speed ranges and limiting criteria are sum- marized in Table 1 based on information from (Shane 2011). 2.3 Lawson’s Pedestrian Comfort Criteria The acceptability of the wind conditions in an urban environment will always be, to some extent, subjec- tive. The following methodology, developed by Law- son (1990). It has been widely accepted and adopted for the investigations of the wind environment associ- ated with buildings in the UK. It compares well with international guidance. Locations in the areas of con- cern associated with the buildings must be assessed for both, comfort and safety. The first relates to the ac- tivity of the individual and the second to the level of distress experienced, based on information from Law- son (1990), the wind comfort criteria are summarized in Table 2. 2.4 Aim and Main Objectives of the Cur- rent Study The aim of this study is to provide a qualitative assess- ment of the student and pedestrian comfort and safety due to the likely wind conditions formulating around the main Coventry University campus and especially around the newly constructed Hub. The main objec- tives were set as follows: Table 1. Desirable pedestrian wind comfort classes for various location types Comfort Classes Description Location Types (Examples) Sitting Wwind ≤ 3.9m/s Occurrence: > 70% of the time. Outdoor Cafés, Patios, Terraces, Acceptable for sedentary activities, including sitting. Benches, Gardens, Fountains, Monuments. Standing Wwind ≤ 6.1m/s Occurrence: > 80% of the time. Building Entrances, Exits Acceptable for standing, strolling, etc. Children’s Play Areas Walking Wwind ≤ 8.3m/s Occurrence: > 80% of the time. Public/Private Sidewalks, Pathways, Acceptable for walking, or rigorous activities Public/Private Vehicular Drop-Off Zones Uncomfortable Wwind > 8.3m/s Occurrence: > 20% of the time. Unacceptable for walking Dangerous Wwind > 25m/s Occurrence: > 0.01% of the time. Dangerous to walk Table 2. Lawson pedestrian comfort criteria Lawson Comfort Mean Wind Velocity Tolerable Tolerable Classification Range (m/s) Location Activity 5 0-2 Seating areas in open air cafes, parks Pedestrians sitting for a long time and wind velocity in the vicinity of entrance doors 6 and 7 2-6 Entranced to buildings Standing or sitting for a short time 8 6-8 Pedestrian footpaths, public spaces, shopping areas Pedestrian walking, e.g. strolling and sight- seeing 9 8-10 Around buildings People at work (maintenance deliveries) 10 10-12 Roads and car parks Fast pedestrian waling, e.g. waling to a desti- nation and cycling 133
- 4. Fadl and Karadelis/International Journal of Architecture, Engineering and Construction 2 (2013) 131-143 1. To investigate the typical wind patterns around the Hub and the resulting wind environment at pedestrian level and to detect the so called “criti- cal areas” and classify them according to Table 1, below. 2. To identify the origin (source) of possible causes of undesirable wind conditions. 3. In essence, to assess and quantify the wind gener- ated around the campus and specifically near and around the Hub and to advice on the effect this predicted wind may have on the neighbourhood. 4. To generalise the findings by analysing, com- menting and, if appropriate, revise certain wind comfort criteria to suit the requirements for busy city life and business usage. 3 MODELLING OF PROBLEM Coventry University has changed dramatically in the last few years. Among several new buildings, The Hub distinguishes as it creates an architectural as well as an environmental impact to the City of Coventry. The particular building claims very high standards such as low carbon footprint, low energy consumption (first class insulation), flexibility in its use, functionality (minimum number of columns), etc. However, none has considered the effect this building has or has-not on their occupants, such, as students and other pedestri- ans outside and around it. Hence, the relation between wind effects, wind comfort, wind danger and wind (lo- cal) climate may be of interest. Using the Fluent Code (Fluent Inc. 2007), the wind generated around the campus and specifically near and around The Hub will be assessed and quantified. The typical wind flow pattern around the aforementioned building and the related wind environment at pedes- trian level will be investigated and discussed. Useful comments will be drawn on the effect this predicted wind may have on the neighbourhood. Online nugget diameter control system for resistance spot welding The CFD simulations were performed using the com- mercial CFD code Fluent and the 3D steady RANS equations. Closure was provided by the realisable (k − ε) turbulence model (Shih et al. 1995) The choice of this turbulence model was based on recommenda- tions by (Franke et al. 2004) and on earlier success- ful validation studies for pedestrian-level wind condi- tions (Blocken and Persoon 2009) and (Blocken et al. 2004). Pressure velocity coupling was taken care off by the SIMPLE algorithm (Launder and Spalding 1974). Second order discretisation schemes were used for both the convection terms and viscous terms of the govern- ing equations. Simulations were performed for four wind directions (0◦ , 90◦ , 180◦ , and 270◦ ). The latter were deemed to be sufficient to cover the most oner- ous conditions. The iterations were terminated when the scaled residuals showed very little further reduction with increasing number of iterations. The minimum residuals values were reached 10−8 for x, y, z-velocity components, 10−7 for (k − ε) and 10−6 for continuity. 3.1 Assumptions Various articles recommend the following generalised boundary conditions for the simulation limits (Franke et al. 2004; Blocken et al. 2004): 1. Symmetries on the edges and the upper surface of the volume. 2. Pressure-outlet for the boundary leaving the sim- ulation volume. 3. Variation of the wind speed profile with height, at the air entrance of the simulation field. 4. Adoption of the wall function model for the treat- ment of cells near solid walls. 3.2 Numerical Implementation For treatment of areas close to “wall” surfaces such as ground or building facades, there are two calculation models in Fluent. Considering the complexity of our simulations, the criterion for the choice of the “wall function” model was based on the coarse mesh imple- mentation, as opposed to that of the “two-layer ap- proach”, hence, economising on the resources available in Fluent. Essentially, for studies related to wind com- fort at pedestrian level, it is appropriate to use smooth surfaces for ground and buildings (zero height of rough- ness). The total numbers of grid elements used in sim- ulation are 355187. Figure 2. Inlet mean wind speed profiles in the CFD simulation 134
- 5. Fadl and Karadelis/International Journal of Architecture, Engineering and Construction 2 (2013) 131-143 Table 3. Lawson pedestrian comfort criteria Turbulence Model Standard k − ε Model Inlet U = Ug( Z Zg )α , k = u2 ∗√ Cµ , Cµ = 0.09, (z) = u3 ∗ kz , k = 0.41 Outlet Gauge pressure=0 Bottom Smooth wall, using the log-law wall function, (Wall function) Top Free slip, flux normal to the boundary is zero, symmetric boundary conditions is applied Sides Free slip, flux normal to the boundary is zero; symmetric boundary conditions is applied 3.3 Boundary Conditions The approaching wind was created from a power-law model to approximate the mean velocity profile: U = Ug( Z Zg )α (1) where U = mean wind speed, Ug = gradient wind speed, Z = high above ground, Zg = depth of the boundary layer (gradient height, Zg = 40 m), and α = power law exponent. The exponent α varies accord- ing to the type of terrain; α = 0.14, 0.25 and 0.33 for open country, suburban and urban exposures respec- tively. All calculations in this article were based on the value of α = 0.14 (Aynsley et al. 1977; He and Song 1999). The variation of the inlet velocity at inlet is shown in Figure 2. Since the k − ε model was used, the values of k − ε were required to account for the turbulence in the ap- proaching wind. The turbulent kinetic energy k can be calculated if the turbulence intensity at a given height is known, α, the turbulence intensity of the inlet veloc- ity profile is assumed to follow the Gaussian distribu- tion with a standard deviation of α = 0.15. k = 3 2 (U × I)2 (2) where k is the von Kaman constant (k =0.41). The other important value required is the dissipation rate ε; which can be obtained from the assumption that the wind is neutrally stratified and homogeneous in the surface layer, where the rate of energy production is approximately equal to its dissipation rate, therefore (z) = u3 ∗ kz (3) where u∗ is the friction velocity. The u∗ was calculated from k = u2 ∗ Cµ (4) Based on Eq. (2) and Eq. (4), the boundary conditions applied in the computing domain are summarized as Table 3. 3.4 Local Meteorological Data for Coven- try The average annual local atmospheric wind conditions for Coventry are shown in the wind-rose plotted in Fig- ure 3, This is based on historical Meteorological Office data taken from Coventry (Coleshill) and measured over a 7-years period. It is obvious that southerly winds dominate throughout the year, with easterly winds being particularly infrequent (Cameron Taylor Bradford Inc. 2005). Figure 3. Historical wind-rose for Coventry (Coleshill) 135
- 6. Fadl and Karadelis/International Journal of Architecture, Engineering and Construction 2 (2013) 131-143 (a) A view of the pedestrian area between the Hub and James Starley building (b) Coventry University central campus map. The position of the Hub and James Starley building is shown relative to each other. (c) Main dimensions of the buildings considered. (d) Finite volume (surface) mesh of the two build- ings. Figure 4. Geometrical and computational grid of the case study 4 CASE STUDY The area under study is shown on the Coventry Uni- versity campus. Figure 4 depicts the top and iso-views with overall dimensions of the main building (Hub B1, B2) and the building height of 20 m. 5 VELOCITY DISTRIBUTION FOR WIND FLOW AROUND BUILDINGS The velocity stream lines around the building were studied using the CFD method. The results were pre- sented for the mean wind speed, Vmean, at a pedes- trian height of 1.5 m from ground level. The basic re- sults from the CFD simulations for the proposed new building are presented in Figures 5 - 8. These figures show plan views of head level velocity streamlines for prevailing wind speeds varying from 2 m/s to 16 m/s. 5.1 North Direction Figure 5, northerly wind direction, shows wind velocity above the prevailing wind speed especially between the two main blocks. This creates an extended shelter zone behind the buildings but also creates problems because pedestrian wind discomfort arise underneath the main building (Hub). The wind flow pattern at pedestrian level between the two buildings is shown quite complex with recirculation areas behind the buildings and large velocity gradients near the main building, B1 (see Fig- ure 4(d)). In addition, the leeward side of the building, shows the formation of eddy flow (eddy currents devel- oping), at the point where the two air streams meet, following earlier splitting at the windward side. This eddy flow is closer to the short side of the building. 136
- 7. Fadl and Karadelis/International Journal of Architecture, Engineering and Construction 2 (2013) 131-143 Figure 5. Wind stream-line at pedestrian level (1.5 m above the ground) of the area surrounding the Hub (North direction) 137
- 8. Fadl and Karadelis/International Journal of Architecture, Engineering and Construction 2 (2013) 131-143 Figure 6. Wind stream line at the pedestrian level (1.5 m above the ground) of the area surrounding the Hub (East direction) 138
- 9. Fadl and Karadelis/International Journal of Architecture, Engineering and Construction 2 (2013) 131-143 Figure 7. Wind stream-line at pedestrian level (1.5 m above the ground) of the area surrounding the Hub (West direction) 139
- 10. Fadl and Karadelis/International Journal of Architecture, Engineering and Construction 2 (2013) 131-143 Figure 8. Wind stream-line at pedestrian level (1.5 m above the ground) of the area surrounding the Hub (South direction) 140
- 11. Fadl and Karadelis/International Journal of Architecture, Engineering and Construction 2 (2013) 131-143 Figure 9. Wind rose diagram for mean wind speed at pedestrian level; points 1,2 and 3 Figure 10. Area between the Hub and James Starley (building B3) before and during vegetation works 5.2 East Direction In the case of East wind direction (Figure 6), near the entrances to the buildings, the wind speed increases owing to the narrow pass between buildings B1 and B3 (Bernoulli’s Principle). The most notable point to ob- serve is the presence of local wind velocity above the prevailing wind speeds (indicated by the yellow lines) near all corners and between building blocks. The dis- tribution of velocity around the building proves that the air also splits at the windward side and meets at the leeward side of building B3. The maximum veloc- ity is present at the front corner of building B3 and at pedestrian level. 5.3 North Direction When the wind is blowing from West (Figure 7), the velocity streamlines build up in the area surrounded by buildings B1 and B2 and the most affected zones are the corners of the upstream in building B1. at the student pedestrian, the wind speed accelerate by 40% higher than wind velocity can occur compared to the reference wind speed at the pedestrian height. 5.4 South Direction For Southerly winds (Figure 8), the most affected zones are the area surrounding buildings B1 and B2 due to the Venturi effect leading to wind speed accelerated by 40%. Also, at the building coroners, the wind speed exceed by 50-60% those at reference wind speed. 6 ASSESSMENT OF WIND COMFORT AND SAFETY In order to evaluate the wind comfort in pedestrian, Figure 9 shows CFD results at selected points between buildings B1 and B3 (labelled as: 1, 2 and 3), at pedes- trian level. It demonstrates that the peak “pedestrian” wind speeds are higher when the wind direction is from North, South and East, rather than West. This is be- cause building B3 acts as an obstacle to westerly cur- rents. Also, when the wind direction is from the North or South, it is clear that wind speeds at point 2, in the middle and near the end of pedestrian path, are greater than that at point 1, for all wind speed values. Yet, when the wind blows from East, point 3 has the lower peak value because of the location of building 2. It is apparent that the identification of origin caus- ing undesirable wind comfort depends on the building 141
- 12. Fadl and Karadelis/International Journal of Architecture, Engineering and Construction 2 (2013) 131-143 design. So, optimisation of wind comfort to suit the requirements for city life and commercial usage can be important. In general, solving a wind nuisance problem after the design has been finalized can be difficult, expensive and not very effective. Hence, wind environmental condi- tions should be taken into account during the design stage. Combining architectural design with considera- tions for acceptable wind climate is often difficult. Af- ter reading the report produced from this study the University’s Estates Department took the results under consideration. It was decided to introduce vegetation with plants and trees in an effort to “break” the wind and decrease the velocity at key areas specified in the study (Figure 10). 7 CONCLUSION This article has presented a CFD simulation for the evaluation of pedestrian wind comfort and safety in urban areas. The use of CFD in assessing and optimis- ing engineering design solutions related to environmen- tal concerns has been demonstrated through the case study. From the preceding discussions, the following conclusions can be made: 1. CFD is a powerful tool for evaluating critical ef- fects of wind around buildings from the pedestri- ans’ comfort point of view. It can also help to quantify wind discomfort levels. 2. When two or more buildings are constructed in proximity, the fluid flow surrounding the build- ings may be significantly deformed and of a sig- nificantly more complex nature than usually as- sumed and needs to be investigated as early as the planning stage of the project. 3. Knowing the strong dependence of comfort on velocity and turbulence, it is of practical inter- est to study these flow features associated with certain building arrangements, typical of urban areas and hence assess the comfort conditions on the neighbour pedestrian circulations. 4. Solving a wind nuisance problem after the design has been finalized may be time consuming and costly. Therefore, it is stressed that wind en- vironmental conditions should be taken into ac- count before the design stage begins and the lay- out of buildings should be decided accordingly. REFERENCES Aynsley, R. M., Melbourne, W., and Vickery, B. J. (1977). Architectural Aerodynamics. Applied Science Publishers, London, United Kingdom. Blocken, B., Janssen, W. D., and van Hooff, T. (2012). “CFD simulation for pedestrian wind comfort and wind safety in urban areas: General decision frame- work and case study for the Eindhoven University campus.” Environmental Modelling and Software, 30, 15–34. Blocken, B. and Persoon, J. (2009). “Pedestrian wind comfort around a large football stadium in an urban environment: CFD simulation, validation and appli- cation of the new dutch wind nuisance standard.” Journal of Wind Engineering and Industrial Aerody- namics, 97(5-6), 255–270. Blocken, B., Roels, S., and Carmeliet, J. (2004). “Mod- ification of pedestrian wind comfort in the silver- top tower passages by an automatic control system.” Journal of Wind Engineering and Industrial Aerody- namics, 92(10), 849–873. Bosch, G. and Rodi, W. (1998). “Simulation of vortex shedding past a square cylinder with different turbu- lence models.” International Journal for Numerical Methods in Fluids, 28(4), 601–616. Cameron Taylor Bradford Inc. (2005). Pedestrian Wind Comfort Study. Coventry, United Kingdom. Chronis, A., Liapi, K. A., and Sibetheros, I. (2012). “A parametric approach to the bioclimatic design of large scale projects: The case of a student housing complex.” Automation in Construction, 22, 24–35. Emil, S. and Robert, S. (1996). Wind Effects on Struc- tures. John Wiley and Sons, Canada. Fluent Inc. (2007). FLUENT Users Manual of FLU- ENT Software Package. Fluent Inc., Lebanon, New Hampshire, United States. Franke, J., Hirsch, C., Jensen, A. G., Krus, H. W., Schatzmann, M., Westbury, P. S., Miles, S. D., Wisse, J. A., and Wright, N. G. (2004). “Recom- mendations on the use of CFD in wind engineering.” Proceedings of the International Conference Urban Wind Engineering and Building Aerodynamics, J. P. A. J. vanBeeck, ed., von Karman Institute, Belgium. He, J. and Song, C. C. S. (1999). “Evaluation of pedes- trian winds in urban area by numerical approach.” Journal of Wind Engineering and Industrial Aerody- namics, 81(1-3), 295–309. Launder, B. E. and Spalding, D. B. (1974). “The numerical computation of turbulent flows.” Com- puter Methods in Applied Mechanics and Engineer- ing, 3(2), 269–289. Lawson, T. V. (1990). The Determination of the Wind Environment of a Building Complex before Construc- tion. Report Number TVL 9025, Department of Aerospace Engineering, University of Bristol, Bris- tol, United Kingdom. Mochida, A. and Lun, I. Y. F. (2008). “Prediction of wind environment and thermal comfort at pedestrian level in urban area.” Journal of Wind Engineering and Industrial Aerodynamics, 96(10-11), 1498–1527. Mohammadipour, A. H. and Alavi, S. H. (2009). “The optimization of the geometric cross-section dimen- sions of raised pedestrian crosswalks: A case study in Qazvin.” Accident Analysis and Prevention, 41(2), 314–326. Murakami, S. (1998). “Overview of turbulence models 142
- 13. Fadl and Karadelis/International Journal of Architecture, Engineering and Construction 2 (2013) 131-143 applied in CWE - 1997.” Journal of Wind Engineer- ing and Industrial Aerodynamics, 74-76, 1–24. Paterson, D. A. and Apelt, C. J. (1986). “Computa- tion of wind flows over three - dimensional build- ings.” Journal of Wind Engineering and Industrial Aerodynamics, 24(3), 193–213. Shane, F. (2011). Pedestrian Level Wind Study. Toronto, Ontario, Canada. Shih, T., Liou, W. W., Shabbir, A., Yang, Z., and Zhu, J. (1995). “A new k-ε eddy viscosity model for high reynolds number turbulent flows.” Computers and Fluids, 24(3), 227–238. Stathopoulos, T. (2006). “Pedestrian level winds and outdoor human comfort.” Journal of Wind Engineer- ing and Industrial Aerodynamics, 94(11), 769–780. Stathopoulos, T. and Baskaran, B. A. (1996). “Com- puter simulation of wind environmental conditions around buildings.” Engineering Structures, 18(11), 876–885. Stathopoulos, T., Wu, H., and Zacharias, J. (2004). “Outdoor human comfort in an urban climate.” Building and Environment, 39(3), 297–305. Tan, D., Wang, W., Lu, J., and Bian, Y. (2007). “Re- search on methods of assessing pedestrian level of service for sidewalk.” Journal of Transportation Sys- tems Engineering and Information Technology, 7(5), 74–79. Tominaga, Y., Mochida, A., Yoshie, R., Kataoka, H., Nozu, T., Yoshikawa, M., and Shirasawa, T. (2008). “AIJ guidelines for practical applications of CFD to pedestrian wind environment around buildings.” Journal of Wind Engineering and Industrial Aerody- namics, 96(10-11), 1749–1761. Wu, H. and Kriksic, F. (2012). “Designing for pedes- trian comfort in response to local climate.” Journal of Wind Engineering and Industrial Aerodynamics, 104-106, 397–407. Yoshie, R., Mochida, A., Tominaga, Y., Kataoka, H., Harimoto, K., Nozu, T., and Shirasawa, T. (2007). “Cooperative project for CFD prediction of pedes- trian wind environment in the architectural institute of Japan.” Journal of Wind Engineering and Indus- trial Aerodynamics, 95(9-11), 1551–1578. 143