
Recomendados
Recomendados
Más contenido relacionado
La actualidad más candente
La actualidad más candente (20)
Similar a Single beam spectrophotometer
Similar a Single beam spectrophotometer (20)
Último
Último (20)
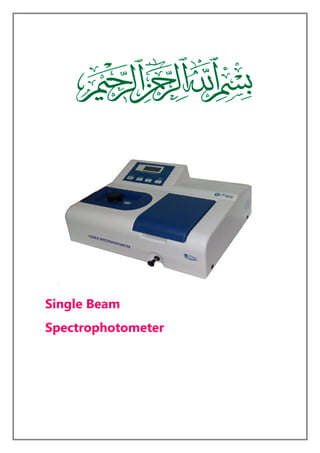
Single beam spectrophotometer
- 2. Township Campus,Lahore Submitted to: Dr.Mehr-un-Nisa Submitted by: Muhammad Kashif (mcf 1700986) M.Kamran Nazir (mcf1701055) Nabeel Ahmed (mcf1701195) Sohaib Arshad (mcf1701178) Abdul-Qadeer (1701258) Programme: M.Sc Chemistry(E) Semester I Subject: Advance analytical Chemistry Course code: CHEM3114
- 3. Contents: .History and Introduction .Constuction and Instrumentation .Working .Applications & Advantages .References The History of Spectrophotometer A spectrophotometer measures either the amount of light reflected from a sample object or the amount of light that is absorbed by the sample object. It is a device to measure the brightness of various portions of a spectra. Spectrophotometry is the study of the spectra, this study is built upon the belief that each chemical element has its own spectrum. The spectrophotometer was invented in 1940, by Arnold J. Beckman and his colleagues at National Technologies Laboratories, the company Beckman had started in 1935. They were led by project leader Howard H. Cary. The spectrophotometer was the company's greatest discovery. Before 1940, the chemical analysis process was a long venture taking weeks to complete with only 25 percent accuracy according to the MIT's "Inventor of the Week" archive. In 1940, when the Beckman DU Spectrophotometer was introduced, it simplified the process greatly, requiring only a few minutes for analysis. According to the same source, this test offered 99.99 percent accuracy on the analysis . This instrument set the standard in chemical analysis[1] .
- 4. In the beginning there were performance issues with the spectrophotometer. These problems led to changes in design. The model B spectrophotometer used a quartz prism instead of a glass prism this improved the UV capabilities of the device. Model C soon followed with changes that raised wavelength resolution in the UV and three subsequent Model C spectrophotometers were made. In 1941 the Model D, also known as the Model DU, was produced with a hydrogen lamp and other improvements. This design remained essentially unchanged from 1941 to 1976 when it was discontinued[2] . In 1981 Cecil Instruments produced a spectrophotometer that was microprocessor controlled. This automated the device and improved the speed. This spectrophotometer was more reliable than others made in this era. From 1984 to 1985, development was made in double beam versions of the instrument which developed into the Series 4000 model. With the 1990s came the addition of external software that provided PC control and onscreen displays of the spectra. Today,the development of the spectrophotometer continues and its applications range from science and medicine to crime scene investigation and law enforcement. The DR/4000 Spectrophotometer is a powerful scanning spectrophotometer that gives you advanced capabilities and performance. It has ultraviolet and visible spectrum analysis capabilities with a range of 190 to 1100 nm, customer calibration, kinetics, time course and multi wavelength readings capabilities Introdution This is called as single beam spectrophotometer because all the measuresments are based on the varying intensity of a single beam of light in single optical path. The primary advantage is that it has fewer component and is less complicated than alternative design. Hence, it is easier to construct and less expensive.With a single path and a minimum
- 5. number of optical components single-beam system typically provide very high light throughput. The primary limitation is that it provides no means to compensate for instrumental variations during an analysis such as change in source intensity. The resulting signal variability can limit the proformance capabilities of a single beam system. UV-VIS 230 UV-Visible Spectrophotometer is the one of the best single beam spectrophotometer still availble in the market and it ha high efficiency. The UV 230 is an intelligent ultra-violet/visible spectrophotometer that is well suited to the qualitative and quantitative analyses required by today's laboratories. With its wide wavelength range and narrow bandwidth design, the instrument provides extraordinary flexibility and high resolution at an exceptional price. It features a standard printer port for hard copy. The UV- Vis Spectrophotometer also features power interruption protection, easy operation[3] . The UV/Vis Spectrophotometer operates over a wavelength range of 190 - 1100 nm with a 5nm bandwidth. The spectrophotometer features a standard printer port and a standard RS- 232 serial port. The UV/VIS 230 has the capacity to analyze up to four cells. .Instrumentation and Construction: Spectronic 20 is designed for use in the visible region of the spectrum. It consisits of following parts:
- 6. 1.Tungsten lamp Tungsten lamp is a major source of providing light.It is linked with the photo tube which is used to measure intensity of light.The light is emitted from this lamp and is entered in the entrance slit. 2.Diffraction Gratting Light rays pass through objective lens and strike with the diffraction grating.Diffraction grating is used as a barrier and it is linked with the wavelength cam which is used to adjust its position. 3.Light control: Light control is basically a metal rod which is used to adjust the wavelength of rays.It is linked with the an occluder.An occluder is situated on the upper side of light control. 4.Sample It consists of solute and solvent but its major part consists of solute.Zero reading shows solvent and final reading is the reading of the solute.Zero reading on the right side is used for the solvent and reading of solute is obtained on the digital reader. 5.Photo detector Photo detector is used to convert electromagnetic waves into electrical waves.They are also present in our eyes.They pass electrical rays towards the amplifier..Amplifer enhances the power of the photo rays. 6.Digital reader: It is used to show the final reading of electrical rays (light rays).And final reading is obtained from right to left side of the reader[4] . Range of spectronic 20 spectrophotometer: The range of the above mentioned spectrophotometer is from 340 nm to 950 nm and accuracy of wavelength is + 2.5 nm (Picture of instrument is given on next page).
- 7. Wavelength CamLight Control SampleMeasuring Phototube Filter Occluder Diffraction Grating LampReference Phototube Objective Lens Entrance Slit Field Lens Light Gate Diagram: Internal instumentation of spectronic 20 Diagram: General construction of single beam spectrphotometer
- 9. SPECTRONIC 20 Spectrophotometer The sequence for sample measurement is: a. Select wavelength using Wavelength Control. b. With sample compartment empty and cover closed, adjust Zero Control so that the meter reads zero (on the left side of the dial). c. Insert reference blank into the sample compartment and setAbsorbance Control to zero (onthe right side of the dial). d. Insert unknown sample into the sample compartment and read measurement from meter in percent transmittance or absorbance[5] .
- 10. General Working : A lamp provides the source of light. The beam of light strikes the collimator or lens.The lens then makes these radiations parallel and fall them on the prism or sometimes diffraction grating(In optics, a diffraction grating is an optical component which splits and diffracts light into several beams travelling in different directions.).The prism or grating then separates the light into its component wavelengths. The grating is rotated so that only a specific wavelength of light reaches the exit slit.(The entrance slit,prism and exit slit collectively form the monochromator).Then the light interacts with the sample placed in the transparent cuvette.Here some of the amount of light is absorbed by the sample solution placed in the cuvette.Then the light that is not absorbed by the sample strikes with detector where its transmittance is measured.Transmittance refers to the amount of light that passes through the sample. Absorbance is a measurement of light that is absorbed by the sample. The detector senses the light being transmitted through the sample and converts this information into a digital value as shown in figure[6] . Prism splittinglight Wavelengthof differentcolours of visible light
- 11. .Why some of light is absorbed by the sample solution? Some amount of light that is coming from the exit slit is absorbed by the sample solution.The reason is that the electrons of the molecues present in the sample solution absorb some specific amount of energy from the photons of the light which have specific wavelength and go into an excited state i.e into higher energy level.In this way,light energy is converted into heat energy[7]. In this way electrons are promoted to a higher energy molecular orbital after absorbing that monochromatic light. Explanation according to Beer-Lambert’s Law: Spectrophotometers work on the principle of Beer-Lambert’s law.With the help of this law,one calculate the Transmittance of light.And so,absorbance can also be calcultulated. Transmittance: The ratio of intensities of the transmitted and incident light gives transmittance. In other words, Transmittance is the amount of light energy that is transmitted through the solution without absorbing.It is measured in percantage T(i.e % transmittance)[8] . Transmittance = IT/I0 × 100
- 12. Where IT = Intensity of transmitted light through the sample And I0 = Intensity of the incident light (i.e blank cuvette having pure water ) A 100 % value of T represents a transparent substance present in the cuvette while zero value of T represents that object is totally opaque meaning that it has absorbed all wavelength of light and has not transmitted any wavelength of light. Absorbance: Absorbance is the amount of energy of specific wavelength in terms of photons that is absorbed by the electrons of molecules present in the sample.It is given as: Absorbance : -log10T We can also write it as : -log10 IT/I0 Here T resents the transmittance of a substance[4]. Beer-Lambert’s Law is given as: Absorbance ∝ b .c A= ε.b.c Where ‘ε’ is propotionality constant known as molar absoptivity coefficient.We can also use here ‘a’ which means same thing.“b” is the path length and “c” is the concentration of the sample. This equation states that the quantity of light absorbed by a substance dissolved in a fully transmitting solvent is directly proportional to the concentration of the substance (i.e ‘c’) and the path length (i.e b ) of the light through the solution. It means that if there is more path length (i.e ‘b’) of the cuvette in which sample is placed,more absorbance of light will take place and as a result less transmission
- 13. will be obtained.Because more distance has to be covered by the photons of light while passing through the solution and there will be more interaction between the photons and absorbing substances.Hence they will be absorbed more (i.e their energy will be taken up and absorbed by the electrons of the absorbing molecules).And less transmittance will be obtained. Similarly If there is more concentration ( i.e c) of absorbing materials in the sample of cuvette,the result will be the same(meaning more absorbance and less transmittance)[9] . Units: In uv spectroscopy,the concentration c of the sample solution is measured in mol L-1 and the Path length b of the light path in cm. Thus, given that absorbance is unitless, the units of molar absorptivity ε are L mol-1 cm-1.[10] c = mol L-1 b = cm ε = L mol-1 cm-1 EXAMPLE: Guanosine has a maximum absorbance of 275 nm.ϵ275= 8400M−1 cm−1 .ϵ 275=8400M−1 cm−1 and the path length is 1 cm. Using a spectrophotometer, we find that A275=0.70. What will be the concentration of guanosine[11] ? SOLUTION: Since, Absorbance = A = 0.70 Molar absoptivity =ϵ =8400 M-1 cm-1 ) Path length = b = l=1cm Concentration =c= ? To solve this problem, we use Beer's Law.
- 14. A =ϵlc 0.70 = (8400) (1 cm) Next, divide both side by [(8400 ) (1cm)],we get the answer c = 8.33x10⁻⁵ mol/L Graph: We can plot a graph between concentration and absorbance.Drawing Concentration in mol L-1 on X-axis and absorbance on Y-axis.A straight line is obtained which indicates that as concentration of a sample is increased,absorbance also increases in the the same ratio.Similarly graph between path length b and absorbance c can be plotted[12]. Graph 1:Graph between concentration c (in molL-1 ) and absorbance A(no units) indicating directly proportional relation.
- 15. Graph 2: Graph between pathlength b (or c) in cm absorbance A. > Applications of Single Beam Spectrophotometer Before the spectrophotometer was developed scientists had no reliable and rapid method to determine the chemical makeup of a substance. Spectrophotometer radically changed all of that. Some applications of spectrophotometer are given as 1. It is used extensively in astronomy 2. It is also used in archeology 3. It is used to determine the deviation of light by a glass prism 4. It is used to determine refractive index 5. It is used to study the chemical bonding and to determine concentrationof substances(nucleic acid for example which do not absorb visible light) 6. Spectrophotometers are used to identify the unknown compounds 7. It is used to study atmosphere of distant planets 8. They are also used in chemistry to find out which chemicals are present in chemical samples 9. Spectrophotometers can also be used for colour determination within range of 380-700nm 10. It is also used in forensic sciences for investigation purposes 11. It is also used in microbiology to study of micro-oragnisms likebacteria 12. It is also used in pharmaceutical , food and paint industries 13. It is used in the diagnosis of diseases which is detected by the samples taken from the body are analysize in three areas Chemistry , Hematology and microbiology
- 16. 14. It is used to explain absorbance vs time graph in kinetics 15. It is used in the single point calibration for equilibrium constant determination 16. It is also used in quantitative analysis of organic compounds 17. It is also used for study the progress of a chemical reaction Advantages and disadvantages :- There are following advantages of single beam spectrophotometer It has simple construction It has less complicated system It is easy to use It is not very much expensive It has fewer parts which can be easily handled It has high light throughput It measures accurately There are following disadvantages of single beam spectrophotometer It consumes much time as compare to other designs We cannot make variations during experiment References: 1.The Journal of Biological Chemistry A Classic Instrument 2. Beckman DU Spectrophotometer and Its Inventor, Arnold Inventor of the Week Archive: Arnold Beckman 3. Cecil Instruments: History of Cecil Instruments 4. Analytical Chemistry by D.A Skoog,D.M West F.J Holler and S.R Crouch,,8th edition 5. https://web.stanford.edu/class/chem184/lectures08/Zare_Spectroscopy 6.https://www.lsteam.org/projects/videos/how-does-spectrophotometer- work