2016 Dealership Workforce Study
•
2 recomendaciones•456 vistas

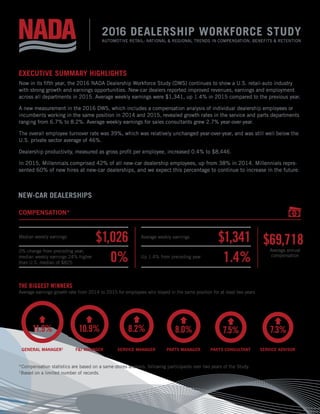
Now in its fth year, the 2016 NADA Dealership Workforce Study (DWS) continues to show a U.S. retail-auto industry with strong growth and earnings opportunities. New-car dealers reported improved revenues, earnings and employment across all departments in 2015. Average weekly earnings were $1,341, up 1.4% in 2015 compared to the previous year.

Recomendados
Recomendados
Más contenido relacionado
Similar a 2016 Dealership Workforce Study
Similar a 2016 Dealership Workforce Study (20)
Más de National Automobile Dealers Association
Más de National Automobile Dealers Association (10)
Último
Último (20)
2016 Dealership Workforce Study
- 1. 2016 DEALERSHIP WORKFORCE STUDY AUTOMOTIVE RETAIL: NATIONAL & REGIONAL TRENDS IN COMPENSATION, BENEFITS & RETENTION THE BIGGEST WINNERS Average earnings growth rate from 2014 to 2015 for employees who stayed in the same position for at least two years Ç 7.3% Ç 7.5% Ç 8.0% Ç 8.2% Ç 10.9% Ç 11.9% COMPENSATION* EXECUTIVE SUMMARY HIGHLIGHTS Now in its fifth year, the 2016 NADA Dealership Workforce Study (DWS) continues to show a U.S. retail-auto industry with strong growth and earnings opportunities. New-car dealers reported improved revenues, earnings and employment across all departments in 2015. Average weekly earnings were $1,341, up 1.4% in 2015 compared to the previous year. A new measurement in the 2016 DWS, which includes a compensation analysis of individual dealership employees or incumbents working in the same position in 2014 and 2015, revealed growth rates in the service and parts departments ranging from 6.7% to 8.2%. Average weekly earnings for sales consultants grew 2.7% year-over-year. The overall employee turnover rate was 39%, which was relatively unchanged year-over-year, and was still well below the U.S. private sector average of 46%. Dealership productivity, measured as gross profit per employee, increased 0.4% to $8,446. In 2015, Millennials comprised 42% of all new-car dealership employees, up from 38% in 2014. Millennials repre- sented 60% of new hires at new-car dealerships, and we expect this percentage to continue to increase in the future. NEW-CAR DEALERSHIPS Average annual compensation $69,718Median weekly earnings $1,026 0% change from preceding year; median weekly earnings 24% higher than U.S. median of $825 0% Average weekly earnings $1,341 Up 1.4% from preceding year 1.4% *Compensation statistics are based on a same-stores analysis, following participants over two years of the Study. 1 Based on a limited number of records. GENERAL MANAGER1 F&I MANAGER SERVICE MANAGER PARTS MANAGER PARTS CONSULTANT SERVICE ADVISOR
- 2. 2016 DEALERSHIP WORKFORCE STUDY AUTOMOTIVE RETAIL: NATIONAL & REGIONAL TRENDS IN COMPENSATION, BENEFITS & RETENTION TURNOVER AND RETENTION Total turnover increased from 39.3% to 39.6%-still under the private-sector average of 46%. Turnover varied by region and luxury/ non-luxury dealerships; sales consultant position had the highest turnover rate. DEMOGRAPHICS Women comprised 18.6% of employees in new-car dealerships. 18.6% Women were 20% of new hires. 20% 89.3% in office and administrative support positions; service advisor and F&I manager had the highest female ratio among key posi- tions at 17% and 16% respectively. 89.3% Female turnover up 2 points to 43% (male turnover 39%). 43% Millennials comprised 42% of employees in new-car dealerships. 42% Total Millennials employed in U.S. workforce 34% (estimate). 34% Millennials were 60% of all new hires— many in sales consultant and service technician positions. 60% Millennial turnover down 2 points to 52%. 52% WOMEN MILLENNIALS Enrollment for the 2017 Dealership Workforce Study opens December 14, 2016 at nadaworkforcestudy.com. The 2017 Study closes April 28, 2017. For questions: WorkforceStudy@nada.org or 800.557.6232. SALES CONSULTANT 39% CURRENT NATIONAL 67% 46% ONE-YEAR RETENTION 71% THREE-YEAR RETENTION 45%Employees reach peak productivity at three years.