SlideShare una empresa de Scribd logo
1 de 1
Descargar para leer sin conexión
The development of a reliable and feasible measure of school children's
                                                  fruit and vegetable consumption
                                                        Jennifer C Taylor, BS, Bethany A Yon, PhD and Rachel K Johnson, PhD, MPH, RD
                                                            Nutrition and Food Sciences Dept., University of Vermont, Burlington, VT
                            ABSTRACT                                                                                METHODS                                                                                               PRELIMINARY RESULTS
Most children fail to meet recommended intakes for fruits and vegetables         •    A research team of undergraduate nutrition students (n=19) completed                                                                             Inter-observer Reliability
(F/V). Farm to School programs have been proposed as a strategy to                    12 hours of training on three methods for measuring children’s F/V
increase consumption of these foods, but methodology is needed that can               consumption during school lunch: weighed plate waste (WPW), direct                                                                     Raters                Intraclass correlations                         Percent agreement
                                                                                                                                                                                                                                             Traysa      Reliability coefficient                  F/V itemsb      IOR
accurately measure intake. F/V consumption can be accurately measured                 observation (DO), and digital imaging (DI).                                                                                                                        (confidence interval)                  (comparisons)c   scored
during school lunch using weighed plate waste (WPW), but this method is          •    The feasibility of each method and inter-observer reliability of DO and DI                              Direct observation
rarely adopted because it is time and labor intensive. Direct observation             were tested in the laboratory and school cafeteria.                                                       Training                        19               10             0.99 (0.98, 1.00)                    51 (2493)     94%
(DO) and digital imaging (DI) are more feasible, but these methods have          •    Data were collected from school lunch trays (n=521) of third-, fourth-,                                   Visit 1
                                                                                                                                                                                                Visit 2
                                                                                                                                                                                                                                4
                                                                                                                                                                                                                                5
                                                                                                                                                                                                                                                 30
                                                                                                                                                                                                                                                 35
                                                                                                                                                                                                                                                                0.93 (0.86, 0.97)
                                                                                                                                                                                                                                                                0.73 (0.55, 0.85)
                                                                                                                                                                                                                                                                                                     57 (103)
                                                                                                                                                                                                                                                                                                     61 (65)
                                                                                                                                                                                                                                                                                                                   96%
                                                                                                                                                                                                                                                                                                                   89%
not been validated against WPW in present-day cafeterias. This study                  and fifth-graders in two Vermont school cafeterias. Each lunch tray was                                   Visit 3                         3                25             0.98 (0.95, 0.99)                    45 (45)       98%
tested the reliability and feasibility of DO and DI for measuring F/V                 assigned a colored, numbered sticker, with one color observed during                                      Visit 4                         2                21             0.95 (0.88, 0.98)                    48 (48)       100%
consumption against the gold standard of WPW in two Vermont school                    each visit.                                                                                             Digital imaging
cafeterias. 521 lunch trays were collected over ten school visits; 339 of        •    F/V consumption was determined as the difference between mean                                             Visit 1                          2               31             0.98 (0.96, 0.99)                    55 (55)       98%
                                                                                      baseline weights of the foods selected and plate waste for each lunch                                     Visit 2                          2               24             0.97 (0.93, 0.99)                    44 (44)       96%
the lunch trays were observed using WPW, 218 using DO, and 278 using                                                                                                                            Visit 3                          2               30             0.98 (0.96, 0.99)                    69 (69)       100%
DI. Inter-observer reliability (IOR) was high for both DO and DI; percent             tray. For WPW, plate waste was weighed to the nearest gram. For DO                                        Visit 4                          2               47             0.99 (0.98, 0.99)                    47 (47)       98%
agreement scores for IOR were ≥89% and intraclass correlations were                   and DI, a six-point scale was used to estimate the percent consumed of                                    Visit 5                          3               44             0.99 (0.98, 0.99)                    73 (219)      98%
≥0.70. DO and DI are feasible and reliable methods for measuring F/V                  each F/V item selected.                                                                                   Visit 6                          3               55             0.97 (0.95, 0.98)                    113 (339)     92%
                                                                                 • 
                                                                                                                                                                                              aObserver  estimations for total F/V consumption per lunch tray
consumption during school lunch. Further data analyses will test the                  The University for Vermont Institutional Review Board approved the                                      bObserver estimations for individual F/V items
                                                                                                                                                                                              cIn many instances, the same F/V item was estimated by more than two observers, allowing for multiple comparisons

validity of DO and DI against WPW.                                                    study.                                                                                                  dPercentage of estimations within one-quarter serving of another observer’s estimation


                                                                                                                           Analyses
                         BACKGROUND
                                                                                 Tests of inter-observer reliability (IOR):
                                                                                 •  Percent agreement assessed the consistency of researchers’ plate
Despite the well-known benefits of consuming fruits and vegetables (F/V),1          waste estimations for individual F/V items using DO or DI. Observers
only about 20% of children report consuming the recommended five or more            were in agreement if estimations were within one-quarter serving of
servings of F/V per day.2,3 Schools are frequently targeted as a place to           each other. A score of at least 85% agreement was expected during
improve children’s dietary habits, and multi-component school interventions         each school visit.
such as Farm to School aim to increase children’s F/V consumption.               •  Intraclass correlations tested reliability of researchers’ estimations for
However, methodology is needed that can accurately assess children’s F/V            F/V consumption per lunch tray using DO or DI.
consumption in school.
                                                                                 Analyses were conducted using SAS System for Windows (version 9.3,                                                                                     CONCLUSIONS
Children’s self-reports using instruments such as surveys, questionnaires,       2010), and Microsoft Excel (Redmond, WA, 2007)
and dietary recalls are subject to error since children may misidentify or                                                                                                                 Data on F/V consumption were successfully collected using three assessment
forget to report foods (omissions), identify uneaten foods (intrusions), and                                                                                                               methods, and DO and DI were reliable for measuring F/V consumption. Unique
have a difficult time estimating portion sizes.4 Overweight and obese children                 Data collected during the ten school visits                                                 challenges in each cafeteria affected the final number of lunch trays collected.
and their parents may be especially prone to misreporting energy and F/V                                                                                                                   Challenges included students’ selection of second servings of soup, F/V items
intake.5,6                                                                                                                      Distributed                                                missing at the end of the meal without evidence of consumption (e.g. apple cores),
                                                                                                                         662 lunch trays distributed                                       and students’ and lunch aides’ disposal of trays prior to final imaging, estimations, or
                                                                                                                    1104 maximum possible observations
Accurate measurement of children’s food intake can be obtained using the                                                                                          Incomplete Data
                                                                                                                                                                                           weighing. Additional analyses will be conducted to test the validity of DO and DI
“gold standard” of weighed plate waste, but this method is time and labor                                                                                    141 lunch trays removed       estimations against the gold standard of WPW. DI may be especially promising since
                                                                                                                                                                (21.3% of distributed)
intensive.7 Two other methods – direct observation and digital imaging –                                                                                   269 tray observations removed   it requires the least time and labor to collect data on F/V consumption.
                                                                                                                                                                (24.4% of distributed)
have been used to estimate consumption by observation, but validation of
                                                                                                                             Tray Observations
these methods has generally been limited to studies in environments more                                                 521 lunch trays collected
controlled than the busy school cafeteria, such as the laboratory8 or                                                  835 tray observations collected                                                                                                References
                                                                                                                                                                  No F/V Selected
hospital.9 Earlier studies of direct observation validated the method against                                                                                 85 lunch trays removed
                                                                                                                                                                                           1.  Bazzano LA. The high cost of not consuming fruits and vegetables. J Am Diet Assoc. 2006;106(9):1364-8.
                                                                                                                                                                                           2.  Robinson-O’Brien R, Burgess-Champoux T, Haines J, Hannan P, Neumark-Sztainer D. Associations between school meals
weighed plate waste in a school cafeteria,10 but present-day school                                                                                             (12.8% of distributed)
                                                                                                                                                           126 tray observations removed       offered through the national school lunch program and the school breakfast program and fruit and vegetable intake among
cafeterias pose unique challenges.                                                                                                                              (11.4% of distributed)         ethnically diverse, low-income children. J Sch Health. 2010;80(10):487-492.
                                                                                                                                                                                           3.  Guenther PM, Dodd KW, Reedy J, Krebs-Smith SM. Most Americans eat much less than recommended amounts of fruits and
                                                                                                                           F/V Tray Observations                                               vegetables. J Am Diet Assoc. 2006;106(9):1371-9.
                                                                                                                       436 F/V lunch trays collected                                       4.  Livingstone MBE, Robson PJ, Wallace JMW. Issues in dietary intake assessment of children and adolescents. Br J Nutr.
                RESEARCH OBJECTIVE                                                                                   709 F/V tray observations collected                                       2004;92(Suppl. 2):S213-S222.
                                                                                                                                                                                           5.  Burrows TL, Martin RJ, Collins CE. A systematic review of the validity of dietary assessment methods in children when
                                                                                                                                                                                               compared with the method of doubly labeled water. J Am Diet Assoc. 2010;110(10):1501-10.
    To establish a reliable and feasible method for                                                                                                                                        6.  Burrows TL, Warren JM, Colyvas K, Garg ML, Collins CE. Validation of overweight children’s fruit and vegetable intake using
                                                                                                                                                                                               plasma carotenoids. Obesity (Silver Spring). 2009;17(1):162-8.
    measuring school children’s consumption of F/V                                         Weighed Plate Waste               Direct Observation                 Digital Imaging
                                                                                                                                                                                           7.  Kirks B, Wolff H. A comparison of methods for plate waste determinations. J Am Diet Assoc. 1985;85(3):328-31.
                                                                                                                                                                                           8.  Williamson DA, Allen HR, Martin PD, et al. Comparison of digital photography to weighed and visual estimation of portion sizes.
    during school lunch in a variety of school                                                 277 F/V tray
                                                                                           observations collected
                                                                                                                                199 F/V tray
                                                                                                                            observations collected
                                                                                                                                                                 233 F/V tray
                                                                                                                                                             observations collected
                                                                                                                                                                                               J Am Diet Assoc. 2003;103(9):1139-45.
                                                                                                                                                                                           9.  Connors PL, Rozell SB. Using a visual plate waste study to monitor menu performance. J Am Diet Assoc. 2004;104(1):94-6.
    cafeteria settings.                                                                                                                                                                    10. Comstock EM, St Pierre RG, Mackiernan YD. Measuring individual plate waste in school lunches. Visual estimation and
                                                                                                                                                                                               children’s ratings vs. actual weighing of plate waste. J Am Diet Assoc. 1981;79(3):290-296.


                                                                      This study was funded by the USDA - Vermont Agricultural Experiment Station.
                                                           The authors thank Alan Howard and Leah Conchieri for their support with data and statistical analyses.

Más contenido relacionado

Más de National Farm To School Network

Regional Partnerships and Approaches to Farm to Institution - presentation
Regional Partnerships and Approaches to Farm to Institution - presentationRegional Partnerships and Approaches to Farm to Institution - presentation
Regional Partnerships and Approaches to Farm to Institution - presentationNational Farm To School Network
 
Food Hubs and Values-based Supply Chains in School Food - presentation 2
Food Hubs and Values-based Supply Chains in School Food - presentation 2Food Hubs and Values-based Supply Chains in School Food - presentation 2
Food Hubs and Values-based Supply Chains in School Food - presentation 2National Farm To School Network
 
Protein Puzzle Short Course: Alaska fish to school presentation
Protein Puzzle Short Course: Alaska fish to school presentationProtein Puzzle Short Course: Alaska fish to school presentation
Protein Puzzle Short Course: Alaska fish to school presentationNational Farm To School Network
 
COOKING SEASONAL FOODS: PROFESSIONAL DEVELOPMENT FOR FOOD SERVICE STAFF
COOKING SEASONAL FOODS: PROFESSIONAL DEVELOPMENT FOR FOOD SERVICE STAFFCOOKING SEASONAL FOODS: PROFESSIONAL DEVELOPMENT FOR FOOD SERVICE STAFF
COOKING SEASONAL FOODS: PROFESSIONAL DEVELOPMENT FOR FOOD SERVICE STAFFNational Farm To School Network
 
Regional Partnerships and Approaches to Farm to Institution - presentation
Regional Partnerships and Approaches to Farm to Institution - presentationRegional Partnerships and Approaches to Farm to Institution - presentation
Regional Partnerships and Approaches to Farm to Institution - presentationNational Farm To School Network
 
Process, Findings and Implications from Two Health Impact Assessments: Inform...
Process, Findings and Implications from Two Health Impact Assessments: Inform...Process, Findings and Implications from Two Health Impact Assessments: Inform...
Process, Findings and Implications from Two Health Impact Assessments: Inform...National Farm To School Network
 
Farm to Preschool: Taking Root Across the Nation! - presentation
Farm to Preschool: Taking Root Across the Nation!  - presentationFarm to Preschool: Taking Root Across the Nation!  - presentation
Farm to Preschool: Taking Root Across the Nation! - presentationNational Farm To School Network
 
Regional Food Hubs: Challenges and opportunities for linking producers to reg...
Regional Food Hubs: Challenges and opportunities for linking producers to reg...Regional Food Hubs: Challenges and opportunities for linking producers to reg...
Regional Food Hubs: Challenges and opportunities for linking producers to reg...National Farm To School Network
 
How to Develop and Implement Farm to School Policy: Learning Best Practices f...
How to Develop and Implement Farm to School Policy: Learning Best Practices f...How to Develop and Implement Farm to School Policy: Learning Best Practices f...
How to Develop and Implement Farm to School Policy: Learning Best Practices f...National Farm To School Network
 

Más de National Farm To School Network (19)

Regional Partnerships and Approaches to Farm to Institution - presentation
Regional Partnerships and Approaches to Farm to Institution - presentationRegional Partnerships and Approaches to Farm to Institution - presentation
Regional Partnerships and Approaches to Farm to Institution - presentation
 
Food Hubs and Values-based Supply Chains in School Food - presentation 2
Food Hubs and Values-based Supply Chains in School Food - presentation 2Food Hubs and Values-based Supply Chains in School Food - presentation 2
Food Hubs and Values-based Supply Chains in School Food - presentation 2
 
Protein Puzzle Short Course: Alaska fish to school presentation
Protein Puzzle Short Course: Alaska fish to school presentationProtein Puzzle Short Course: Alaska fish to school presentation
Protein Puzzle Short Course: Alaska fish to school presentation
 
COOKING SEASONAL FOODS: PROFESSIONAL DEVELOPMENT FOR FOOD SERVICE STAFF
COOKING SEASONAL FOODS: PROFESSIONAL DEVELOPMENT FOR FOOD SERVICE STAFFCOOKING SEASONAL FOODS: PROFESSIONAL DEVELOPMENT FOR FOOD SERVICE STAFF
COOKING SEASONAL FOODS: PROFESSIONAL DEVELOPMENT FOR FOOD SERVICE STAFF
 
Regional Partnerships and Approaches to Farm to Institution - presentation
Regional Partnerships and Approaches to Farm to Institution - presentationRegional Partnerships and Approaches to Farm to Institution - presentation
Regional Partnerships and Approaches to Farm to Institution - presentation
 
Food Hubs and Values-based Supply Chains - presentation
Food Hubs and Values-based Supply Chains - presentationFood Hubs and Values-based Supply Chains - presentation
Food Hubs and Values-based Supply Chains - presentation
 
Process, Findings and Implications from Two Health Impact Assessments: Inform...
Process, Findings and Implications from Two Health Impact Assessments: Inform...Process, Findings and Implications from Two Health Impact Assessments: Inform...
Process, Findings and Implications from Two Health Impact Assessments: Inform...
 
Process, Findings and Implications from Two Health Impact Assessments: Inform...
Process, Findings and Implications from Two Health Impact Assessments: Inform...Process, Findings and Implications from Two Health Impact Assessments: Inform...
Process, Findings and Implications from Two Health Impact Assessments: Inform...
 
Farm to Preschool: Taking Root Across the Nation! - presentation
Farm to Preschool: Taking Root Across the Nation!  - presentationFarm to Preschool: Taking Root Across the Nation!  - presentation
Farm to Preschool: Taking Root Across the Nation! - presentation
 
Regional Food Hubs: Challenges and opportunities for linking producers to reg...
Regional Food Hubs: Challenges and opportunities for linking producers to reg...Regional Food Hubs: Challenges and opportunities for linking producers to reg...
Regional Food Hubs: Challenges and opportunities for linking producers to reg...
 
Regional Food Hubs: Challenges and opportunities for linking producers to reg...
Regional Food Hubs: Challenges and opportunities for linking producers to reg...Regional Food Hubs: Challenges and opportunities for linking producers to reg...
Regional Food Hubs: Challenges and opportunities for linking producers to reg...
 
How to Develop and Implement Farm to School Policy: Learning Best Practices f...
How to Develop and Implement Farm to School Policy: Learning Best Practices f...How to Develop and Implement Farm to School Policy: Learning Best Practices f...
How to Develop and Implement Farm to School Policy: Learning Best Practices f...
 
How to Develop and Implement Farm to School Policy: Learning Best Practices f...
How to Develop and Implement Farm to School Policy: Learning Best Practices f...How to Develop and Implement Farm to School Policy: Learning Best Practices f...
How to Develop and Implement Farm to School Policy: Learning Best Practices f...
 
Growing a Garden Book Collection for Kids
Growing a Garden Book Collection for Kids Growing a Garden Book Collection for Kids
Growing a Garden Book Collection for Kids
 
Missouri Farm to School Resources
Missouri Farm to School Resources Missouri Farm to School Resources
Missouri Farm to School Resources
 
Quantifying the Impact of Farm to School
Quantifying the Impact of Farm to School Quantifying the Impact of Farm to School
Quantifying the Impact of Farm to School
 
D3: Food Safety and the Garden to Cafeteria Connection
D3: Food Safety and the Garden to Cafeteria Connection D3: Food Safety and the Garden to Cafeteria Connection
D3: Food Safety and the Garden to Cafeteria Connection
 
Farm to School Across the Country photo slideshow
Farm to School Across the Country photo slideshowFarm to School Across the Country photo slideshow
Farm to School Across the Country photo slideshow
 

The development of a reliable and feasible measure of school children's fruit and vegetable consumption

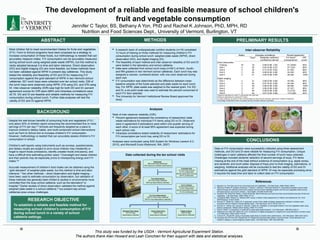
  • 1. The development of a reliable and feasible measure of school children's fruit and vegetable consumption Jennifer C Taylor, BS, Bethany A Yon, PhD and Rachel K Johnson, PhD, MPH, RD Nutrition and Food Sciences Dept., University of Vermont, Burlington, VT ABSTRACT METHODS PRELIMINARY RESULTS Most children fail to meet recommended intakes for fruits and vegetables •  A research team of undergraduate nutrition students (n=19) completed Inter-observer Reliability (F/V). Farm to School programs have been proposed as a strategy to 12 hours of training on three methods for measuring children’s F/V increase consumption of these foods, but methodology is needed that can consumption during school lunch: weighed plate waste (WPW), direct Raters Intraclass correlations Percent agreement Traysa Reliability coefficient F/V itemsb IOR accurately measure intake. F/V consumption can be accurately measured observation (DO), and digital imaging (DI). (confidence interval) (comparisons)c scored during school lunch using weighed plate waste (WPW), but this method is •  The feasibility of each method and inter-observer reliability of DO and DI Direct observation rarely adopted because it is time and labor intensive. Direct observation were tested in the laboratory and school cafeteria. Training 19 10 0.99 (0.98, 1.00) 51 (2493) 94% (DO) and digital imaging (DI) are more feasible, but these methods have •  Data were collected from school lunch trays (n=521) of third-, fourth-, Visit 1 Visit 2 4 5 30 35 0.93 (0.86, 0.97) 0.73 (0.55, 0.85) 57 (103) 61 (65) 96% 89% not been validated against WPW in present-day cafeterias. This study and fifth-graders in two Vermont school cafeterias. Each lunch tray was Visit 3 3 25 0.98 (0.95, 0.99) 45 (45) 98% tested the reliability and feasibility of DO and DI for measuring F/V assigned a colored, numbered sticker, with one color observed during Visit 4 2 21 0.95 (0.88, 0.98) 48 (48) 100% consumption against the gold standard of WPW in two Vermont school each visit. Digital imaging cafeterias. 521 lunch trays were collected over ten school visits; 339 of •  F/V consumption was determined as the difference between mean Visit 1 2 31 0.98 (0.96, 0.99) 55 (55) 98% baseline weights of the foods selected and plate waste for each lunch Visit 2 2 24 0.97 (0.93, 0.99) 44 (44) 96% the lunch trays were observed using WPW, 218 using DO, and 278 using Visit 3 2 30 0.98 (0.96, 0.99) 69 (69) 100% DI. Inter-observer reliability (IOR) was high for both DO and DI; percent tray. For WPW, plate waste was weighed to the nearest gram. For DO Visit 4 2 47 0.99 (0.98, 0.99) 47 (47) 98% agreement scores for IOR were ≥89% and intraclass correlations were and DI, a six-point scale was used to estimate the percent consumed of Visit 5 3 44 0.99 (0.98, 0.99) 73 (219) 98% ≥0.70. DO and DI are feasible and reliable methods for measuring F/V each F/V item selected. Visit 6 3 55 0.97 (0.95, 0.98) 113 (339) 92% •  aObserver estimations for total F/V consumption per lunch tray consumption during school lunch. Further data analyses will test the The University for Vermont Institutional Review Board approved the bObserver estimations for individual F/V items cIn many instances, the same F/V item was estimated by more than two observers, allowing for multiple comparisons validity of DO and DI against WPW. study. dPercentage of estimations within one-quarter serving of another observer’s estimation Analyses BACKGROUND Tests of inter-observer reliability (IOR): •  Percent agreement assessed the consistency of researchers’ plate Despite the well-known benefits of consuming fruits and vegetables (F/V),1 waste estimations for individual F/V items using DO or DI. Observers only about 20% of children report consuming the recommended five or more were in agreement if estimations were within one-quarter serving of servings of F/V per day.2,3 Schools are frequently targeted as a place to each other. A score of at least 85% agreement was expected during improve children’s dietary habits, and multi-component school interventions each school visit. such as Farm to School aim to increase children’s F/V consumption. •  Intraclass correlations tested reliability of researchers’ estimations for However, methodology is needed that can accurately assess children’s F/V F/V consumption per lunch tray using DO or DI. consumption in school. Analyses were conducted using SAS System for Windows (version 9.3, CONCLUSIONS Children’s self-reports using instruments such as surveys, questionnaires, 2010), and Microsoft Excel (Redmond, WA, 2007) and dietary recalls are subject to error since children may misidentify or Data on F/V consumption were successfully collected using three assessment forget to report foods (omissions), identify uneaten foods (intrusions), and methods, and DO and DI were reliable for measuring F/V consumption. Unique have a difficult time estimating portion sizes.4 Overweight and obese children Data collected during the ten school visits challenges in each cafeteria affected the final number of lunch trays collected. and their parents may be especially prone to misreporting energy and F/V Challenges included students’ selection of second servings of soup, F/V items intake.5,6 Distributed missing at the end of the meal without evidence of consumption (e.g. apple cores), 662 lunch trays distributed and students’ and lunch aides’ disposal of trays prior to final imaging, estimations, or 1104 maximum possible observations Accurate measurement of children’s food intake can be obtained using the Incomplete Data weighing. Additional analyses will be conducted to test the validity of DO and DI “gold standard” of weighed plate waste, but this method is time and labor 141 lunch trays removed estimations against the gold standard of WPW. DI may be especially promising since (21.3% of distributed) intensive.7 Two other methods – direct observation and digital imaging – 269 tray observations removed it requires the least time and labor to collect data on F/V consumption. (24.4% of distributed) have been used to estimate consumption by observation, but validation of Tray Observations these methods has generally been limited to studies in environments more 521 lunch trays collected controlled than the busy school cafeteria, such as the laboratory8 or 835 tray observations collected References No F/V Selected hospital.9 Earlier studies of direct observation validated the method against 85 lunch trays removed 1.  Bazzano LA. The high cost of not consuming fruits and vegetables. J Am Diet Assoc. 2006;106(9):1364-8. 2.  Robinson-O’Brien R, Burgess-Champoux T, Haines J, Hannan P, Neumark-Sztainer D. Associations between school meals weighed plate waste in a school cafeteria,10 but present-day school (12.8% of distributed) 126 tray observations removed offered through the national school lunch program and the school breakfast program and fruit and vegetable intake among cafeterias pose unique challenges. (11.4% of distributed) ethnically diverse, low-income children. J Sch Health. 2010;80(10):487-492. 3.  Guenther PM, Dodd KW, Reedy J, Krebs-Smith SM. Most Americans eat much less than recommended amounts of fruits and F/V Tray Observations vegetables. J Am Diet Assoc. 2006;106(9):1371-9. 436 F/V lunch trays collected 4.  Livingstone MBE, Robson PJ, Wallace JMW. Issues in dietary intake assessment of children and adolescents. Br J Nutr. RESEARCH OBJECTIVE 709 F/V tray observations collected 2004;92(Suppl. 2):S213-S222. 5.  Burrows TL, Martin RJ, Collins CE. A systematic review of the validity of dietary assessment methods in children when compared with the method of doubly labeled water. J Am Diet Assoc. 2010;110(10):1501-10. To establish a reliable and feasible method for 6.  Burrows TL, Warren JM, Colyvas K, Garg ML, Collins CE. Validation of overweight children’s fruit and vegetable intake using plasma carotenoids. Obesity (Silver Spring). 2009;17(1):162-8. measuring school children’s consumption of F/V Weighed Plate Waste Direct Observation Digital Imaging 7.  Kirks B, Wolff H. A comparison of methods for plate waste determinations. J Am Diet Assoc. 1985;85(3):328-31. 8.  Williamson DA, Allen HR, Martin PD, et al. Comparison of digital photography to weighed and visual estimation of portion sizes. during school lunch in a variety of school 277 F/V tray observations collected 199 F/V tray observations collected 233 F/V tray observations collected J Am Diet Assoc. 2003;103(9):1139-45. 9.  Connors PL, Rozell SB. Using a visual plate waste study to monitor menu performance. J Am Diet Assoc. 2004;104(1):94-6. cafeteria settings. 10. Comstock EM, St Pierre RG, Mackiernan YD. Measuring individual plate waste in school lunches. Visual estimation and children’s ratings vs. actual weighing of plate waste. J Am Diet Assoc. 1981;79(3):290-296. This study was funded by the USDA - Vermont Agricultural Experiment Station. The authors thank Alan Howard and Leah Conchieri for their support with data and statistical analyses.