Prepare For The Trading Day
•
1 recomendación•720 vistas

http://www.netpicks.com/dynamicprofitdetector -- Free Trend Indicator! I admit I like to scan charts of various instruments in advance of the trading day. This does not mean that I will get a trade off because I am looking for a particular setup at a particular location for the instruments of choice. What it does mean is that I am prepared for trading to take advantage of an opportunity in an area that has the potential to set up a trading opportunity. There are a few items that need to be covered in order for this to make any sense so that you may find some benefit in this approach see more: http://www.netpicks.com/prepared-trading/

Recomendados
Más contenido relacionado
La actualidad más candente
La actualidad más candente (20)
Destacado
Destacado (13)
Similar a Prepare For The Trading Day
Similar a Prepare For The Trading Day (20)
Más de NetpicksTrading
Más de NetpicksTrading (20)
Último
Último (20)
Prepare For The Trading Day
- 2. I admit I like to scan charts of various instruments in advance of the trading day. This does not mean that I will get a trade off because I am looking for a particular setup at a particular location for the instruments of choice.
- 3. What it does mean is that I am prepared for trading to take advantage of an opportunity in an area that has the potential to set up a trading opportunity.
- 4. There are a few items that need to be covered in order for this to make any sense so that you may find some benefit in this approach.
- 5. For those that day trade, it is very tempting to manufacture a setup that in reality is not truly there. There are many times in our trading careers that we can justify a trade during a slow period when you'd ignore it when things are moving a little quicker.
- 6. If you plan out an area of interest in advance of the trading session for a selection of instruments, you give yourself a few advantages:
- 7. You have a list of instruments that may be approaching the "moment of truth" so your trading session is spent on probable trade setups.
- 8. You limit or abolish boredom trades and that goes a long way in protecting your trading business.
- 9. You immunize yourself to the talking heads, rapid price moves, and any other distraction that may make you take an undisciplined trade.
- 10. Having a consistent approach in trading can never be overstated.There may be slight deviations however attempting to maintain robot like actions is a desirable trait. Having points of interest goes far in keeping you disciplined and consistent with your trading method.
- 11. 1. Location is not just important in real estate. A confluence of factors must come together to form a location of interest. This location hopefully is a place of increased order flow that will enable you to capitalize on the next probable move.
- 12. What makes up the location? It can be a combination of a few factors but for me, previous price structure, technical factors such as trend lines, and potential support/resistance levels can make a potential confluence.
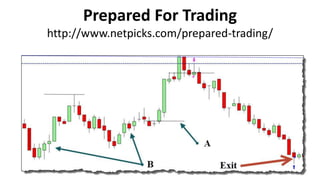
- 13. This is a chart of the 6E Futures from last week. There are a few items I noted using this 10 minute chart and price information from previous days.
- 15. A. Horizontal line represents potential resistance. This is not a conventional line using price extremes as action inside of the extremes presents more and often better trading opportunities.
- 16. B. An inner trend line that uses structure from inside of the extremes.
- 17. C. These were not really noted until price was approaching the confluence area however many classify these as "3 pushes". Price makes 3 drives (impulse/correction) that are close in price and time.
- 18. What we'd want to see is some sort of price climax near our confluence zone. The location was already chosen and the only thing needed was price to visit the location.
- 19. At that point, dropping down to a lower time frame (2 minutes) to see the price action helps determine if there is a trading opportunity.
- 21. 2. Price activity near and at the location. This is extremely important because it shows the buy/sell pressure at the location and the probable move after the pressure exhausts itself in either direction.
- 22. A. These candles stand out and given the context, I am looking at a buying climax into my predetermined area.
- 23. B. This bear candle is the largest bear candle in the last 60 minutes. Meaningless on its own but in the location, it tells a story.
- 24. C. These two candles are holding the lows but the upper shadow shows a sharp rejection. Other points to consider....
- 25. The daily chart is overall down. We are currently in a small trading range in the bigger picture. This location is somewhat close to the upper portion of the range.
- 26. Given all these factors including price action in the location, a short trade is opened. The stop is located above the extreme instead of the smaller range because getting popped out of a trade due to noise can be very frustrating.
- 27. As well, the trade would be potentially invalidated only if the upside was broken.
- 29. A. Monitored at this location due to the large influx of order flow that caused the big green candles. There was nothing at the base of that when price returned that showed much rejection.
- 30. B. If you compare these two areas, you can see the lower one had more "concrete" intention in regards to interest and direction.
- 31. This was certainly not the "best" area to exit because after a brief consolidation, price dropped about 40 point further.
- 32. It is very possible that price may have reversed long before hitting the location that was laid out.
- 33. This would have resulted in a missed trading opportunity at this level because chasing trades is not only the sign of an undisciplined trader but also detrimental to your account.
- 34. Is it possible to find locations during the session that may setup trading opportunities?
- 35. Finding locations while the day is progressing is certainly viable. The key is to have strict guidelines that point to a change of state in the current market condition.
- 36. This is a range the occurred and completed about 40 minutes after the trade shown above was complete. A change of state from the strong downside move that had occurred.
- 37. I personally want something to stand out such as a rapid price move or an obvious pattern before I even dig into a chart mid day.
- 38. For context, the move down to this range was full of larger red candles than green candles on the lower time frame. On the 10 minute chart, the color was red until we had one green candle (indicates lower time frame pullback) that formed the range on the trading chart.
- 39. Price had also broken back down through the halfway mark of the session high/low. The issue is we are getting into the 12:00 lunch hour New York Time.
- 41. A. Downside probe bringing buying pressure into the market.
- 42. B. Upthrust that is rejected.
- 43. C. Range forms after upthrust with no hint of buying pressure.
- 44. Being prepared in your trading business is much better than finding your trading chair moments before the open.
- 45. You want to have a plan of attack so you can take advantage of higher probability trades that most often occur at areas where there is a confluence of factors including forming structure and current price action.
- 46. There is no excuse for not preparing for the trading day and being selective in what you are going to trade that session.
- 47. When preparedness meets opportunity...success is often not far behind.