Más contenido relacionado
Similar a Weekly KPI meeting of FHRO.ppt (20)
Más de Nittamallik216 (9)
Weekly KPI meeting of FHRO.ppt
- 3. Month wise NPT status :
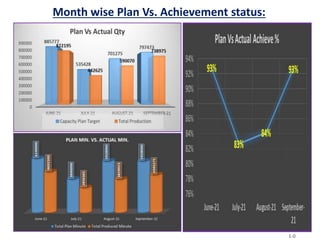
1-2
Non
Productive
Minute
NPT Value
NPT Value in
Tk.
NPT% NPT (Pcs)
NPT (Man-
Hour)
NPT MC/Day
Total Earning
(Including NPT
Value)
Revenue/MC
(Without NPT)
7190 Min. 503.30
$ 41,774৳ 0.08% 1260 Pcs 120 0.4 MC 364,099.91
$ BDT 73621
17460 Min. 1,222.20
$ 101,443৳ 0.34% 2706 Pcs 291 1.8 MC 232,037.53
$ BDT 78925
16800 Min. 1,176.00
$ 97,608৳ 0.23% 2589 Pcs 280 1.1 MC 301,604.55
$ BDT 65856
41450 Min. 2,901.50
$ 240,825৳ 0.20% 6554 Pcs 691 1.1 MC 897,741.99
$ BDT 72019
- 5. Month wise Plan Vs. Actual Style Analysis (AUG-21):
1-4
SMVType StyleType StyleQty
Produced
Minute
ProducedQty
Avgqty%out
oftotal
ProduceQty
<4.5 VeryBasic 13 154434 37800 6.4%
4.51-7.5 Basic 19 2585304 437710 74.2%
7.51-10.5 SemiCritical 5 823378 91710 15.5%
10.51-15 HeavySemiCritical 6 265906 22850 3.9%
15.1-20 Critical 0 0 0 0.0%
20.1->=28 HeavyCritical 0 0 0 0.0%
6.49 Basic 43 3829023 590070 100.0%
SMV Type Style Type Style Qty Plan Minute Plan Qty
Avg qty % out of
total Plan Qty
<4.5 Very Basic 0 155321 37964 5.17%
4.51-7.5 Basic 18 3310823 554156 75.50%
7.51-10.5 Semi Critical 5 1207289 127515 17.37%
10.51-15 Heavy Semi Critical 3 160247 14335 1.95%
15.1-20 Critical 0 0 0 0.00%
20.1- >=28 Heavy Critical 0 0 0 0.00%
6.59 Basic 26 4833680 733970 100%
- 6. Month wise Plan Vs. Actual Style Analysis (JUNE-21):
1-5
SMV Type Style Type Style Qty
Produced
Minute
Produced Qty
Avg qty % out
of total
Produce Qty
<4.5 Very Basic 10 62047 14220 1.7%
4.51-7.5 Basic 21 4305274 762465 92.7%
7.51-10.5 Semi Critical 10 344810 41260 5.0%
10.51-15 Heavy Semi Critical 2 44880 4250 0.5%
15.1-20 Critical 0 0 0 0.0%
20.1- >=28 Heavy Critical 0 0 0 0.0%
5.79 Basic 43 4757010 822195 100.0%
SMV Type Style Type Style Qty Plan Minute Plan Qty
Avg qty % out of
total Plan Qty
<4.5 Very Basic 0 0 0 0.00%
4.51-7.5 Basic 19 4653023 822507 100.00%
7.51-10.5 Semi Critical 0 0 0 0.00%
10.51-15 Heavy Semi Critical 0 0 0 0.00%
15.1-20 Critical 0 0 0 0.00%
20.1- >=28 Heavy Critical 0 0 0 0.00%
5.66 Basic 19 4653023 822507 100%
- 7. Month wise facts analysis :
1-6
SMV 1st
day 2nd
day 3rd
day 4th
day 5th
day 6th
day 7th
day 8th
day 9th
day 10th
day
<4.5 45% 60% 70% 75% 85% 85% 85% 85% 85% 85%
4.51-7.5 40% 55% 65% 70% 75% 75% 75% 75% 75% 80%
7.51-10.5 35% 45% 55% 60% 65% 65% 65% 70% 70% 70%
10.51-15 35% 45% 50% 55% 60% 60% 60% 65% 65% 65%
15.1-20 25% 35% 45% 50% 55% 55% 55% 55% 55% 60%
20.1-28 25% 35% 40% 45% 50% 50% 50% 55% 55% 55%
>=28.1 10% 20% 30% 35% 40% 45% 45% 45% 45% 50%
Efficiency Requirement
Month Factory
Noof
Working
days
No.Style
Running
No.Styling
No.ofAvg.
Line
Run
days/Styling/
Line
Expected
Efficiency
Achieved
Efficiency%
June-21 KRC(U-3&4) 28 42 9 15 47days 75.0% 55.3%
July-21 KRC(U-3&4) 16 19 13 15 18days 75.0% 54.9%
August-21 KRC(U-3&4) 26 32 12 15 32days 75.0% 52.0%
G.Total H&MTOTAL 23 93 34 45 31days 75.0% 54.1%
- 10. Month wise Plan Vs. Actual Style Analysis (JULY-21):
1-9
SMVType StyleType StyleQty
Produced
Minute
ProducedQty
Avgqty%out
oftotal
ProduceQty
<4.5 VeryBasic 27 10046 660 0.1%
4.51-7.5 Basic 13 2461719 374370 84.6%
7.51-10.5 SemiCritical 1 173537 22985 5.2%
10.51-15 HeavySemiCritical 2 1117080 44610 10.1%
15.1-20 Critical 0 0 0 0.0%
20.1->=28 HeavyCritical 0 0 0 0.0%
8.50 Basic 43 3762381 442625 100.0%
SMV Type Style Type Style Qty Plan Minute Plan Qty
Avg qty % out of
total Plan Qty
<4.5 Very Basic 2 38503 9120 1.69%
4.51-7.5 Basic 13 2462516 437260 81.04%
7.51-10.5 Semi Critical 4 321879 40200 7.45%
10.51-15 Heavy Semi Critical 6 686828 53005 9.82%
15.1-20 Critical 0 0 0 0.00%
20.1- >=28 Heavy Critical 0 0 0 0.00%
6.50 Basic 25 3509725 539585 100%