Government at a Glance 2013, Country Fact Sheet: Norway
•
0 recomendaciones•690 vistas

Country fact sheet showing indicators on strategic governance, women in government, public finance & economics, public procurement, budget practices & procedures, open and inclusive government, public employment & pay, and serving citizens. More information is available from the OECD publication Government at a Glance 2013. http://www.oecd.org/gov/govataglance.htm

Recomendados
Recomendados
Más contenido relacionado
La actualidad más candente
La actualidad más candente (20)
Similar a Government at a Glance 2013, Country Fact Sheet: Norway
Similar a Government at a Glance 2013, Country Fact Sheet: Norway (11)
Más de OECD Governance
Más de OECD Governance (20)
Último
Último (20)
Government at a Glance 2013, Country Fact Sheet: Norway
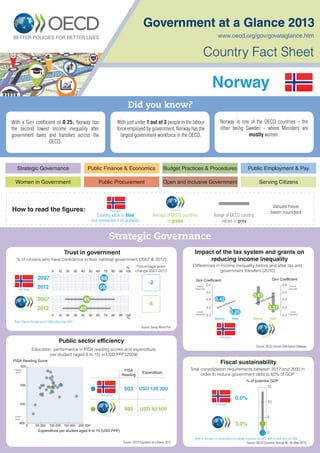
- 1. Government at a Glance 2013 Country Fact Sheet Strategic Governance Women in Government Public Finance & Economics Public Procurement Budget Practices & Procedures Open and Inclusive Government Public Employment & Pay Serving Citizens Did you know? Average of OECD countries in green Country value in blue (not represented if not available) Range of OECD country values in grey www.oecd.org/gov/govataglance.htm How to read the figures: OECD Values have been rounded Trust in government Fiscal sustainability Public sector efficiency Impact of the tax system and grants on reducing income inequality% of citizens who have confidence in their national government (2007 & 2012) Education: performance in PISA reading scores and expenditure per student (aged 6 to 15) in USD PPP (2009) Source: Gallup World Poll Source: OECD Education at a Glance 2012 Source: OECD Income Distribution Database Source: OECD Economic Outlook No. 93 (May 2013) Total consolidation requirements between 2012 and 2030 in order to reduce government debt to 60% of GDP Differences in income inequality before and after tax and government transfers (2010) Strategic Governance 0.2 0.3 0.4 0.5 0.6 0.2 0.3 0.4 0.5 0.6 Gini Coefficient Gini Coefficient Higher inequality Higher inequality Lower inequality Lower inequality Before After Before After OECD 0.47 0.31 taxes and transfers 0.25 0.42 taxes and transfers Norway 0 5 10 15 % of potential GDP 3.0% OECD Note: In Norway, no consolidation is needed to achieve the 60% debt-to-GDP ratio by 2030. 0.0% Norway Expenditure per student aged 6 to 15 (USD PPP) PISA Reading Score 0 50 000 100 000 150 000 200 000 400 450 500 550 Higher score Lower score OECD PISA Reading Expenditure 495 USD 83 500 503 USD 120 300 Norway Norway With just under 1 out of 3 people in the labour force employed by government, Norway has the largest government workforce in the OECD. With a Gini coefficient of 0.25, Norway has the second lowest income inequality after government taxes and transfers across the OECD. Norway is one of the OECD countries – the other being Sweden - where Ministers are mostly women. Percentage point change 2007-20120 10 20 30 40 50 60 70 80 90 100 % 0 10 20 30 40 50 60 70 80 90 100 % 45 40 2007 2012 -5 OECD -2 2007 2012 66 68 Note: Data for Norway are for 2006 rather than 2007. Norway Norway
- 2. Public Finance and Economics Structure of government expenditures (2011) % of total government expenditure Government revenues (2011) Government expenditures (2011) Fiscal balance (2011) Government debt (2011) % of GDP % of GDP % of GDP % of GDP Source: OECD National Accounts Source: OECD National Accounts Source: OECD National Accounts Source: OECD National Accounts Source: OECD National Accounts Budget Practices and Procedures Fiscal rules:Types and legal foundation (2012) Use of performance budgeting practices at the central level of government (2011) Index Source: OECD 2012 Survey on Budget Practices and Procedures Source: OECD 2011 Survey on Performance Budgeting 20% 30% 40% 50% 60% OECD 41.9% 57.3% Norway 20% 30% 40% 50% 60% OECD 45.4% 43.9% Norway OECD -15% -10% 0%-5% +5% +10% +15% -3.5% +13.4% Norway 0% 50% 100% 150% 200% 250% OECD 79% 100% 0% 33% Norway 100% 0% Social protection HealthEducation General public services Economic affairs Public order and safety Defence Other 35.6% 5.9% 3.9% 3.6% 14.5%12.5% 13.6% 10.5% OECD 6.0% Other 3.6% Defence 2.2% Public order and safety 9.6% Economic affairs 9.7% General public services 12.6% Education 16.5% Health 39.8% Social protection Norway In how many countries do these types of rules exist? If yes, what is the legal foundation? Do these types of rules exist? Expenditure rule(s) Revenue rule(s) Budget balance rule(s) Debt rule(s) Legal foundations: Constitution International Treaty Primary and/or Secondary Legislation Internal Rules/Policy Political Commitment C IT L R PC 21 5 28 23 OECD NO RYES NO NO Norway 0.0 0.1 0.2 0.3 0.4 0.5 0.6 0.7 0.38 OECD 0.0 0.1 0.2 0.3 0.4 0.5 0.6 0.7 0.36 Norway 0.0 0.1 0.2 0.3 0.4 0.5 0.6 0.7
- 3. Public Employment and Pay Employment in general government (2011) % of labour force Annual compensation across central government positions (2011) Source: OECD 2012 Survey on Compensation of Employees in Centrtall/Federal Governments Source: International Labour Organisation Database & OECD Labour Force Statistics 2011 USD PPP Women in Government Share of women in general government (2010) Share of ministers who are women (2012) Source: International Labour Organisation Source: Inter-Parliamentary Union Parline Database % of general government employment % of ministers Public Procurement Procurement expenditure (2011) Use of innovative procurement tools in central government (2012) % of government expenditures functionalities in e-procurement systems Source: OECD National Accounts Source: OECD 2012 Survey on Public Procurement 0% 10% 20% 30% 40% 50% OECD 29.0%26.5% Norway Procurement plans are published Yes, in national central e-procurement systems Yes,in e-procurement systems of specific procuring entities No Tenders are announced Bids can be submitted electronically Invoices can be submitted electronically 20 8 10 32 7 0 16 13 6 8 10 15OECD Norway 56.8% OECD 50% 0% 100% 71.7% Note: Data for Norway are for 2007. Norway 24.9% OECD 50% 0% 100% 52.6% Norway 50% 0% 10% 20% 30% 40% 15.5% OECD 30.5% Note: Data for Norway are for 2010. Norway 232 000126 00089 00050 000 OECDOECDOECDOECD Middle managers (D3 positions) Senior managers (D1 positions) Senior professionalsSecretaries (general office clerks) 2011 USD PPP 0 100 000 200 000 300 000 400 000 217 000121 00073 000 NorwayNorwayNorwayNorway not available
- 4. Open and Inclusive Government Asset disclosure: Level of disclosure of private interests and public availability of information (2012) Source: OECD 2012 Survey on Conflict of Interest Disclosure Serving Citizens: quality of public services out of pocket expenditure as a % of final household consumption Access to medical care (2011) Citizen take-up of e-government services (2012) % of individuals using the internet to interact with public authorities Satisfaction and confidence across public services (2012) % of citizens expressing confidence/satisfaction Source: OECD Health Statistics 2013 Source: Eurostat and OECD Source: World Gallup Poll Government at a Glance 2013 With a focus on public administration, OECD Government at a Glance 2013 provides readers with a dashboard of key indicators assembled with the goal of contributing to the analysis and international comparison of public sector performance across OECD countries. Indicators on public finances and employment are provided alongside composite indexes summarising aspects of public management policies, and indicators on service quality in education, health, taxation and justice. Government at a Glance 2013 also includes indicators on key governance and public management issues, such as strategice governance, budgeting, compensation in the public service, public procurement and open government. www.oecd.org/gov/govataglance.htm http://dx.doi.org/10.1787/gov_glance-2013-en For background data and to consult this publication on line: For more information and to consult all other Country Fact Sheets: v1.13/11/13 50% OECD 100% 0% 25% 50% 75% 78% Norway 40% 66%71% 51% 72% National government Judicial system Local police Health care Education system OECD range OECD 66% 78%82% 81% 80%20 40 60 80 100 Norway 2.9% OECD0% 1% 2% 3% 4% 5% 2.7% Note: Data for Norway are for 2010. Norway 100 75 50 25 0 51 OECD 66 Norway Low level Middle level High level 0 10 20 30 40 50 60 70 80 90 100 0 10 20 30 40 50 60 70 80 90 100