SlideShare una empresa de Scribd logo
1 de 12
Descargar para leer sin conexión
Page 1
WIPAC MONTHLYThe Monthly Update from Water Industry Process Automation & Control
	www.wipac.org.uk												Issue 12/2017 - December 2017
Page 2 Page 3
From the Editor
The one thing that I am asked all of the time is “When are we going to see a Smart Water Industry?” For once I think
that I can conclude that we have started to see the rumblings of one outside of the potable water network actually
start to happen in 2017. In previous years it has been very much provided as a product from some of the key
suppliers in the industry and it is only in a few places that it has been led by the Water Companies themselves in a
situation that is in-house. The most notable of these was EPAL in Portugal with their WONE system and this was
championed by Andrew Donnely. What we have in the potable water industry is certainly the ability and the products
available to deliver a Smart (Potable) Water Network but there is so much more that can be done. As somebody who
mainly works on the Wastewater side of things I frequently ask “Where is our Smart Wastewater System?”
The main question to ask is what is stopping the development of the wider “Smart Water Industry” and what is also
stopping it in the wastewater side of the business in particular. It is the products and “widgets” that are available. The
answer is most certainly not. There are some fantastic innovations that have happened at the ground level as well as the
more systematic level. On a day to day basis in my day job I am well known for getting my phone out and plugging it into
an instrument either via cable or via Bluetooth and if I absolutely have to get a PC out to wander around the inside of an
instrument to find out what is going on then I do. At that level the tools are all there.
Is it a matter of skill and knowledge? My answer to this question is perhaps but then again perhaps not. Again the tools are available for those who actually
want to go out there and get them. Look on your App Store of choice and there are all the manuals in the world for you to look at as most suppliers have put
that knowledge at your fingertips. So on the ground level it certainly isn’t the lack of tools to do the job. Perhaps its a case of not knowing how to use the
tools. It is probably the Water Industries worst kept secret that those with technical experience are mostly going to retire in the next 10 years and despite the
protestations of some that say “things will be fine,” and the skills gap “doesn’t matter” things are going to get difficult. This is a major problem and the
message to the industry has to be “protect your technical people as you will need them,” as if you don’t they will leave and then things will get more
expensive as mistakes will be made and half solutions will be installed that might work but will cost a lot more to run. In short you can’t run an industry on
people managers alone which in some areas seems to be a problem at the moment.
Another problem is of course the half solutions that are installed as when you end up doing a cost benefit analysis of a “Smart Solution” then half of the
benefits have already been delivered and those with holistic solutions should be screaming from the hills that there is so much more to do if you’d just take a
chance. This is what happens when those who don’t necessarily know what they are doing deliver something that is half right but of course doesn’t have the
grace of a solution delivered buy a technical expert.
So what’s changed? Why has the industry woken up to the possibilities that can be delivered? Perhaps it is the work that has been done by the various
forums out there as the Smart Water Network was championed by the SWAN Forum amongst others who have brought people together to say “there is
something here that can be delivered and actually bring some pretty large benefits.” It’s relatively simple on the potable water network as leakage is
something very tangible that is politically sensitive and the need for greater water resilience is particularly being highlighted. On the wastewater side of
things perhaps its been a technology development as processes such as the Nereda process that is being built all over the UK relies on technology and more
importantly instrumentation to work.
Perhaps the driver this year has been the record fines handed out in the UK several times and it is this that caught peoples eyes as the realise that if there
is a more efficient way to operate that will improve things in the industry then perhaps its worth giving it a go. Perhaps it is the every increasing costs of
the industry with an ever dwindling amount of money to do Business as Usual plus all of the additional pressures that the industry faces and perhaps its a
combination of all of this.
What is clear is that the industry is starting to change towards being “Smart,” it is starting to take its digital journey towards Industry 4.0 although quite what it
looks like is something completely unknown and this is where the skills and knowledge comes in. The Technical Expertise is needed and those that have been
looked down upon for wanting to be a technical expert rather than a “people manager” need to be listened to. The future of the industry is going to need its
technical experts to guide the companies towards a future where we have the right things in place and not half solutions that will patch a problem. The future
is where we use our data correctly to inform a decision making process that gives us the ability to do what is best
Have a Happy New Year and a good month
Oliver
In this Issue
From the Editor.................................................................................................. 3
Industry News..................................................................................................... 4-11
Highlights of the news of the month from the global water industry centred around the successes of a
few of the companies in the global market.
2017 - A Year in Review for the Smart Water Industry......................................... 12-13
It is always good to look back at what has happened in the past year and how the industry has
developed. In this review article WIPAC Group Manager, Oliver Grievson, looks back at some of the key
developments in the “Smart Water Industry in 2017.
SmartNetworksOrganisationDesign................................................................... 14-15
When you think about one of the leading companies in the Smart Water Industry you think about i20. In
this thought piece which is part of their Smart Water Networks play-book they have brought together in
2017 they talk about how people and organisational structure is a key to the Smart Water Industry.
Focus On: Analysing the Nitrogen Cycle............................................................... 16-20
The Nitrogen Cycle is one of the key cycles within the wastewater industry. Ammonia is regulated
parameter and much of the UK and Europe is sensitive to nitrate pollution from agricultural as well
as wastewater issues. In this, the most recent of “Focus On” articles we go back to basics on how we
measure the key parts of the nitrogen cycle in wastewater.
Workshops,Conferences&Seminars.................................................................... 21-22
The highlights of the conferences and workshops in the coming months
.
WIPAC Monthly is a publication of the Water Industry Process Automation & Control Group. It is produced by the group
manager and WIPAC Monthly Editor, Oliver Grievson. This is a free publication for the benefit of the Water Industry and
please 	feel free to distribute to any who you may feel benefit.
All enquires about WIPAC Monthly, including those who want to publish news or articles within these pages, should be direct-
ed to the publications editor, Oliver Grievson at olivergrievson@hotmail.com
The picture on the front page is an ammonia monitor in an activated sludge plant and is an Envitech PBS1. The importance of
measuring ammonia is outlined in this month’s Focus on Article about measuring the Nitrogen Cycle
Yorkshire Water trials satellite technology to detect leaks
WWEM & WIPAC to collaborate for WWEM 2018
The Water, Wastewater & Environmental Monitoring Conference and WIPAC are to continue their collaboration at the WWEM Conference & Exhibition due to
take place in November next year. Planning is already well under way for the return of the Instrumentation Apprentice Competition which was started in 2014
by the WIPAC Group and is set to return next year. In a development to the competition it is set to increase in size by allowing Apprentices from outside of the
Water Companies. Teams are already set to join the competition from at least two companies outside of the Water & Sewage Companies who have traditionally
sent their Apprentices to compete.
The WIPAC Flow Forum will also return to the next WWEM which was sponsored in 2016 by RS Hydro. The full programme is yet to be set and this
announcement is in essence a call for papers but subjects that are definitely going to be covered include the maintenance & calibration of flow instrumentation
and the cleaning of electro-magnetic flow meters.
In a new development for WWEM & WIPAC there is also going to be a WIPAC Learning Zone which will join Instrumentation Supply Companies and Apprentices,
Technicians & Engineers together in a series of Master-classes throughout the two days of the conference & exhibition. Calls for interest will be released in the
New Year.
	 13th - 14th March 2018
	 Circular Solutions for Water & Energy for the 4th Industrial Revolution
Manual of Wasetewater Flow Measurement gets the go ahead
For awhile discussions have been ongoing for the WIPAC group to produce a Manual of Wastewater Flow Measurement. It can now be revealed that this has
been to the publishing arm of the International Water Association (IWAP) and the outline book structure has been approved for publishing. The book is set to
be submitted to the IWA in May 2019 and in addition to covering a vast array of the different types of flow monitoring present in the Water Industry covering
how we measure flow in the wastewater industry it will also cover the what, the when and the why.
The manual of wastewater flow measurement is set to be a truly collaborative publication and those interested in helping to collaborate should get in touch
with the Lead Editor of the manual, Oliver Grievson.
Detergent-based artificial tongue identifies bottled water brands
A new, easy-to-make artificial tongue can distinguish different brands of bottled water (ACS Sensors 2017, DOI: 10.1021/acssensors.7b00634). The simple
chemical sensor uses a single type of fluorescent molecule to detect and quantify 13 different metal ions.
Fluorescent sensors are excellent for detecting minute, nanomolar levels of target chemicals in solution in real time. In these applications, molecules typically
include two parts—a receptor portion that binds to the analyte connected to a fluorescent dye. When the receptor binds to its target, it triggers a change in
the dye’s light emission colour, intensity, or duration that can be used to quantify the target molecule’s concentration.
For these types of sensing applications, researchers have typically used arrays of different sensor molecules, each in separate wells in a dish, to measure the
levels of multiple kinds of molecules in a sample. Using such sensor arrays, researchers have made artificial tongues that can identify different soft drinks,
whiskeys, and wines. They could also allow authorities to monitor water quality and permit consumers to test grocery store produce for heavy-metal
contamination. But the arrays are tedious to make and require large amounts of test samples, says Liping Ding, a professor of chemistry at Shaanxi Normal
University in Xi’an. So Ding and her colleagues have been looking at ways to simplify the chemical sensors.
Their new sensor uses a single sensing molecule that can fluoresce at four different wavelengths, depending on the wavelength of light applied to the sample.
As different metal ions bind, they change the fluorescence pattern in measurable ways, producing an output that allows researchers to distinguish them in
solution.
The fluorescent part of the sensor is a pyrene-based dye that the researchers attach to an amine-based functional group that binds metal ions. When added
to water along with the common detergent, sodium dodecyl sulfate, the detergent molecules aggregate to create tiny spheres with negatively charged, water-
loving surfaces and water-repelling cores. The aggregates incorporate the sensor molecules: The hydrophobic pyrene portion of the molecule becomes trapped
within the spheres while the hydrophilic, metal-binding end points outward into solution.
When metal ions are added to the solution, they bind to the metal receptors and interact with the anionic detergent molecules, changing the size and shape of
the aggregates. This structural change in turn increases or decreases the intensity of fluorescence at each of the four wavelengths. Combining the changes at
different wavelengths generates a recognition pattern for a particular metal ion, says Ding. The pattern of changes varies for each metal.
The researchers were able to record unique recognition patterns that serve as fingerprints for 13 different metal ions: Cu2+
, Co2+
, Ni2+
, Cr3+,
Hg2+
, Fe3+
, Zn2+,
Cd2+
,
Al3+
, Pb2+,
Ca2+
, Mg2+
, and Ba2+
. By applying a pattern recognition algorithm to the combined fluorescent signals, they could discern multiple metal ions in a mix-
ture.
Brands of bottled mineral waters have their own signature combination and amounts of metal ions, making them an ideal test of the new sensor. When the
researchers tested such samples with their sensor, they could tell tap water from mineral water and distinguish among eight different mineral water brands.
The sensor could eventually be used to monitor the quality of drinking water or to detect counterfeit bottled water, Ding says.
“This is one probe for all, like ‘One ring rules them all,’” says Pavel Anzenbacher, a professor of chemistry at Bowling Green State University. “This would save
a lot of work on synthesis.”
Yorkshire Water has become the latest water utility to announce it is using satellite technology to help identify underground water leaks from its pipe network.
The company has partnered with Israeli company Utilis, a world leader in satellite water leakage detection and which is represented in UK by Suez Advanced
Solutions, to test out the technology on its pipes in Halifax and also Keighley.
The trial in Yorkshire helped identify 44 underground pipe leaks in both towns that were then quickly fixed by Yorkshire Water’s response team. It was calculated
by the firm that this helped save 330,000 litres of water a day escaping from its network.
Eddy Segal, Utilis vice-president of sales, said: “We use a Japanese satellite that carries a microwave RADAR, capable of penetrating into the ground to the level
of the water pipes. For the trial with Yorkshire Water we specifically analysed the area of Halifax and Keighley for leakage. We are pleased to work with Yorkshire
Water who are one of the leading companies when it comes to the important issue of leakage reduction.”
Jason Griffin, Yorkshire Water’s leakage team leader in West Yorkshire, said: “Most leaks from our pipes do not come to the surface and so are hard to identify.
However, this satellite was able to detect underground water leaks from our pipes within a 100m radius, which makes it much easier for our leakage inspectors
to then pinpoint and repair. On the back of this, 44 leaks were repaired, and this helped stop a significant volume of water escaping into the ground.”
Yorkshire Water is also testing the use of other cutting-edge technology as part of a new strategy to predict and prevent water leaks. This includes drones that
have been used to conduct an aerial topographical survey of 30km of pipework stretching from York to Sheffield.
More than 15,000 acoustic ears are also being installed into the company’s pipe network that are capable of listening to the noise water makes and help
data scientists identify unusual sound patterns that are often a sign of leaks. Yorkshire Water has committed to hire 50 new leakage Inspectors as part of a
multimillion-pound drive to improve the service it offers to customers.
Last month, Severn Trent Water said it had embarked on a trial to detect leaks from space to help achieve its target of reducing leakage levels by 15%. The
company is working with Rezatec, which analyses different types of satellite data and imagery to monitor changes in the landscape near to the pipe, as well as
Utilis.
Page 4 Page 5
Industry News
Sonde monitor helps EA convict river pollution culprit
Pouring waste into sewers rather than taking it to an approved site for disposal has cost luxury coach firm Symphony Chauffeurs and its sole director more than
£21,000 in fines.
The company, based near Heathrow Airport, broke environmental law when staff emptied toilets from the coaches into public drains and contaminated the
River Crane.
Officers from the Environment Agency (EA) turned detective in 2015, tracing pollution in the River Crane to where Symphony operated, a trading estate in
Hounslow minutes from the airport. A sonde monitoring device found the river had been polluted, and other sondes identified Symphony as the source, which
officers confirmed through a network of drains.
The watercourse was further polluted when chemicals and dirty water entered the drains after staff washed vehicles on Symphony’s premises. The firm had
been warned by the EA and the company’s landlords doing so was against the lease. Symphony would have stayed within the law by disposing of the chemicals
at an approved site, or by cleaning cars and coaches at an authorised location.
Symphony Chauffeurs was fined £18,000 by Ealing Magistrates’ Court and ordered to pay £12,113.62 in costs, and a victim surcharge of £170. The company was
charged with allowing poisonous, noxious or polluting matter into the River Crane, between May 2015 and February 2016, and failing to provide the EA with
documents relating to its activities.
The company’s sole director, Allen Jeyakumar, of Greenford, was fined £3,134 by the court for allowing Symphony to commit the offences. Jeyakumar also had
to pay a victim surcharge of £142.
Mathew Reed, who led the EA investigation, said: “Incidents like this have the potential to have a serious and long-term impact on the health of the river.
Symphony Chauffeurs Ltd was given repeated warnings about its activities. People might think we will find it too difficult to trace the cause of pollution, but this
case proves that some detective work leads to a conviction.
“Identifying pollution through a complex network of drains can be difficult, but that doesn’t mean it cannot be done. We have the skills and technology to do it.”
Both Symphony Chauffeurs and Allen Jeyakumar pleaded guilty to all charges at an earlier hearing.
Sewer Sense: Smart Decisions About Sanitary Sewer System Is
Paying Off For Utility And Customers
Using a technology called SmartCover Systems, the Prince William County Service Authority is able to remotely monitor wastewater flows in strategic areas
across Prince William County. A SmartCover is comprised of a small device that electronically monitors the level of flow in sewer mains from the underside of
a manhole cover.
When flow levels reach a certain point, the sensors automatically trigger an alarm that alerts appropriate Service Authority staff to respond. This technology
also displays a graph of the sewage flow level in a sewer main that can be viewed remotely on a laptop in near real-time.
Before purchasing these devices, the Service Authority would have to manually check the flows through manholes on an as-needed basis. This meant when
large rain events were forecasted, a crew could be stationed all night next to manholes to ensure that a sanitary sewer overflow did not occur due to possible
infiltration and inflow of groundwater and rainwater into the system.
“This device helps save Service Authority employees from spending overtime or even regular time on this issue, freeing them up to do other important work,”
Infiltration and Inflow Manager Rob Wilson said.
“The utility evaluated the cost, and the reduction in man-hours and improved level of service more than offset the costs of the device,” added Operations &
Maintenance Director Don Pannell.
The Service Authority initially installed SmartCovers in 2013 in an older area of Manassas where sump pumps and interior drains would deliver thousands of
gallons of rainwater into the sewer system. Since the installation of the SmartCovers in that neighbourhood, the Service Authority has detected and prevented
two potential costly and messy sewer backups.
“It gives us an early warning system in known overflow areas,” said Wilson. “In both of those cases, it tripped the alarm, so our Collection & Distribution crews
were able to flush the lines. That prevented any inconvenience to our customers as well as insurance issues where we might have had to pay to have a few
houses cleaned due to overflows.”
The Service Authority has 10 devices in operation and is interested in adding an eleventh. Since the sensors are small and easy to install, the Service Authority
has been able to move the devices around to better monitor areas where backups and sanitary sewer overflows could cause environmental issues and expen-
sive hassles for some of the utility’s nearly 350,000 customers.
This November, the Service Authority installed sensors in an industrial area near the Potomac River in eastern Prince William County as well as a heavily used
commercial area of Manassas located near a large retaining pond.
The device was installed in Manassas due to concerns about how a large planned mixed-use development upstream might impact that particular manhole.
While the area has not been flood-prone in the past and this fall has been dry in Northern Virginia, the current flow through that part of the sewer-shed is
already nearing full capacity.
“After a couple of rain events, we will be able to take a snapshot with SmartCover to see what is going on at this particular manhole location before any new
development occurs,” said Wilson.
Big data intelligence to drive forward customer service
Yorkshire Water is embarking on a data-led “internet of things” approach that will enable it to obtain real-time information and understand trends about its
water and sewerage operations. Intelligence on the condition of the firms water pipes will enable the company to adopt a predict and prevent approach to
maintenance of its 31,000km of water mains.
To help predict where and when things are going to happen on its network, 15,000 ‘acoustic ear’ devices will be installed into the pipes capable of listening to
the noise flowing water makes.
Data generated by this technology will then be analysed by a new team of data scientists, based at the company’s Bradford based control room. It is expected
by the firm that this data rich intelligence will make early interventions possible to ensure customers’ water supplies are disrupted as little as possible.
Steve Mallinson, Networks & Grid Optimiser at Yorkshire Water said: “We’ve created a bespoke system that allows us to really understand the water patterns
in our pipes throughout Yorkshire. It will give us a vast amount of intelligent data that can be analysed to help control the flow of water and prevent bursts and
leaks happening. It will also help us to try and repair any issues within just three hours, rather than the current average of three days.”
Yorkshire Water will also be installing 8,000 similar devices into its sewers to better understand how its waste water network operates, with triggers and alarms
fitted to help protect the environment and customers from sewer flooding.
In what is believed to be a first in the water industry, Yorkshire Water is considering adopting an “open data” approach, allowing the growing Yorkshire based
community of independent data scientists secure access to its data streams. This will enable the company to work closely with the growing Yorkshire community
of digital developers to help find new and innovative solutions to pollution and leakage problems.
The work forms part of a wider multi-million pound package announced this month by Yorkshire Water that will create 300 new jobs to help the firm become a
top performer in the water sector.
EPALaunchesSecondPhaseOfTechnologyChallengeForAnAdvanced
Septic System Nitrogen Sensor
Recently, the U.S. EPA and its partners announced the second phase of a technology challenge for an advanced septic system nitrogen sensor. The goal of this
challenge is to inspire innovators to develop a sensor to monitor nitrogen discharged from advanced septic systems.
In Phase II, sensor developers will apply to have their sensor prototype screened and field tested. The Challenge opens on December 18 with an informational
webinar, and submissions are due by the end of January 2018.
Preliminary screening will take place at the Massachusetts Alternative Septic System Test Centre (MASSTC) EXIT in March 2018. Sensors that meet or exceed
the performance goals will then undergo six months of field testing at MASSTC. EPA will award International Organization for Standardizations (ISO) EXIT
Environmental Technology Verification (ETV) 14034 reports for up to three sensors.
In Phase I of the Advanced Septic System Nitrogen Sensor Challenge, launched in January 2017, EPA partnered with The Nature Conservancy, USGS, and others
to challenge entrants to design a nitrogen sensor for use in advanced on-site wastewater treatment systems, also known as advanced septic systems, to moni-
tor their long-term performance.
Conventional septic systems are not designed to remove nitrogen, which can lead to problems like nitrogen loading to waterways. This issue is especially impor-
tant to coastal communities, where excess nitrogen causes toxic algal blooms leading to beach closures and degrades water resources. EPA estimates that over
2.6 million existing systems could be good candidates for advanced septic systems that treat the nitrogen due to their location in nitrogen-sensitive watersheds.
Adding nitrogen sensors to these advanced septic systems will help manufacturers, homeowners, and local and state governments ensure that these systems
are performing as intended and protecting valuable coastal resources.
For more information about the Challenge, visit: https://www.epa.gov/innovation/advanced-septic-system-nitrogen-sensor-challenge-phase-ii-prototype-test-
ing
Page 6 Page 7
Data science - putting it all togetherDigital Water: How One Community Saved More Than $20 Million By
Finding Leaks With Data
Tennessee’s White House Utility District saw employee productivity go up, expenses go down, and a major capital expansion go away.
White House Utility District (WHUD), Tennessee’s largest geographic water utility serving approximately 90,000 consumers and businesses, is using data to stem
water loss and create savings for its customers. Detailed in a newly published paper, the District’s work began in 2015 with a dilemma: how to meet growing
demand for water within the budget and capital constraints faced by municipal and mid-sized utilities everywhere?
Early projections indicated that WHUD might need to invest up to $15 million to $20 million in transmission upgrades and treatment plant expansions to meet
its service commitments. Expanded capacity would also mean higher expenses in terms of energy — approximately 30 percent of the cost of producing water
— employees, chemicals, and maintenance.
Rather than launch an expensive construction project, WHUD opted for another route — partnering with OSIsoft, Matchpoint, ESRI, and Hydreka to develop a
system to pinpoint underground leaks through software and smart meters. The results:
•	 WHUD had an infrastructure leakage index (ILI) of 2.86 in 2012, which meant it was losing approximately 32 percent of its water through water main
leaks.
•	 In less than four days, WHUD discovered a local stream was a water main leak spilling approximately 147 million gallons a year, or enough for 2,239
homes.
•	 In two years, WHUD recovered $900,000 worth of water and has been able to drive its ILI down to 1.49, with a goal to continue reducing water loss
in the years to come.
•	 The ‘smart meter’ approach also allowed WHUD to avoid $200,000 worth of SCADA upgrades and recover $30,000 in employee time and productivity.
•	 The time needed to prepare reports on potential problems dropped from six hours to 10 minutes.
•	 Perhaps most importantly, WHUD avoided the multimillion capital expansion. WHUD estimates that the interest payments on the bond payments
alone would have come to $600,000 per year. WHUD predicts it will not need a major capital expansion until 2028.
The Deluge Of Leaks
Recovering water from leaks costs on average $1.21 per 1,000 gallons in the U.S., according to data from Bluefield Research, or less than half the cost of
traditional water ($3.90 per 1,000) and far less than newer solutions like desalination, which averages over $8.00. Leakage control is even less expensive than
encouraging consumers to conserve, according to data from the California Public Utilities Commission.
Water lost through leakage is also prevalent. Globally, the World Bank Estimates that we collectively lose 32.6 trillion litres a year, or nearly enough to fill China’s
Three Gorges Dam.
While The City Sleeps
To accomplish its goals, WHUD segmented its service territory into 33 district metered areas (DMAs) with Hydreka’s Hydrins2 insertion meters and in
consultation with Matchpoint. Data from this network of meters was then delivered to OSIsoft’s PI System, a software platform that collects, cleans, and
structures data from different devices to give engineers and technicians real-time insight into their overall operations and asset health.
Rather than try to understand consumption patterns in daytime use, WHUD monitored water consumption rates between 1:00 a.m. and 4:00 a.m., when few
consumers would be awake and legitimate consumption would be at the lowest level within a DMA. If a DMA exceeded a threshold value of 0.5 gallons per
minute per household during this time period, PI System data would be employed to narrow down the location of a potential leak. The data would then be
placed on an ESRI ArcGIS map so maintenance crews could prioritize repairs.
“Without us knowing there was a problem in that area, we would have never been able to stumble upon that leak,” said Carl Alexander, GIS Director at WHUD.
“Since implementation, this has held true with potential leaks being found daily, some so small they could have gone undetected for years. We have also been
able to pro-actively notify customers that they may have a leak, so it has really been win-win.”
“White House Utility District has demonstrated what can be accomplished through digital technology. Just as important, WHUD has shown that analytics and
Big Data aren’t just for large utilities with extensive engineering departments. These tools are accessible to organizations of any size,” said Gary Wong, Industry
Principal for Water at OSIsoft. “Water utilities could become one of the most important test beds for analytics.”
It’s only when different data sources are pooled and cross-correlated that the full power of IoT analytics and artificial intelligence can be realised for water
companies
For a long time, water companies have been collecting a large amount of data in one form or another. Information is gathered for a specific project, for
operational reasons, or as a need to solve or help to solve a problem, coming in all shapes, sizes and frequency. Data could be in the form of numbers, an alarm,
customer call, a twitter message, an email, a letter – it is not the format, but what is done with it, that is key.
So what is the meaning and purpose of the data collected?
Is the data collected answering questions, such as “is the equipment performing as expected?”, “is the network performing as expected?”, “are leaks being
fixed efficiently?”, “is customer service top-notch?”, “are customers receiving the service they expect?”, “are costs being reduced while operational efficiency is
improved?”. The questions go on and on…
It’s true to say that on one level or another, water companies are going through a digital transformation, but the real potential of data to make operations more
efficient and cost effective is yet to be fully exploited. Some may argue that the reasons for this is the general conservative position of some companies and the
embedded siloed works, or potentially the lack of support from the stakeholders to do something from a different stance.
It can be a daunting task to maintain equipment and sensors, due to the vast numbers deployed and the scarce physical resources. Data could be continuously
coming in as planned, or it might be received with interruptions, but the same questions should be asked: “can I trust the data received?”, “why is the data
intermittent?”, “how do I distinguish noise from effective data?”, “how can I make effective use of the data?”, “how do I maintain my sensors efficiently?” and
so on. A lot of data is collected through SCADA / telemetry systems. However such data might not be a reliable source, or may only being used for a specific
purpose, and thus not utilising its full potential that it could achieve with cross-correlation with other data sources. Companies should be moving away from
siloed work and embrace a holistic approach.
This is where data science plays a role, with analytics, IoT and Artificial Intelligence using existing data and transforming it into operational and business
decisions.
PR19 methodology focuses on four key themes: Customer Service, Resilience, Affordability and Innovation. Innovation is also part of how Ofwat will assess the
water companies’ business plans, which in turn will award companies with an “exceptional or fast-track status” for those that are ambitious and innovative with
high quality business plans that benefit customers. These companies can not only expect higher financial returns, but they will have their reputation recognised
for being the best.
One way that water companies can innovate is using their existing data by leveraging new technologies and advances in IoT analytics to improve the reliability
of their clean and wastewater networks.
Several cases already in place show that Artificial Intelligence-driven predictive maintenance of assets leads to fewer failures, fewer pollutions or outages and
lower overall maintenance costs. As such, it falls squarely within the resilience theme, with potential longer-term effects on affordability. Additionally, the
Artificial Intelligence platform itself supports multiple objectives such as proactive communication to customers of network problems, understanding and
dealing with customer contacts efficiently (customer service theme) and transformation of a water corporation into a digital enterprise (Innovation theme).
Sensus honoured for rural smart technology innovation
For the second year in a row, rural cooperative utility leaders honoured the Sensus Advanced Metering Infrastructure (AMI) solution from Sensus, a Xylem
brand, as the “Best Smart Utility Solution” during the Rural Smart Grid Summit (RSGS).
Powered by the FlexNet® communication network, the Sensus AMI solution helps utilities and co-ops build a smarter infrastructure that can support multiple
applications. The solution consists of advanced metering for water, electricity, gas and lighting applications, all connected by the FlexNet system.
The network securely transmits and receives data to help utilities and co-ops make better decisions now and in the future. What often begins as smart metering
can develop into a more robust grid modernization effort that supports wide-ranging system measurement and control.
SUEZ Announces Upgrades And Enhancements To Its InSight Asset
Performance Management System
Seeking to bring the next generation of its advanced digital solutions to water treatment professionals around the globe, SUEZ Water Technologies & Solutions
recently announced upgrades to its InSight asset performance management (APM) system. InSight’s secure, cloud-based interface uses data and analytics to
ensure assets operate at higher levels of reliability, efficiency and output.
Incorporating modern digital design trends and best practices, the latest InSight release from SUEZ offers users greater visibility and transparency into the
operations they manage—whether at an enterprise, plant or even asset level. Improved visualizations—including a new geomap feature—and simplified
navigations aim to make InSight easier to use, while expanded reporting and file management features enable sharing and analysis of key data points at all
levels of an organization.
“As one of our core digital solutions, it’s crucial that InSight continues to evolve to meet the dynamic needs of our customers and the water industry as a whole.
Offering faster and more comprehensive access to data and reporting, the latest InSight upgrade helps users to make better business decisions, eliminate
unplanned downtime and lower operating costs,” said Ralph Exton, chief marketing officer, SUEZ—Water Technologies & Solutions.
The new enhancements to InSight include four main capabilities:
•	 Geomap and asset fleet view—new dashboards provide enhanced views of all the assets managed and key performance indicators across multiple
plants.
•	 Modernized user interface and navigation—new data-oriented views provide easy access to the information used on a daily basis.
•	 Multi-site reporting—InSight’s expanded multi-site reporting capability provides a new level of visibility and transparency to an organization.
•	 Enhanced file management—users are offered additional structure and flexibility within the file management feature of InSight.
Page 8 Page 9
What will the pump of the future look like?
Few components in plant and equipment engineering are as steeped in tradition as the pump. But how does this fit in with the age of digitalisation? And is it
even possible to design a hydraulic element that is fit for Industry 4.0?
German manufacturer KSB is one firm which has been reconciling these two worlds successfully for some time now. The company is primarily focused on the
optimisation of pumps – knowing the exact load profile and tuning the pump to the ideal operating point. This is borne out by the sheer number of different
pump casings and materials used and the impeller adjustment options available. However, conditions can change during the life of a pump, and it often happens
that a pump no longer runs at the optimum operating point.
This also applies to newly installed pumps. For years now, KSB experts have therefore been investigating how to optimise pumps more easily without using
complex analytics or even having to replace the pump.
Digitalisation offers tremendous potential for this. However, it takes time to develop new approaches and put them into practice.
“It’s a matter of transferring decades of experience and expertise into an algorithm and a software solution,” explains Dr Thomas Paulus, Head of Programme
Office Digitalisation & Startup Projects at KSB. “This cannot be done in a single step: It involves many different components and aspects. By bringing together
these component parts, however, you end up with an intelligent and practical concept that provides real added value for the pump operator.”
Step 1: Digital Monitoring Unit
The first step in this direction is a monitoring unit which shows in plain language what goes on inside a pump. KSB’s ‘PumpMeter’ monitoring unit, which
fulfils this function, comprises pressure sensors as well as an analysing and display unit fitted to the pump. Two sensors in the pump measure the suction and
discharge pressures around the clock. The PumpMeter uses this data to calculate the differential pressure and determines the current operating point, which is
updated continuously in real time.
A typical four-quadrant pump characteristic curve shows the range in which the pump is operating at a point in time. A flashing outer segment on the left or right
of the display indicates that action is required – because the flow rate is either extremely low or too high. A flashing third quadrant in the pump curve indicates
the optimum operating range. If the segment on the left (the second segment) is flashing, this indicates a long-term need for optimisation. This display allows
the operator to evaluate the operating point immediately upon start-up and adjust the pump accordingly. Operators can see at a glance whether the availability
of their pumps is at risk and whether they are operating economically. A flashing EFF (energy efficiency) symbol also indicates potential for significant energy
savings.
Step 2: Cloud analysis, including vibration characteristics
This analysis now needs to be simplified further. In the future, instead of using wetted sensors, it will be possible to record vibrations and transfer this
operating data to the cloud using mobile communication. This has two advantages: First, conventional measurements using wetted sensors are not always
straightforward, particularly when the medium being pumped is a chemical product. Second, cloud access means that technicians can obtain information about
the status of a pump from anywhere in the world without having to be on site.
This application is currently being piloted very successfully with 100 selected project partners. “Those involved include some automotive suppliers, who are
very open to the project.” Measurements taken in parallel using the PumpMeter are being used to verify the values obtained using the vibration sensor. At the
same time, the KSB team is continuing to optimise the underlying algorithms. According to Dr Paulus: “Based on these results, it is already easy to see whether
it makes sense to switch to closed-loop control, whether the settings or modes of operation need to be changed, or whether it would be better to buy a new
pump.” The operating data is transferred to the cloud via a portal. KSB processes the data and the user receives an automatically generated PDF with clear
recommendations and, where applicable, improvement suggestions for the pump.
Step 3: Operating Point Optimisation
How can these improvement suggestions be put into action? The traditional approach would be to call a service technician. But what if it were possible, based
on the information obtained, to adjust the pump using software instead of having to adjust the impeller manually?
“This is actually possible with our MyFlow Technology,” says Daniel Gontermann, Head of Product Management - Drives and Mechatronic Solutions at KSB.
This is a combination of the KSB SuPremE IE5 motor and the MyFlow Drive, which is based on the proven PumpDrive speed-control system. The conventional
approach for fixed speed pumps is to match the flow rate and head to the calculated operating point by trimming the impeller. Now, the pump can be adjusted
by changing the speed.
MyFlow Technology already offers many advantages in day-to-day work. Because the operating voltage of the IE5 synchronous reluctance motor is modulated
by the minimum frequency inverter mounted on the motor, it can be used in almost any power grid around the world. This is also a huge advantage for global
engineering contractors because they no longer need to consider the local mains voltage when selecting pumps. The direction of rotation is now defined at the
factory, saving the time and costs usually incurred by conventional direction-of-rotation checks.
Step 4: Software-controlled pump adjustment
“Although these advantages make the pump operator’s job much easier, they are not enough to make a pump fit for Industry 4.0,” acknowledges Daniel
Gontermann. “Nevertheless, they form the basis for the next crucial step: pump optimisation using virtual impeller trimming.”
In the further course of the product life cycle, the pump speed can simply be adjusted to individual requirements by smart-phone – pump optimisation with
virtual impeller trimming. “A software application can be used to bring the pump closer to its optimum operating point,” says the pump specialist. Unlike with
mechanical impeller trimming, the operating process does not need to be interrupted. This is how you can quickly and economically optimise energy efficiency
if the actual Q/H point deviates from the design values, or respond to a system-induced change in the operating point. “Because a change in speed is always
associated with a change in power, substantial savings can also be made,” says Daniel Gontermann.
Pump optimisation through virtual impeller trimming is fast and convenient by smart-phone or tablet via a Bluetooth gateway. “During development, special
attention was paid to security. The KSB FlowManager app establishes a point-to-point connection, which ensures that the correct pump is being addressed, and
only by the person entitled to do so,” says Daniel Gontermann.
“The great thing is that you can now defer the individualisation of the pump to a much later point in the supply chain, which of course means that fewer variants
are required.” This is another aspect that is likely to play a major role in pump selection in the future. With individual fixed speed adjustment, fewer pump sizes
now cover the entire selection chart – with efficiency and NPSH values remaining practically constant. The variant complexity for hydraulics is reduced by more
than 50%, saving time and money on design and administration. “Simply reducing the complexity by having fewer variants will promote the topic of virtual im-
peller trimming,” says Daniel Gontermann.
Conclusion
Original equipment manufacturers (OEMs) will be the first to benefit from the new opportunities presented by digitalisation, by being able to drastically reduce
their stock, for example. Nevertheless, this shows the direction in which pump technology will move. “Digitalisation is not an end in itself,” emphasises Dr Paulus.
“Our users will only accept the new technologies if they bring added value to their day-to-day work and, above all, are workable.”
This last point is certainly one of the greatest challenges.
“In the same way that we have been getting the most out of pumps in terms of performance and efficiency for decades, we are now also making progress in
developing the algorithms and software,” concludes. “Without our many years of pump expertise, it would be simply impossible to make a pump fit for the
Industry 4.0 era.”
Xylem To Acquire Pure Technologies
Xylem Inc., a leading global water technology company, recently announced that it has entered into a definitive agreement to acquire all the issued and
outstanding shares of Pure Technologies Ltd. (Pure) for CAD $9.00 per share in cash, representing an enterprise value of CAD$509M, or USD$397M. Pure’s
Board of Directors has unanimously approved the transaction and recommends that Pure shareholders vote in favor of the transaction.
Pure provides unique diagnostic and analytics solutions and services based on proprietary technologies to address key water and wastewater infrastructure
challenges. It is a leader in intelligent leak detection and condition assessment solutions for water distribution networks, a rapidly growing market driven by the
increasing adoption of digital solutions to improve utilities’ capital and operating efficiency.
“The addition of Pure will strengthen Xylem’s position as a leading provider of intelligent solutions that address the water industry’s most persistent problems,”
said Patrick Decker, Xylem President and Chief Executive Officer. “Aging infrastructure is a top concern of water utilities around the world, and infrastructure
assessment is an attractive, growing market that directly addresses this challenge in a cost-effective way. Pure’s solutions strongly complement the broader
Xylem portfolio, particularly our recently acquired Visenti and Sensus solutions, creating a unique and disruptive platform of diagnostic, analytics and optimiza-
tion solutions for clean and wastewater networks. Pure will also bring greater scale to our growing data analytics and software-as-a-service capabilities. As one
company, we will provide customers with even more powerful and innovative solutions enabled by cutting-edge technologies.”
Earlier this year, Xylem and Pure entered into an exclusive commercial partnership in which Xylem represents Pure’s products and services in parts of the Middle
East, India and Southeast Asia.
Mr. Decker continued, “We have already begun executing on significant international growth opportunities through our existing commercial collaboration.
Upon closing this transaction, those efforts will accelerate and expand globally. We are excited to be adding a tremendously talented team to Xylem that shares
our commitment to bringing innovative solutions to the water industry. We look forward to continuing that work together to create substantial value for our
customers and shareholders.”
Pure reported consolidated revenue of CAD$126M and CAD$21M in adjusted earnings before interest, taxes, depreciation and amortization (EBITDA) for the
12 months ending September 30, 2017. Xylem expects to achieve at least $12M in annual cost synergies within two years of closing, including elimination of
redundant public company costs, and procurement and footprint consolidation opportunities. Xylem also expects to generate revenue synergies that include
accelerated international growth and cross-selling of complementary customer solutions. The USD$397M valuation represents a multiple of approximately 17x
2018 estimated adjusted EBITDA for Pure, or approximately 11x including run-rate cost synergies.
“Throughout Pure’s evolution, we have been committed to delivering innovative and value-added solutions for our infrastructure clients,” said Jack Elliott,
President and CEO of Pure. “Following this transaction, as we become part of a larger, global enterprise, we will be even better positioned to make a meaning-
ful impact in solving the world’s most pressing water and infrastructure challenges. The acquisition of our company by Xylem will be of substantial benefit to
Pure, its clients and employees.”
Head-quartered in Calgary, Alberta, Pure has approximately 500 employees globally. It has corporate offices in Mississauga, Ontario, and Columbia, MD, as well
as regional offices across the U.S., Mexico, Colombia, Australia and China. Approximately 90 percent of its 2016 revenues were generated in North America.
Xylem will finance the transaction with cash and low interest, short-term debt. The transaction is subject to various customary closing conditions, including
receipt of Canadian Court, Pure shareholders’ and regulatory approval under the Hart-Scott-Rodino Act (United States). It is expected to close in the first quarter
of 2018.
Page 10 Page 11
Opinion:
2017 - A Year in Review for the
“Smart Water” Industry
It is towards the end of each year and the beginning of the next that you see commentaries from various institutes asking themselves what they have done in
the year gone by and what to expect in the future. In a brief article this month I will look back at how the use of instrumentation, control, automation & data has
developed in 2017 and what to expect in the year ahead. In this article a retrospective look at what industry has done albeit it with what is bound to be with a
bias to what has happened in the UK (although I will try to expand things beyond these shores my ears don’t always stretch so far as I’d like).
The question of the article – what have we actually done as a Water Industry in 2017? On a positive note, certainly in the UK, steps have been taken to acting
“Smarter,” the Water Companies are starting to take a step towards “Industry 4.0.” General trends include:
•	 WITS-IOT are starting to develop and the Water Industry Telemetry Standard is starting to become almost “Business as Usual” within the
industry.
•	 A huge amount of meetings about how to deal with data with the Water Companies realising that within their supply chains there is an
incredible amount of talent that with collaboration can solve some of the problems that the industry faces. Some of the Water Companies
have hosted innovation days and Hackathons to collaboratively work on some of the key problems the industry faces.
•	 There have been interesting developments in communications protocols with the HART protocol, that has been an industry standard for
main years in other industries, is finally coming to the foreground in the Water Industry.
•	 The use of Bluetooth to communicate with instruments and the use of applications to communicate and programme devices remotely
rather than using the display panel.
•	 The use of radar level becoming more widespread with a cheap entry level radar being released and the development of a narrow-beam
80 GHz radar
•	 Improved use of data and actually converting it into information to promote informed decision making with a fantastic project
demonstrating the uses by Severn Trent Water at their works in Spernal and also in the distribution network
•	 It has also been the year where non-contact area velocity flow monitoring has come to the forefront and the applications of the technology
stretching out into the sewer network where the pressures for increased monitoring are mounting so that better control of the collection
network can be seen with organisations such as Unity Water
•	 Industry trends have been highlighted through reports by Black & Veatch and OFWAT as well as case studies being developed and
championed by forum’s such as the SWAN Form and the Future Water Association
•	 The use of laboratory techniques on the Water Treatment Plant as demonstrated by Affinity Water & Anatune for the analysis and
management of Metaldehyde.
These are just a few of the great things that have happened in the past year (or two realistically) and its important to focus on a few of the events that have been
mentioned above in greater detail.
The first aspect of 2017 to highlight is the work that has been done by
organisations such as Severn Trent in the UK and by Unitywater in
Australia which have shown how data should be operationally used by
Water Companies in both the potable water and the wastewater side of
the business. The SWAN forum conference that was hosted in London saw
a huge amount of case studies of where data can and should be used and
one of the simplest innovations that was discussed was that by George
Theo, the CEO of Unitywater in Australia. Simply put the bills within
Unitywater haven’t gone up for a number of years now because they have
used the data that they collect everyday in a truly effective way.
They have a handle on what water is leaking in their network and as soon
as the cost of the leak is more than the cost of the repair a work order is
automatically raised to affect the repair. In this way non-revenue water is
kept to a level where it manageable. This sounds so sensible that it should
just be something that is business as usual across the industry but if fact
to actually do something this simple is incredibly difficult.
Another case study of how the “Smart Water Industry” should work
is the work that Severn Trent Water have done at their wastewater
treatment works at Spernal as well as on the potable side too at their
works at Trimpley. This in fact is a project that has been rumbling around
in the background for several years and I’ve been hearing about the
Spernal project for awhile. It is fair to say that 2017 saw its “grand
reveal” to the industry at wide. A project that was collaboratively
delivered by the company’s innovation & operational teams has seen the
right instrumentation installed in the right place for operational needs to
drive an informed decision making process and displaying it in the right
way has empowered the operational teams on site so that they know what is going
on at any particular time. The cost savings that this has gleaned have a return on
the initial investment of around 30 months, a no-brainer for most water companies.
. Typically this sort of advanced system has been limited to larger sites which have
the economies of scale but at a population equivalent of around 50,000 this is not
the case at Spernal making the project all the more impressive. Severn Trent Water
are certainly the company to watch in this area as the questions from the company
itself is…..we’ve done this….what next?
The use of instrumentation on treatment works was also demonstrated by
Affinity Water and Anatune to bring the “laboratory” analysis of Metaldehyde onto
the treatment works and use the analysis to manage an industry-wide
problem. Metaldehyde is notoriously difficult to analyse for and collaboration
between Affinity Water and Anatune saw what is effectively a laboratory grade
level of equipment turned into an online monitor that was installed on a potable
water treatment works to allow the analysis of different water sources to manage
the problem that the company has. This is a limited application to address a specific
problem but one of the impressive things about the project apart from the actual
instrument that was installed was the way that Affinity Water and Anatune shared
the risk of the project and worked together to address the problems that were
encountered.
In the wider industry their does seem to be a move towards the “Digital Water Industry,” which is certainly a step forward. The Severn Trent projects at
Spernal and Trimpley are an operational development in this regard and there are numerous ways in which this can improved upon. In fact we are starting to
see this approach taken on a more holistic approach. This has been mirrored in the work that both the Environment Agency and OFWAT have been working on
for PR19. There was always a psychological barrier in the Water Industry in the UK where the network (be it distribution or collection) was kept separate, you
had infrastructure and non-infrastructure on both the potable water and wastewater sides of the business effectively creating four distinct parts and never the
twain shall meet. Most recently, certainly on the wastewater side the barriers have started to erode. The Environment Agency with the event duration
monitoring project and more recently the FFT control projects are bringing down the barriers so that network and treatment can work together pulling down
the psychological design barrier that exists in the industry. This will certainly help with operational control. But where does the digital industry fit in? Is it a true
Industry 4.0 or a nod to a concept that has the potential to change the way the industry works.
OFWAT published their feeling on the subjects in their digital paper in 2017 however the most disappointing point of it was that it was limited to the customer
only. This only fair as this is their area of responsibility but it was certainly a missed opportunity as it could have stretched so much further. However it was an
idea of where they are coming from and I am sure they expect to see some aspect of the Industry’s future plans covering this area. If it isn’t looked at now then it
is a big missed opportunity moving forward as can be seen by the work of Unitywater looking at the operational use of data and the digital industry can directly
impact on the cost of the industry and thus on customer bills. The industry has been working hard in these areas with at least a few “hackathons” to look at
using data and converting it to useable information and various water companies have promised the make the data that they can make “open.” Care has to be
taken though as there are General Data Protection Regulations (GDPR) to take into account which includes customer privacy.
2017 has also been the year where Cyber-Security has come to the forefront of the industry. There was always teams within the companies protection the
digital assets but they were always somewhat hidden. In 2017 their previous work and future challenges have certainly been highlighted all together with the
challenges of the digital industry. This all wraps into a world that few people within the industry understand with communications protocols, the Internet of
Things and WITS. It has tended to be something that has just happened and has been restricted to the few that fully understand what happens and how the
data gets from one place to the other. Moving forward within the industry it is going to get more and more important. Everyone talks about the connected
industry and one of the comments in the Black & Veatch industry trends report the number of connected devices is set to quadruple to 200 billion on a global
basis and some of these “things” will be connected to the Water Industry be it a customer smart water meter connected to the Smart Home or a technicians
table connected to an instrument.
This is one of the last things to talk about in the Water Industry this year and that is the proliferation of things that can be connected to instruments. Bluetooth
has been around from a domestic point of view that was originally invented in 1994. It has taken 23 years for it to be connected to instrumentation and use to
diagnose and programme the instruments. This is relatively young when compared to the use of the HART Protocol (Highway Addressable Remote Transducer
Protocol) that was invented by in the mid 1980’s by Rosemount and was made an open protocol in 1986. 31 years later it has started to be used in the Water
Industry in earnest, between the use of Bluetooth and the HART protocol (which is already in most of the instruments that the industry have installed) there is
a huge amount of data that can at least be used on a local basis to help keep the instrumentation operating correctly. It will be moving forward and education
for the industry to understand what it already has in place.
In the past there have always been the complaints that the “Smart Water” Industry has been something that has shows a huge amount of promise that has
never been realised. I think it is fair to say that we, as an industry, are starting to realise it right now. Previous years have seen the development of Smart Water
Networks and if you have any doubts about their delivery then speak to the Smart Water Networks (SWAN) Forum who will give you case study after case study
of things that are in place now. The Wastewater Collection Network has seen developments within the past two to three years building on top of innovations
seen around the world in cities like Barcelona, Cincinnati & Copenhagen amongst others and the networks are developing faster and faster. With the advent of
Event Duration Monitoring in the UK and in 2017 some fines of an order of magnitude higher than most has given the impetus the industry needs to develop
more intelligent solutions.
So, 2017 has been a year where the industry has taken a step forward, albeit a baby one. There is a lot of potential that is going to be developed over the coming
year and onwards into the future which will see the baby steps potentially turn into some giant leaps for the Water Industry not just in the UK but potentially
across the glove. The “Smart Water” Industry has always shown plenty of promise as to how it can support the day to day operations and it is potentially now
that we are seeing at least some of that promise being realised.
Figure 1: The Spernal Effluent Factory Approach
Figure 2: Affinity Water/Anatune Metaldehyde Project
Page 12 Page 13
Article:
Smart Networks
Organisation Design
Water company organisation design is out of date. Four major issues need addressing:
•	 Tactical orientation around regulatory targets needsto be replaced by a more strategic approach
•	 The long view has been neglected because of thecompelling demands of the short-term
•	 Technology is changing how the network ismonitored and operated from a largely manual to a remote and automated paradigm
•	 Large amounts of data are becoming available and this has to be used to the greatest effect
Tactical vs strategic
The UK has had a fairly effective regulatory regime in place since the industry was privatised. The regulatory requirements have included a number of specific
metrics, and organisation design has tended to orient around the achievement of regulatory targets. This is most obvious in the creation of the role of Leakage
Manager.
The downside of this approach is that targets become an end in
themselves. Each department pursues its own separate agenda and
there is no easy mechanism for reconciling conflicting aims or assessing
opportunities for solutions which have wider benefits. Network
monitoring and pressure management are good examples of
solutions whose benefits cut across a range of regulatory targets.
Figure 1 shows the wide range of sizeable benefits that advanced
pressure management delivers.
It appeals to the Leakage Manager and to the Energy Manager and
to Customer Services and to the Finance Manager and to whoever is
unfortunate enough to feel responsible for customer minutes lost. But
only in the most enlightened water companies are these people likely to
come together and spontaneously pool time and budget to specify and
procure such a solution.
Organisation design needs to take much more of a process view of water
distribution, and a holistic view. Regulatory targets need to be shared
responsibilities to which many people can contribute. Someone with
a financial background who understands the network needs to assess
the return on investment of projects for the whole network not just an
individual department.
The long view and the short view
Because the water network consists of old and ageing infrastructure, and because it has consisted mostly of manual tasks, thinking is typically quite short- term.
People have to spend the majority of their time dealing with the problems that present themselves: a burst, a leak, a new housing development.
What needs to change is that more work needs to be put into planning, prediction, and prioritisation. The challenges that ageing infrastructure and growing
urbanising population present are only going to get bigger.
This requires the ring-fencing of time or people to do this work to get the organisation onto the front foot.
Embracing technology
Anyone who works in the water treatment area can observe a 50 year history of remote and automated operation. But in the network world, this is brand new.
Since around 10 years ago, pervasive mobile communications, battery life, and low power electronics have been making remote and automated operation
possible.
Pump stations should no longer be the province of control but should belong to the network team. There was a time when the fact that pump stations were
mains powered and could be remotely operated and monitored meant that they were unique in the network world and much more akin to the water treatment
world. It was logical to include them in the domain of the Control team.
But today battery power means that much of the network can be remotely operated and monitored. It is time for pump stations to return to their logical
owners – the network team – so that their role in network performance can be fully assessed, and their contribution to delivering performance and resilience
requirements can be optimised.
Figure 1:Benefits of Advanced Pressure Management
Data analytics
The reducing cost and increasing availability of sensors, and their ability to return more data more often
is creating a tsunami of data. Historically, network knowledge has often been the province of the longest
serving employee.
Technology is enabling data to be processed quickly, effectively and tirelessly at every time of the day
and night. If this is to be harnessed with in-house capability then the right skills need to be acquired and
housed in an organisation that is not used to the sort of people who can code in R. If this is to be harnessed
from suppliers, then the skills to specify what is required are nonetheless necessary.
Another aspect of this change is the requirement of the organisation to become more data driven in its
decision making, and less reliant on opinion. This is a cultural change which will need to be championed
at the top of the organisation.
The organisation design in figure 3 offers a template for how to organise resources to take account of these 4 issues.
Two important things need to be said about it.
The first is that no organisation design is perfect. Every organisation design has its strengths and weaknesses, and its white spaces which need to be managed
carefully. It is easy to pick holes in a proposed design. But the question you need to ask is whether, on balance, it offers a better way forward than your existing
design.
The second is that all organisation designs need to accommodate the specific capabilities of a particular company’s employees. It may make sense to combine
areas and teams, or to split out a particular function, to reflect the skill-set of individuals. However, it would be unwise to go too far down this road because it
becomes much more difficult to replace leavers if the organisation design is moulded uniquely to them.
Whatever organisation design you choose, you should satisfy yourself that it enables you to deliver your business objectives, and address the challenges you
face and the opportunities that you have.
Figure 2: Data Analytics
i2O provides a suite of smart network solutions to help water utilities respond to the
challenges created by increasing and urbanising population, more extreme weather events,
old and ageing infrastructure, an ageing workforce, more demanding and more vocal
customers, and a lack of appetite for increasing bills.
The business benefits achieved by i2O’s clients include 20-40% reductions in leakage, bursts,
operational costs and energy bills, more than 5 years added to asset life, improved customer
service, and a return on investment within 12 months.
Page 14 Page 15
Focus On:
Analysing the Nitrogen Cycle
Introduction
Nitrogen in its many forms has a direct impact on the environment. Ammonia is
toxic to fish, Nitrous Oxide is a major greenhouse gas and nitrate is a major source
of nutrients and in the water environment along with phosphorus is a major cause
of eutrophication. In the right place it is one of the essential nutrients for growing
things but like a rose in a wheat field can be classed as a weed so can nitrogen in
the aquatic environment.
As such both ammonia and nitrate, the major forms of nitrogen in the aquatic
environment are heavily regulated. Ammonia is a key regulated parameter in
wastewater treatment under the Urban Wastewater Treatment Directive. At the
low levels of ammonia in some consented discharges its treatment comes at
relatively high cost but it is treatable to relatively low levels. Nitrate as a key source
of eutrophication is also highly regulated under the Nitrates Directive which limits
the application in vulnerable areas. In the UK these areas cover 58% of the UK.
The processes for treating nitrogen in wastewater are relatively simple and
common within the wastewater treatment process. Within the wastewater
treatment process ammonia is converted to nitrate in the process of nitrification.
This is a highly energy intensive process as it relies on the addition of significant
quantities of air, so controlling it to at or just below a consented level comes with
significant financial incentives. Of course to control ammonia removal you of course
have to measure it. To go a step further to removal the nitrate by the de-nitrification
process is also a particularly expensive process necessitating the measurement of
nitrate to in some cases.
2NH4
+ 3O2
	 2NO2
+ 2H2
O
2NO2
+ O2
		 2NO3
To denitrify the nitrate is taken to nitrogen gas by reduction from Nitrate to Nitrite to Nitrogen oxide and eventually it is completely reduced to nitrogen gas.
The overall reaction for this is
2NO3
+ 10e-
+12H+
	N2
+6H2
O
So what are we analysing for?
So within the wastewater treatment process what aspects of the nitrogen cycle are we actually analysing for. What instruments do we have to put in the ground
and why? The answer to this is of course what are you actually looking to do and this depends upon what concentrations of what are you regulated to and
what are you hoping to achieve. For this we go back to the consent and see what are the key parameters. The most common consented parameter is ammonia.
At best there won’t be a consented discharge concentration for ammonia. A lot of treatment works are either on the coast where discharge of ammonia isn’t
a problem or a works is too small to warrant an ammonia consent. Basically ammonia isn’t a problem that has to be dealt with. At the next best the
ammonia consent will be relatively high where, although it would be good practice to measure it online, the actual consented concentration is relatively
high the process that has to be used to treat it is relatively low intensity (think a trickling filter) that there is no actual point in measuring for ammonia.
The worst case is where an ammonia consent is relatively tight and this starts to necessitate measuring ammonia online for two reasons. Firstly it becomes
necessary to either or actively monitor and/or actively control the levels of ammonia within the wastewater treatment system to ensure compliance and
secondly the cost. To treat ammonia to low levels by nitrifying it becomes very costly at the lower levels as the nitrification process intensifies.
We will come on how we analyse ammonia in both the laboratory and online later on in the article.
So, what else in the many forms of nitrogen can we analyse for? The next most obvious parameter is nitrate. If you take the nitrification process you can check
its performance by analysing for the end result, i.e. nitrate. It is great indication on the health of the nitrification process to check the levels of nitrate. If they
are relatively high it is safe enough to check that the bacteria within the process are healthy and working. If a plant has a total nitrogen consent then it is also a
good indication as to what concentrations the de-nitrification process is starting and theoretically at least be used as an input concentration to a feed-forward
control process especially considering the end point of the de-nitrification process is a gas and so isn’t actually in the liquid phase. However the regulation on
some plants is for total nitrogen….what is this?
When within a consent it states total nitrogen it is literally the Total Nitrogen, i.e. the sum of the nitrate, nitrite and Kjeldahl Nitrogen (which is organic nitrogen
plus ammonia). However, the Kjeldahl Nitrogen is often ignored as its normally a relatively low level when compared to the other analytes and the testing in
the lab is relatively difficult to do and so often the Total Nitrogen is classed as the sum of ammonia, nitrate & nitrite.
The problem comes as to how do you analyse for total nitrogen online without analysing for ammonia, nitrate, nitrite and potentially organic nitrogen. The
plain answer? You don’t.
Figure 1: Nitrate Vulnerable Zones in the UK
Anything else?
The only other analyte often analysed for within wastewater is nitrous oxide or N2O. Most people’s first thoughts are why are we analysing for laughing gas.
Well it is one of the stages within the nitrification process and can be used as an indicator of the health of an activated sludge system. The theory being that
an activated sludge system that is under undue stress gives off higher concentrations of nitrous oxide. As it is a greenhouse gas and a very potent one it is
obvious as to why it needs to be analysed for and operational strategies put in place to minimise nitrous oxide emissions from the activated sludge process.
To summarise, within wastewater we analyse for:
•	 Ammonia
•	 Nitrate
•	 Nitrous Oxide (less common)
But how is it done, in both the laboratory and online field base environments?
Analysing for Ammonia
The methods for analysing for ammonia within the laboratory environment are relatively simple colourimetric methods that are often used in field test kits
that manually measure ammonia within the field. The concentration level of ammonia that is analysed for is important as there is a difference between the
sensitivity of the field tests whether the ammonia is within a low or a medium range concentration.
The low range test is the sodium salicylate method and this method is often used within potable waters. This colourimetric test produces a yellow colour at
the lower ranges of the test to a green colour at the higher ranges.
The salicylate method is a variation of the Berthelot-Phenate method but does not
require the use and disposal of toxic phenol. The salicylate method involves a three-
step reaction sequence. The first reaction step involves the conversion of ammonia to
monochloroamine by the addition of chlorine. The monochloroamine then reacts with
salicylate to form 5-aminosalicylate. Finally, the 5-aminosalicylate is oxidized in the
presence of sodium nitroferricyanide (a catalyst) to form a blue-green coloured dye that
absorbs light at 650nm. The blue colour is actually masked by the yellow colour of the
excess reagent to give a final green coloured solution (at higher levels).
At higher concentrations, that are more common in wastewater the Nessler test is used. Where this test is less sensitive that the salicylate test it is
used in preference as it is more applicable to wastewater analysis as the concentrations in wastewater are often above the range of the salicylate test
(especially when considering crude sewage). Ammonia reacts with the Nessler reagent (K2HgI4) to form a yellow coloured complex which can be detected
spectrophotometrically at 430 nm and is directly proportional to the ammonia concentration. Stabilizer solution (potassium sodium tartrate) is added to
prevent cloudiness of the Nessler reagent which may occur in some waters due to calcium and magnesium concentrations.
However both of these methods are colourimetrically based and so would require flow cells and visible spectrophotometers to be place within a cabinet to
work and so the online methodology for the analysis of ammonia in wastewater uses a couple of different methods of analysis.
The first method of online analysis is using a liquid immersed ion-selective electrode (ISE). In this
particular method the ion selective electrode is immersed in the wastewater directly. The basic principle
of ISEs is that, on immersing the electrode in a test solution, the selected ions in solution pass through the
ion- selective membrane until an equilibrium is reached between the concentration inside and outside the
membrane. This causes an electrical potential to be developed which is proportional to the concentration of
the ions in the external solution. This is measured in millivolts (mV) as the difference in potential between
the ISE membrane and a stable constant reference voltage produced by a reference electrode which is also
immersed in the same solution.
The method does have interferences like most ion-selective membranes which are not entirely specific for
the designated ion but also allow the passage of some other ions to a greater or lesser extent. This increases
the charge on the membrane above that which is due solely to the detected ion and causes a spuriously high
measurement. This phenomenon is known as Interference and the extent of this interference is expressed
as the Selectivity Coefficient. The selectivity coefficient is the ratio of the apparent concentration calculated
for the interfering ion to that calculated for an equal amount of the detected ion. NB: this is not the same as
the ratio of the mV signals developed by the electrodes in response to these ions, because the voltage is only
directly proportional to the logarithm of the concentration. The selectivity coefficient can be determined
experimentally to give some idea of the order of magnitude but it is not a constant factor since it depends
on several parameters including the concentration of both ions, the presence of other ions in solution, and
the temperature. In the past this phenomenon has limited the use of ion-selective electrodes to only those
applications where the interfering ion is known to be absent or only in a relatively small concentration
compared to the detected ion.
In the case of ammonium analysis, the most significant interference is from the potassium (K+) ion.
Potassium is a very common element and occurs in relatively high concentrations in most natural
waters. The selectivity coefficient for the NH4 electrode for K is about 0.1. This means that if there are equal
concentrations of both elements then the K interference will increase the NH4 measurement by about 10%.
To put it another way, if the K content is ten times more than NH4 then the measured concentration will be
about twice what it should be. A further complication is that the K electrode is also interfered with by the
NH4 ion. However, in this case the selectivity coefficient is only about 0.01 so this has a much smaller effect
Figure 2: The theory of the Salicylate method
Figure 3: An Ammonia ISE in an ASP
Page 16 Page 17
on the analysis. Practically this means that any online Ion Selective Electrode need potassium
correction and also needs to be calibrated relatively frequently for online measurements.
The second method of analysis for ammonia is using a gas-sensing ion-selective electrode
in preference to the immersed electrode. This is much a more sensitive method as only the
ammonia is presented to the electrode by raising the pH of the sample solution. Sodium
Hydroxide (NaOH) is added to the wastewater and as the pH increases the dissolved a
mmonia in water is converted to ammonium. As the pH increases further the ammonium in
solution is converted to a gaseous form.
The gas sensing electrode works in the same way as the ion-selective electrode by
creating an electrical potential that can be measured in millivolts. The design of the ion-
selective electrode and its components are shown in figure 5.
Taking a gas sensing electrode system ammonia system apart the key features can be
analysed. Apart from the gas sensing electrode one of the most important parts of an online
gas sensing electrode monitor is the sampling and sample preparation system.
The sampling of the wastewater is often done in one of two ways. The first way is by using a peristaltic
pumping system which draws the sample into a sample chamber where the chemicals are added and the
ammonia gas formed. The weakness of a peristaltic pumped system is two-fold as the diameter of the
peristaltic pump tubing is subject to blockage and secondly over time the pump tubing will stretch
creating problems with the pumping system. This is overcome by having pump tubing that is a wide enough
diameter to minimise the risk of blockage and the tubing becomes a replaceable part.
The second method of sampling
is using a vacuum pump that
literally sucks the sample to a
sample chamber and wastes
it after the sodium hydroxide
is added. Depending upon the
system this either puts the sample chamber in direct contact with the wastewater (in
some systems) or uses a tubing structure that again has a risk of blockage (although
this tends to be smaller as the tubing is of a wider bore). This sampling structure is very
similar to that used in wastewater samplers.
The last drawback of a gas sensing electrode system is that it does utilise chemicals
that have to be replaced on a fairly regular basis. This usually consists of a sodium
hydroxide solution and ammonia standard solution. The standard solution is used to
calibrate the ammonia monitor on a daily basis. It can also be used to detect low level
ammonia concentrations by using a standard addition methodology depending upon
the mode of operation of the online analyser.
As a result of this the gas sensing online methodology for ammonia is a highly reliable
method of analysis that is able to achieve great accuracy.
Analysing for Nitrate
The analysis of nitrate in wastewater is limited to those treatment works that tend to have a total nitrogen consent and so the application of nitrate sensors is
limited although they do exist. In the laboratory the analysis of nitrate has multiple different methods depending upon the accuracy required. The three main
methods that are used are:
1.	 Cadmium Reduction Method
2.	 Ion Chromatography
3.	 UV detection method
The cadmium reduction method uses Cadmium metal reduces nitrate in the sample to nitrite. The nitrite ion reacts in an acidic medium with sulfanilic acid
to form an intermediate diazonium salt. The salt couples with gentisic acid to form an amber coloured solution which is then measured at 500nm using a
spectrophotometer. The obvious disadvantage of this method is that the sample waste contains waste cadmium which is toxic.
The Ion Chromatography method is one of the most utilised and accurate methods in the laboratory and utilises a chromatographic column which separates
the anions (or cations depending upon the charge of the column) from each other and analyses their concentration against a standard solution and measures
the concentration of the anion (for example nitrate) by using a detector that measures the conductivity of the solution with the concentration being directly
proportional to the conductivity of the separated anion at a point in time.
This is the one of the most accurate methods for the detection of nitrate with the only interference being other anions that are in solution.
The last laboratory technique is not recommended for samples that have a high organic interference, such as wastewater, and uses the absorbance at an
ultraviolet wavelength of 215nm with an organic correction factor at 275nm. In this method nitrate absorbs strongly at 215nm and interfering organics absorb
strongly at 275nm. By measuring at both wavelengths the concentration of nitrate can be found by comparing against a calibration curve and deducting the
Figure 4: Ammonia speciation at different pHs
Figure 5 - Gas sensing electrode design
Figure 6: Gas sensing ammonia monitor in an Activated Sludge Plant
interfering substances that also have an influence at 215nm. In the laboratory this
is used as a good indicator of nitrate concentration but is usually fully quantified by
using the cadmium reduction or ion chromatography methodologies.
Although the UV method is thought of as semi-quantative which is affected by the
concentration of organics it is utilised as a fully quantitative method online in the
wastewater industry with obvious disadvantages over the accuracy of the method.
A typical UV analyser in the water industry utilises a broad-spectrum, high
intensity xenon strobe lamp, housed in the emitter module which generates
pulses of light that pass through the sample water in the flow-cell to a filtering and
detection system, contained in the receiver module. The received light pulses are
analysed at two wavelengths; the measurement wavelength of 215nm and the
reference wavelength of 275nm (at which the sample constituents of interest do not
absorb). This dual light path system provides information that enables the measured
value to be corrected for any turbidity due to suspended matter in the sample. The
monitor is calibrated with a pure solution of a known nitrate content.
Using the pulsed UV light eliminates some of the uncertainties associated with the
laboratory method which normally uses a tungsten lamp array and the fact that the organic interference in wastewater should be stable allows for any
interferences to be compensated for.
The second method of online nitrate analysis is to use an ion-selective electrode
method in a similar methodology to that of the ammonia ion-selective electrode. The
ion selective electrode method is not completely selective for nitrate with major
interferences from chloride and bicarbonate ions when their weight ratios to
nitrate-N are > 10 or > 5 respectively. There are also interferences where the pH is
changeable.
To overcome these interferences monitoring of any sample by ion-selective
electrodes usually requires certain conditioning to be performed on the sample to
allow accurate, trouble-free measurement. Such conditioning involves regulating
flow, controlling temperature and adjusting chemical composition prior to
presentation of the sample to the point of measurement. A typical monitor carries
out these adjustments for each parameter in simple and easily understood steps.
The sample is presented from the user’s pipework to a constant head unit and any
excess is allowed to overflow. This allows sample, under controlled pressure
conditions, to be presented to a multi-channel peristaltic pump which proportions
sample and reagent solutions through the monitor to the mixing point. The resulting
combined solution is then temperature controlled to remove the effects of sample
and ambient temperature variations. The conditioned solution is then delivered to
the flow-cell, under constantly flowing conditions, where the ion measurement takes
place. This measurement is carried out using an ion-selective sensing electrode.
The sensor generates a millivolt output which is proportional to the ion concentration. This output is processed by the microprocessor-based electronics
section to calculate the actual sample concentration. To maintain optimum measurement accuracy it is necessary to introduce standard solutions of known
concentration for calibration purposes.
Analysing for Nitrous Oxide
The measurement of nitrous oxide has become popular in the last few years when it was realised that activated sludge plants were a source of the greenhouse
gas. A vast amount of research has been done in nitrous oxide emissions from the secondary process and mostly this has involved some sort of gas collection
system and then using traditional laboratory techniques involving gas chromatography. This is impractical to measure on the plant level although it must be
noted that a similar sort of technology has been employed on a plant level for metaldehyde in potable water. However the benefits of doing this for nitrous
oxide simply do not exist.
The benefits of measuring nitrous oxide are thought to be based around indications of Activated Sludge Plant health with a plant that is starting to decay
in performance emitting more Nitrous Oxide that a plant that is operating in a stable fashion. The cause of plant stress normally being dissolved oxygen or
potentially sludge age related.
In the online environment there are few sensors available, but they do exist and are commercially available. They are basically a miniaturized Clark-type sensor
with an internal reference and a guard cathode. The sensor is equipped with an oxygen front guard, which prevents oxygen from interfering with the nitrous
oxide measurements. The sensor is connected to a high-sensitivity picoammeter and the cathode is polarized against the internal reference. Driven by the
external partial pressure, nitrous oxide from the environment will penetrate through the sensor tip membrane and be reduced at the metal cathode surface.
The picoammeter converts the resulting reduction current to a signal . The internal guard cathode is also polarized and scavenges oxygen in the electrolyte,
thus minimizing zero-current and polarization time.
Nitric Oxide (NO) and high concentrations of sulphide are known to interfere with the measurement of Nitrous Oxide.
Figure 7: Typical ion chromatograph for nitrate
Figure 8: Typical Ion selective electrode setup for analysing nitrate
Page 18 Page 19
WIPAC Monthly - December 2017

Más contenido relacionado

Más de Water Industry Process Automation & Control

Más de Water Industry Process Automation & Control (20)

WIPAC Monthly - June 2023.pdf
WIPAC Monthly - June 2023.pdfWIPAC Monthly - June 2023.pdf
WIPAC Monthly - June 2023.pdf
 
WIPAC Monthly - May 2023.pdf
WIPAC Monthly - May 2023.pdfWIPAC Monthly - May 2023.pdf
WIPAC Monthly - May 2023.pdf
 
WIPAC Monthly - April 2023.pdf
WIPAC Monthly - April 2023.pdfWIPAC Monthly - April 2023.pdf
WIPAC Monthly - April 2023.pdf
 
WIPAC Monthly - March 2023.pdf
WIPAC Monthly - March 2023.pdfWIPAC Monthly - March 2023.pdf
WIPAC Monthly - March 2023.pdf
 
WIPAC Monthly - February 2023.pdf
WIPAC Monthly - February 2023.pdfWIPAC Monthly - February 2023.pdf
WIPAC Monthly - February 2023.pdf
 
WIPAC Monthly - January 2023.pdf
WIPAC Monthly - January 2023.pdfWIPAC Monthly - January 2023.pdf
WIPAC Monthly - January 2023.pdf
 
WIPAC Monthly - December 2022.pdf
WIPAC Monthly - December 2022.pdfWIPAC Monthly - December 2022.pdf
WIPAC Monthly - December 2022.pdf
 
WIPAC Monthly - October 2022.pdf
WIPAC Monthly - October 2022.pdfWIPAC Monthly - October 2022.pdf
WIPAC Monthly - October 2022.pdf
 
WIPAC Monthly - September 2022.pdf
WIPAC Monthly - September 2022.pdfWIPAC Monthly - September 2022.pdf
WIPAC Monthly - September 2022.pdf
 
WIPAC Monthly - August 2022.pdf
WIPAC Monthly - August 2022.pdfWIPAC Monthly - August 2022.pdf
WIPAC Monthly - August 2022.pdf
 
WIPAC Monthly - July 2022.pdf
WIPAC Monthly - July 2022.pdfWIPAC Monthly - July 2022.pdf
WIPAC Monthly - July 2022.pdf
 
WIPAC Monthly - June 2022.pdf
WIPAC Monthly - June 2022.pdfWIPAC Monthly - June 2022.pdf
WIPAC Monthly - June 2022.pdf
 
WIPAC Monthly - May 2022
WIPAC Monthly - May 2022WIPAC Monthly - May 2022
WIPAC Monthly - May 2022
 
WIPAC Monthly - April 2022.pdf
WIPAC Monthly - April 2022.pdfWIPAC Monthly - April 2022.pdf
WIPAC Monthly - April 2022.pdf
 
WIPAC Monthly - March 2022
WIPAC Monthly - March 2022WIPAC Monthly - March 2022
WIPAC Monthly - March 2022
 
WIPAC Monthly - February 2022
WIPAC Monthly - February 2022WIPAC Monthly - February 2022
WIPAC Monthly - February 2022
 
WIPAC Monthly - January 2022
WIPAC Monthly - January 2022WIPAC Monthly - January 2022
WIPAC Monthly - January 2022
 
WIPAC Monthly - December 2021
WIPAC Monthly - December 2021WIPAC Monthly - December 2021
WIPAC Monthly - December 2021
 
WIPAC Monthly - October 2021
WIPAC Monthly - October 2021WIPAC Monthly - October 2021
WIPAC Monthly - October 2021
 
WIPAC Monthly August 2021
WIPAC Monthly August 2021WIPAC Monthly August 2021
WIPAC Monthly August 2021
 

Último

Kuwait City MTP kit ((+919101817206)) Buy Abortion Pills Kuwait
Kuwait City MTP kit ((+919101817206)) Buy Abortion Pills KuwaitKuwait City MTP kit ((+919101817206)) Buy Abortion Pills Kuwait
Kuwait City MTP kit ((+919101817206)) Buy Abortion Pills Kuwait
jaanualu31
 
Cara Menggugurkan Sperma Yang Masuk Rahim Biyar Tidak Hamil
Cara Menggugurkan Sperma Yang Masuk Rahim Biyar Tidak HamilCara Menggugurkan Sperma Yang Masuk Rahim Biyar Tidak Hamil
Cara Menggugurkan Sperma Yang Masuk Rahim Biyar Tidak Hamil
Cara Menggugurkan Kandungan 087776558899
 
scipt v1.pptxcxxxxxxxxxxxxxxxxxxxxxxxxxxxxxxxxxxxxxxxxxxxxxxxxxxxxxxxxxxxxxxx...
scipt v1.pptxcxxxxxxxxxxxxxxxxxxxxxxxxxxxxxxxxxxxxxxxxxxxxxxxxxxxxxxxxxxxxxxx...scipt v1.pptxcxxxxxxxxxxxxxxxxxxxxxxxxxxxxxxxxxxxxxxxxxxxxxxxxxxxxxxxxxxxxxxx...
scipt v1.pptxcxxxxxxxxxxxxxxxxxxxxxxxxxxxxxxxxxxxxxxxxxxxxxxxxxxxxxxxxxxxxxxx...
HenryBriggs2
 
Standard vs Custom Battery Packs - Decoding the Power Play
Standard vs Custom Battery Packs - Decoding the Power PlayStandard vs Custom Battery Packs - Decoding the Power Play
Standard vs Custom Battery Packs - Decoding the Power Play
Epec Engineered Technologies
 
"Lesotho Leaps Forward: A Chronicle of Transformative Developments"
"Lesotho Leaps Forward: A Chronicle of Transformative Developments""Lesotho Leaps Forward: A Chronicle of Transformative Developments"
"Lesotho Leaps Forward: A Chronicle of Transformative Developments"
mphochane1998
 
DeepFakes presentation : brief idea of DeepFakes
DeepFakes presentation : brief idea of DeepFakesDeepFakes presentation : brief idea of DeepFakes
DeepFakes presentation : brief idea of DeepFakes
MayuraD1
 

Último (20)

Kuwait City MTP kit ((+919101817206)) Buy Abortion Pills Kuwait
Kuwait City MTP kit ((+919101817206)) Buy Abortion Pills KuwaitKuwait City MTP kit ((+919101817206)) Buy Abortion Pills Kuwait
Kuwait City MTP kit ((+919101817206)) Buy Abortion Pills Kuwait
 
Online electricity billing project report..pdf
Online electricity billing project report..pdfOnline electricity billing project report..pdf
Online electricity billing project report..pdf
 
Hostel management system project report..pdf
Hostel management system project report..pdfHostel management system project report..pdf
Hostel management system project report..pdf
 
Cara Menggugurkan Sperma Yang Masuk Rahim Biyar Tidak Hamil
Cara Menggugurkan Sperma Yang Masuk Rahim Biyar Tidak HamilCara Menggugurkan Sperma Yang Masuk Rahim Biyar Tidak Hamil
Cara Menggugurkan Sperma Yang Masuk Rahim Biyar Tidak Hamil
 
kiln thermal load.pptx kiln tgermal load
kiln thermal load.pptx kiln tgermal loadkiln thermal load.pptx kiln tgermal load
kiln thermal load.pptx kiln tgermal load
 
DC MACHINE-Motoring and generation, Armature circuit equation
DC MACHINE-Motoring and generation, Armature circuit equationDC MACHINE-Motoring and generation, Armature circuit equation
DC MACHINE-Motoring and generation, Armature circuit equation
 
A CASE STUDY ON CERAMIC INDUSTRY OF BANGLADESH.pptx
A CASE STUDY ON CERAMIC INDUSTRY OF BANGLADESH.pptxA CASE STUDY ON CERAMIC INDUSTRY OF BANGLADESH.pptx
A CASE STUDY ON CERAMIC INDUSTRY OF BANGLADESH.pptx
 
scipt v1.pptxcxxxxxxxxxxxxxxxxxxxxxxxxxxxxxxxxxxxxxxxxxxxxxxxxxxxxxxxxxxxxxxx...
scipt v1.pptxcxxxxxxxxxxxxxxxxxxxxxxxxxxxxxxxxxxxxxxxxxxxxxxxxxxxxxxxxxxxxxxx...scipt v1.pptxcxxxxxxxxxxxxxxxxxxxxxxxxxxxxxxxxxxxxxxxxxxxxxxxxxxxxxxxxxxxxxxx...
scipt v1.pptxcxxxxxxxxxxxxxxxxxxxxxxxxxxxxxxxxxxxxxxxxxxxxxxxxxxxxxxxxxxxxxxx...
 
Standard vs Custom Battery Packs - Decoding the Power Play
Standard vs Custom Battery Packs - Decoding the Power PlayStandard vs Custom Battery Packs - Decoding the Power Play
Standard vs Custom Battery Packs - Decoding the Power Play
 
Double Revolving field theory-how the rotor develops torque
Double Revolving field theory-how the rotor develops torqueDouble Revolving field theory-how the rotor develops torque
Double Revolving field theory-how the rotor develops torque
 
FEA Based Level 3 Assessment of Deformed Tanks with Fluid Induced Loads
FEA Based Level 3 Assessment of Deformed Tanks with Fluid Induced LoadsFEA Based Level 3 Assessment of Deformed Tanks with Fluid Induced Loads
FEA Based Level 3 Assessment of Deformed Tanks with Fluid Induced Loads
 
Rums floating Omkareshwar FSPV IM_16112021.pdf
Rums floating Omkareshwar FSPV IM_16112021.pdfRums floating Omkareshwar FSPV IM_16112021.pdf
Rums floating Omkareshwar FSPV IM_16112021.pdf
 
2016EF22_0 solar project report rooftop projects
2016EF22_0 solar project report rooftop projects2016EF22_0 solar project report rooftop projects
2016EF22_0 solar project report rooftop projects
 
"Lesotho Leaps Forward: A Chronicle of Transformative Developments"
"Lesotho Leaps Forward: A Chronicle of Transformative Developments""Lesotho Leaps Forward: A Chronicle of Transformative Developments"
"Lesotho Leaps Forward: A Chronicle of Transformative Developments"
 
DeepFakes presentation : brief idea of DeepFakes
DeepFakes presentation : brief idea of DeepFakesDeepFakes presentation : brief idea of DeepFakes
DeepFakes presentation : brief idea of DeepFakes
 
Navigating Complexity: The Role of Trusted Partners and VIAS3D in Dassault Sy...
Navigating Complexity: The Role of Trusted Partners and VIAS3D in Dassault Sy...Navigating Complexity: The Role of Trusted Partners and VIAS3D in Dassault Sy...
Navigating Complexity: The Role of Trusted Partners and VIAS3D in Dassault Sy...
 
AIRCANVAS[1].pdf mini project for btech students
AIRCANVAS[1].pdf mini project for btech studentsAIRCANVAS[1].pdf mini project for btech students
AIRCANVAS[1].pdf mini project for btech students
 
Engineering Drawing focus on projection of planes
Engineering Drawing focus on projection of planesEngineering Drawing focus on projection of planes
Engineering Drawing focus on projection of planes
 
Bridge Jacking Design Sample Calculation.pptx
Bridge Jacking Design Sample Calculation.pptxBridge Jacking Design Sample Calculation.pptx
Bridge Jacking Design Sample Calculation.pptx
 
HAND TOOLS USED AT ELECTRONICS WORK PRESENTED BY KOUSTAV SARKAR
HAND TOOLS USED AT ELECTRONICS WORK PRESENTED BY KOUSTAV SARKARHAND TOOLS USED AT ELECTRONICS WORK PRESENTED BY KOUSTAV SARKAR
HAND TOOLS USED AT ELECTRONICS WORK PRESENTED BY KOUSTAV SARKAR
 

WIPAC Monthly - December 2017

  • 1. Page 1 WIPAC MONTHLYThe Monthly Update from Water Industry Process Automation & Control www.wipac.org.uk Issue 12/2017 - December 2017
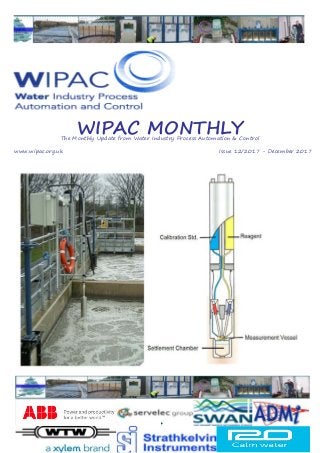
  • 2. Page 2 Page 3 From the Editor The one thing that I am asked all of the time is “When are we going to see a Smart Water Industry?” For once I think that I can conclude that we have started to see the rumblings of one outside of the potable water network actually start to happen in 2017. In previous years it has been very much provided as a product from some of the key suppliers in the industry and it is only in a few places that it has been led by the Water Companies themselves in a situation that is in-house. The most notable of these was EPAL in Portugal with their WONE system and this was championed by Andrew Donnely. What we have in the potable water industry is certainly the ability and the products available to deliver a Smart (Potable) Water Network but there is so much more that can be done. As somebody who mainly works on the Wastewater side of things I frequently ask “Where is our Smart Wastewater System?” The main question to ask is what is stopping the development of the wider “Smart Water Industry” and what is also stopping it in the wastewater side of the business in particular. It is the products and “widgets” that are available. The answer is most certainly not. There are some fantastic innovations that have happened at the ground level as well as the more systematic level. On a day to day basis in my day job I am well known for getting my phone out and plugging it into an instrument either via cable or via Bluetooth and if I absolutely have to get a PC out to wander around the inside of an instrument to find out what is going on then I do. At that level the tools are all there. Is it a matter of skill and knowledge? My answer to this question is perhaps but then again perhaps not. Again the tools are available for those who actually want to go out there and get them. Look on your App Store of choice and there are all the manuals in the world for you to look at as most suppliers have put that knowledge at your fingertips. So on the ground level it certainly isn’t the lack of tools to do the job. Perhaps its a case of not knowing how to use the tools. It is probably the Water Industries worst kept secret that those with technical experience are mostly going to retire in the next 10 years and despite the protestations of some that say “things will be fine,” and the skills gap “doesn’t matter” things are going to get difficult. This is a major problem and the message to the industry has to be “protect your technical people as you will need them,” as if you don’t they will leave and then things will get more expensive as mistakes will be made and half solutions will be installed that might work but will cost a lot more to run. In short you can’t run an industry on people managers alone which in some areas seems to be a problem at the moment. Another problem is of course the half solutions that are installed as when you end up doing a cost benefit analysis of a “Smart Solution” then half of the benefits have already been delivered and those with holistic solutions should be screaming from the hills that there is so much more to do if you’d just take a chance. This is what happens when those who don’t necessarily know what they are doing deliver something that is half right but of course doesn’t have the grace of a solution delivered buy a technical expert. So what’s changed? Why has the industry woken up to the possibilities that can be delivered? Perhaps it is the work that has been done by the various forums out there as the Smart Water Network was championed by the SWAN Forum amongst others who have brought people together to say “there is something here that can be delivered and actually bring some pretty large benefits.” It’s relatively simple on the potable water network as leakage is something very tangible that is politically sensitive and the need for greater water resilience is particularly being highlighted. On the wastewater side of things perhaps its been a technology development as processes such as the Nereda process that is being built all over the UK relies on technology and more importantly instrumentation to work. Perhaps the driver this year has been the record fines handed out in the UK several times and it is this that caught peoples eyes as the realise that if there is a more efficient way to operate that will improve things in the industry then perhaps its worth giving it a go. Perhaps it is the every increasing costs of the industry with an ever dwindling amount of money to do Business as Usual plus all of the additional pressures that the industry faces and perhaps its a combination of all of this. What is clear is that the industry is starting to change towards being “Smart,” it is starting to take its digital journey towards Industry 4.0 although quite what it looks like is something completely unknown and this is where the skills and knowledge comes in. The Technical Expertise is needed and those that have been looked down upon for wanting to be a technical expert rather than a “people manager” need to be listened to. The future of the industry is going to need its technical experts to guide the companies towards a future where we have the right things in place and not half solutions that will patch a problem. The future is where we use our data correctly to inform a decision making process that gives us the ability to do what is best Have a Happy New Year and a good month Oliver In this Issue From the Editor.................................................................................................. 3 Industry News..................................................................................................... 4-11 Highlights of the news of the month from the global water industry centred around the successes of a few of the companies in the global market. 2017 - A Year in Review for the Smart Water Industry......................................... 12-13 It is always good to look back at what has happened in the past year and how the industry has developed. In this review article WIPAC Group Manager, Oliver Grievson, looks back at some of the key developments in the “Smart Water Industry in 2017. SmartNetworksOrganisationDesign................................................................... 14-15 When you think about one of the leading companies in the Smart Water Industry you think about i20. In this thought piece which is part of their Smart Water Networks play-book they have brought together in 2017 they talk about how people and organisational structure is a key to the Smart Water Industry. Focus On: Analysing the Nitrogen Cycle............................................................... 16-20 The Nitrogen Cycle is one of the key cycles within the wastewater industry. Ammonia is regulated parameter and much of the UK and Europe is sensitive to nitrate pollution from agricultural as well as wastewater issues. In this, the most recent of “Focus On” articles we go back to basics on how we measure the key parts of the nitrogen cycle in wastewater. Workshops,Conferences&Seminars.................................................................... 21-22 The highlights of the conferences and workshops in the coming months . WIPAC Monthly is a publication of the Water Industry Process Automation & Control Group. It is produced by the group manager and WIPAC Monthly Editor, Oliver Grievson. This is a free publication for the benefit of the Water Industry and please feel free to distribute to any who you may feel benefit. All enquires about WIPAC Monthly, including those who want to publish news or articles within these pages, should be direct- ed to the publications editor, Oliver Grievson at olivergrievson@hotmail.com The picture on the front page is an ammonia monitor in an activated sludge plant and is an Envitech PBS1. The importance of measuring ammonia is outlined in this month’s Focus on Article about measuring the Nitrogen Cycle
  • 3. Yorkshire Water trials satellite technology to detect leaks WWEM & WIPAC to collaborate for WWEM 2018 The Water, Wastewater & Environmental Monitoring Conference and WIPAC are to continue their collaboration at the WWEM Conference & Exhibition due to take place in November next year. Planning is already well under way for the return of the Instrumentation Apprentice Competition which was started in 2014 by the WIPAC Group and is set to return next year. In a development to the competition it is set to increase in size by allowing Apprentices from outside of the Water Companies. Teams are already set to join the competition from at least two companies outside of the Water & Sewage Companies who have traditionally sent their Apprentices to compete. The WIPAC Flow Forum will also return to the next WWEM which was sponsored in 2016 by RS Hydro. The full programme is yet to be set and this announcement is in essence a call for papers but subjects that are definitely going to be covered include the maintenance & calibration of flow instrumentation and the cleaning of electro-magnetic flow meters. In a new development for WWEM & WIPAC there is also going to be a WIPAC Learning Zone which will join Instrumentation Supply Companies and Apprentices, Technicians & Engineers together in a series of Master-classes throughout the two days of the conference & exhibition. Calls for interest will be released in the New Year. 13th - 14th March 2018 Circular Solutions for Water & Energy for the 4th Industrial Revolution Manual of Wasetewater Flow Measurement gets the go ahead For awhile discussions have been ongoing for the WIPAC group to produce a Manual of Wastewater Flow Measurement. It can now be revealed that this has been to the publishing arm of the International Water Association (IWAP) and the outline book structure has been approved for publishing. The book is set to be submitted to the IWA in May 2019 and in addition to covering a vast array of the different types of flow monitoring present in the Water Industry covering how we measure flow in the wastewater industry it will also cover the what, the when and the why. The manual of wastewater flow measurement is set to be a truly collaborative publication and those interested in helping to collaborate should get in touch with the Lead Editor of the manual, Oliver Grievson. Detergent-based artificial tongue identifies bottled water brands A new, easy-to-make artificial tongue can distinguish different brands of bottled water (ACS Sensors 2017, DOI: 10.1021/acssensors.7b00634). The simple chemical sensor uses a single type of fluorescent molecule to detect and quantify 13 different metal ions. Fluorescent sensors are excellent for detecting minute, nanomolar levels of target chemicals in solution in real time. In these applications, molecules typically include two parts—a receptor portion that binds to the analyte connected to a fluorescent dye. When the receptor binds to its target, it triggers a change in the dye’s light emission colour, intensity, or duration that can be used to quantify the target molecule’s concentration. For these types of sensing applications, researchers have typically used arrays of different sensor molecules, each in separate wells in a dish, to measure the levels of multiple kinds of molecules in a sample. Using such sensor arrays, researchers have made artificial tongues that can identify different soft drinks, whiskeys, and wines. They could also allow authorities to monitor water quality and permit consumers to test grocery store produce for heavy-metal contamination. But the arrays are tedious to make and require large amounts of test samples, says Liping Ding, a professor of chemistry at Shaanxi Normal University in Xi’an. So Ding and her colleagues have been looking at ways to simplify the chemical sensors. Their new sensor uses a single sensing molecule that can fluoresce at four different wavelengths, depending on the wavelength of light applied to the sample. As different metal ions bind, they change the fluorescence pattern in measurable ways, producing an output that allows researchers to distinguish them in solution. The fluorescent part of the sensor is a pyrene-based dye that the researchers attach to an amine-based functional group that binds metal ions. When added to water along with the common detergent, sodium dodecyl sulfate, the detergent molecules aggregate to create tiny spheres with negatively charged, water- loving surfaces and water-repelling cores. The aggregates incorporate the sensor molecules: The hydrophobic pyrene portion of the molecule becomes trapped within the spheres while the hydrophilic, metal-binding end points outward into solution. When metal ions are added to the solution, they bind to the metal receptors and interact with the anionic detergent molecules, changing the size and shape of the aggregates. This structural change in turn increases or decreases the intensity of fluorescence at each of the four wavelengths. Combining the changes at different wavelengths generates a recognition pattern for a particular metal ion, says Ding. The pattern of changes varies for each metal. The researchers were able to record unique recognition patterns that serve as fingerprints for 13 different metal ions: Cu2+ , Co2+ , Ni2+ , Cr3+, Hg2+ , Fe3+ , Zn2+, Cd2+ , Al3+ , Pb2+, Ca2+ , Mg2+ , and Ba2+ . By applying a pattern recognition algorithm to the combined fluorescent signals, they could discern multiple metal ions in a mix- ture. Brands of bottled mineral waters have their own signature combination and amounts of metal ions, making them an ideal test of the new sensor. When the researchers tested such samples with their sensor, they could tell tap water from mineral water and distinguish among eight different mineral water brands. The sensor could eventually be used to monitor the quality of drinking water or to detect counterfeit bottled water, Ding says. “This is one probe for all, like ‘One ring rules them all,’” says Pavel Anzenbacher, a professor of chemistry at Bowling Green State University. “This would save a lot of work on synthesis.” Yorkshire Water has become the latest water utility to announce it is using satellite technology to help identify underground water leaks from its pipe network. The company has partnered with Israeli company Utilis, a world leader in satellite water leakage detection and which is represented in UK by Suez Advanced Solutions, to test out the technology on its pipes in Halifax and also Keighley. The trial in Yorkshire helped identify 44 underground pipe leaks in both towns that were then quickly fixed by Yorkshire Water’s response team. It was calculated by the firm that this helped save 330,000 litres of water a day escaping from its network. Eddy Segal, Utilis vice-president of sales, said: “We use a Japanese satellite that carries a microwave RADAR, capable of penetrating into the ground to the level of the water pipes. For the trial with Yorkshire Water we specifically analysed the area of Halifax and Keighley for leakage. We are pleased to work with Yorkshire Water who are one of the leading companies when it comes to the important issue of leakage reduction.” Jason Griffin, Yorkshire Water’s leakage team leader in West Yorkshire, said: “Most leaks from our pipes do not come to the surface and so are hard to identify. However, this satellite was able to detect underground water leaks from our pipes within a 100m radius, which makes it much easier for our leakage inspectors to then pinpoint and repair. On the back of this, 44 leaks were repaired, and this helped stop a significant volume of water escaping into the ground.” Yorkshire Water is also testing the use of other cutting-edge technology as part of a new strategy to predict and prevent water leaks. This includes drones that have been used to conduct an aerial topographical survey of 30km of pipework stretching from York to Sheffield. More than 15,000 acoustic ears are also being installed into the company’s pipe network that are capable of listening to the noise water makes and help data scientists identify unusual sound patterns that are often a sign of leaks. Yorkshire Water has committed to hire 50 new leakage Inspectors as part of a multimillion-pound drive to improve the service it offers to customers. Last month, Severn Trent Water said it had embarked on a trial to detect leaks from space to help achieve its target of reducing leakage levels by 15%. The company is working with Rezatec, which analyses different types of satellite data and imagery to monitor changes in the landscape near to the pipe, as well as Utilis. Page 4 Page 5 Industry News
  • 4. Sonde monitor helps EA convict river pollution culprit Pouring waste into sewers rather than taking it to an approved site for disposal has cost luxury coach firm Symphony Chauffeurs and its sole director more than £21,000 in fines. The company, based near Heathrow Airport, broke environmental law when staff emptied toilets from the coaches into public drains and contaminated the River Crane. Officers from the Environment Agency (EA) turned detective in 2015, tracing pollution in the River Crane to where Symphony operated, a trading estate in Hounslow minutes from the airport. A sonde monitoring device found the river had been polluted, and other sondes identified Symphony as the source, which officers confirmed through a network of drains. The watercourse was further polluted when chemicals and dirty water entered the drains after staff washed vehicles on Symphony’s premises. The firm had been warned by the EA and the company’s landlords doing so was against the lease. Symphony would have stayed within the law by disposing of the chemicals at an approved site, or by cleaning cars and coaches at an authorised location. Symphony Chauffeurs was fined £18,000 by Ealing Magistrates’ Court and ordered to pay £12,113.62 in costs, and a victim surcharge of £170. The company was charged with allowing poisonous, noxious or polluting matter into the River Crane, between May 2015 and February 2016, and failing to provide the EA with documents relating to its activities. The company’s sole director, Allen Jeyakumar, of Greenford, was fined £3,134 by the court for allowing Symphony to commit the offences. Jeyakumar also had to pay a victim surcharge of £142. Mathew Reed, who led the EA investigation, said: “Incidents like this have the potential to have a serious and long-term impact on the health of the river. Symphony Chauffeurs Ltd was given repeated warnings about its activities. People might think we will find it too difficult to trace the cause of pollution, but this case proves that some detective work leads to a conviction. “Identifying pollution through a complex network of drains can be difficult, but that doesn’t mean it cannot be done. We have the skills and technology to do it.” Both Symphony Chauffeurs and Allen Jeyakumar pleaded guilty to all charges at an earlier hearing. Sewer Sense: Smart Decisions About Sanitary Sewer System Is Paying Off For Utility And Customers Using a technology called SmartCover Systems, the Prince William County Service Authority is able to remotely monitor wastewater flows in strategic areas across Prince William County. A SmartCover is comprised of a small device that electronically monitors the level of flow in sewer mains from the underside of a manhole cover. When flow levels reach a certain point, the sensors automatically trigger an alarm that alerts appropriate Service Authority staff to respond. This technology also displays a graph of the sewage flow level in a sewer main that can be viewed remotely on a laptop in near real-time. Before purchasing these devices, the Service Authority would have to manually check the flows through manholes on an as-needed basis. This meant when large rain events were forecasted, a crew could be stationed all night next to manholes to ensure that a sanitary sewer overflow did not occur due to possible infiltration and inflow of groundwater and rainwater into the system. “This device helps save Service Authority employees from spending overtime or even regular time on this issue, freeing them up to do other important work,” Infiltration and Inflow Manager Rob Wilson said. “The utility evaluated the cost, and the reduction in man-hours and improved level of service more than offset the costs of the device,” added Operations & Maintenance Director Don Pannell. The Service Authority initially installed SmartCovers in 2013 in an older area of Manassas where sump pumps and interior drains would deliver thousands of gallons of rainwater into the sewer system. Since the installation of the SmartCovers in that neighbourhood, the Service Authority has detected and prevented two potential costly and messy sewer backups. “It gives us an early warning system in known overflow areas,” said Wilson. “In both of those cases, it tripped the alarm, so our Collection & Distribution crews were able to flush the lines. That prevented any inconvenience to our customers as well as insurance issues where we might have had to pay to have a few houses cleaned due to overflows.” The Service Authority has 10 devices in operation and is interested in adding an eleventh. Since the sensors are small and easy to install, the Service Authority has been able to move the devices around to better monitor areas where backups and sanitary sewer overflows could cause environmental issues and expen- sive hassles for some of the utility’s nearly 350,000 customers. This November, the Service Authority installed sensors in an industrial area near the Potomac River in eastern Prince William County as well as a heavily used commercial area of Manassas located near a large retaining pond. The device was installed in Manassas due to concerns about how a large planned mixed-use development upstream might impact that particular manhole. While the area has not been flood-prone in the past and this fall has been dry in Northern Virginia, the current flow through that part of the sewer-shed is already nearing full capacity. “After a couple of rain events, we will be able to take a snapshot with SmartCover to see what is going on at this particular manhole location before any new development occurs,” said Wilson. Big data intelligence to drive forward customer service Yorkshire Water is embarking on a data-led “internet of things” approach that will enable it to obtain real-time information and understand trends about its water and sewerage operations. Intelligence on the condition of the firms water pipes will enable the company to adopt a predict and prevent approach to maintenance of its 31,000km of water mains. To help predict where and when things are going to happen on its network, 15,000 ‘acoustic ear’ devices will be installed into the pipes capable of listening to the noise flowing water makes. Data generated by this technology will then be analysed by a new team of data scientists, based at the company’s Bradford based control room. It is expected by the firm that this data rich intelligence will make early interventions possible to ensure customers’ water supplies are disrupted as little as possible. Steve Mallinson, Networks & Grid Optimiser at Yorkshire Water said: “We’ve created a bespoke system that allows us to really understand the water patterns in our pipes throughout Yorkshire. It will give us a vast amount of intelligent data that can be analysed to help control the flow of water and prevent bursts and leaks happening. It will also help us to try and repair any issues within just three hours, rather than the current average of three days.” Yorkshire Water will also be installing 8,000 similar devices into its sewers to better understand how its waste water network operates, with triggers and alarms fitted to help protect the environment and customers from sewer flooding. In what is believed to be a first in the water industry, Yorkshire Water is considering adopting an “open data” approach, allowing the growing Yorkshire based community of independent data scientists secure access to its data streams. This will enable the company to work closely with the growing Yorkshire community of digital developers to help find new and innovative solutions to pollution and leakage problems. The work forms part of a wider multi-million pound package announced this month by Yorkshire Water that will create 300 new jobs to help the firm become a top performer in the water sector. EPALaunchesSecondPhaseOfTechnologyChallengeForAnAdvanced Septic System Nitrogen Sensor Recently, the U.S. EPA and its partners announced the second phase of a technology challenge for an advanced septic system nitrogen sensor. The goal of this challenge is to inspire innovators to develop a sensor to monitor nitrogen discharged from advanced septic systems. In Phase II, sensor developers will apply to have their sensor prototype screened and field tested. The Challenge opens on December 18 with an informational webinar, and submissions are due by the end of January 2018. Preliminary screening will take place at the Massachusetts Alternative Septic System Test Centre (MASSTC) EXIT in March 2018. Sensors that meet or exceed the performance goals will then undergo six months of field testing at MASSTC. EPA will award International Organization for Standardizations (ISO) EXIT Environmental Technology Verification (ETV) 14034 reports for up to three sensors. In Phase I of the Advanced Septic System Nitrogen Sensor Challenge, launched in January 2017, EPA partnered with The Nature Conservancy, USGS, and others to challenge entrants to design a nitrogen sensor for use in advanced on-site wastewater treatment systems, also known as advanced septic systems, to moni- tor their long-term performance. Conventional septic systems are not designed to remove nitrogen, which can lead to problems like nitrogen loading to waterways. This issue is especially impor- tant to coastal communities, where excess nitrogen causes toxic algal blooms leading to beach closures and degrades water resources. EPA estimates that over 2.6 million existing systems could be good candidates for advanced septic systems that treat the nitrogen due to their location in nitrogen-sensitive watersheds. Adding nitrogen sensors to these advanced septic systems will help manufacturers, homeowners, and local and state governments ensure that these systems are performing as intended and protecting valuable coastal resources. For more information about the Challenge, visit: https://www.epa.gov/innovation/advanced-septic-system-nitrogen-sensor-challenge-phase-ii-prototype-test- ing Page 6 Page 7
  • 5. Data science - putting it all togetherDigital Water: How One Community Saved More Than $20 Million By Finding Leaks With Data Tennessee’s White House Utility District saw employee productivity go up, expenses go down, and a major capital expansion go away. White House Utility District (WHUD), Tennessee’s largest geographic water utility serving approximately 90,000 consumers and businesses, is using data to stem water loss and create savings for its customers. Detailed in a newly published paper, the District’s work began in 2015 with a dilemma: how to meet growing demand for water within the budget and capital constraints faced by municipal and mid-sized utilities everywhere? Early projections indicated that WHUD might need to invest up to $15 million to $20 million in transmission upgrades and treatment plant expansions to meet its service commitments. Expanded capacity would also mean higher expenses in terms of energy — approximately 30 percent of the cost of producing water — employees, chemicals, and maintenance. Rather than launch an expensive construction project, WHUD opted for another route — partnering with OSIsoft, Matchpoint, ESRI, and Hydreka to develop a system to pinpoint underground leaks through software and smart meters. The results: • WHUD had an infrastructure leakage index (ILI) of 2.86 in 2012, which meant it was losing approximately 32 percent of its water through water main leaks. • In less than four days, WHUD discovered a local stream was a water main leak spilling approximately 147 million gallons a year, or enough for 2,239 homes. • In two years, WHUD recovered $900,000 worth of water and has been able to drive its ILI down to 1.49, with a goal to continue reducing water loss in the years to come. • The ‘smart meter’ approach also allowed WHUD to avoid $200,000 worth of SCADA upgrades and recover $30,000 in employee time and productivity. • The time needed to prepare reports on potential problems dropped from six hours to 10 minutes. • Perhaps most importantly, WHUD avoided the multimillion capital expansion. WHUD estimates that the interest payments on the bond payments alone would have come to $600,000 per year. WHUD predicts it will not need a major capital expansion until 2028. The Deluge Of Leaks Recovering water from leaks costs on average $1.21 per 1,000 gallons in the U.S., according to data from Bluefield Research, or less than half the cost of traditional water ($3.90 per 1,000) and far less than newer solutions like desalination, which averages over $8.00. Leakage control is even less expensive than encouraging consumers to conserve, according to data from the California Public Utilities Commission. Water lost through leakage is also prevalent. Globally, the World Bank Estimates that we collectively lose 32.6 trillion litres a year, or nearly enough to fill China’s Three Gorges Dam. While The City Sleeps To accomplish its goals, WHUD segmented its service territory into 33 district metered areas (DMAs) with Hydreka’s Hydrins2 insertion meters and in consultation with Matchpoint. Data from this network of meters was then delivered to OSIsoft’s PI System, a software platform that collects, cleans, and structures data from different devices to give engineers and technicians real-time insight into their overall operations and asset health. Rather than try to understand consumption patterns in daytime use, WHUD monitored water consumption rates between 1:00 a.m. and 4:00 a.m., when few consumers would be awake and legitimate consumption would be at the lowest level within a DMA. If a DMA exceeded a threshold value of 0.5 gallons per minute per household during this time period, PI System data would be employed to narrow down the location of a potential leak. The data would then be placed on an ESRI ArcGIS map so maintenance crews could prioritize repairs. “Without us knowing there was a problem in that area, we would have never been able to stumble upon that leak,” said Carl Alexander, GIS Director at WHUD. “Since implementation, this has held true with potential leaks being found daily, some so small they could have gone undetected for years. We have also been able to pro-actively notify customers that they may have a leak, so it has really been win-win.” “White House Utility District has demonstrated what can be accomplished through digital technology. Just as important, WHUD has shown that analytics and Big Data aren’t just for large utilities with extensive engineering departments. These tools are accessible to organizations of any size,” said Gary Wong, Industry Principal for Water at OSIsoft. “Water utilities could become one of the most important test beds for analytics.” It’s only when different data sources are pooled and cross-correlated that the full power of IoT analytics and artificial intelligence can be realised for water companies For a long time, water companies have been collecting a large amount of data in one form or another. Information is gathered for a specific project, for operational reasons, or as a need to solve or help to solve a problem, coming in all shapes, sizes and frequency. Data could be in the form of numbers, an alarm, customer call, a twitter message, an email, a letter – it is not the format, but what is done with it, that is key. So what is the meaning and purpose of the data collected? Is the data collected answering questions, such as “is the equipment performing as expected?”, “is the network performing as expected?”, “are leaks being fixed efficiently?”, “is customer service top-notch?”, “are customers receiving the service they expect?”, “are costs being reduced while operational efficiency is improved?”. The questions go on and on… It’s true to say that on one level or another, water companies are going through a digital transformation, but the real potential of data to make operations more efficient and cost effective is yet to be fully exploited. Some may argue that the reasons for this is the general conservative position of some companies and the embedded siloed works, or potentially the lack of support from the stakeholders to do something from a different stance. It can be a daunting task to maintain equipment and sensors, due to the vast numbers deployed and the scarce physical resources. Data could be continuously coming in as planned, or it might be received with interruptions, but the same questions should be asked: “can I trust the data received?”, “why is the data intermittent?”, “how do I distinguish noise from effective data?”, “how can I make effective use of the data?”, “how do I maintain my sensors efficiently?” and so on. A lot of data is collected through SCADA / telemetry systems. However such data might not be a reliable source, or may only being used for a specific purpose, and thus not utilising its full potential that it could achieve with cross-correlation with other data sources. Companies should be moving away from siloed work and embrace a holistic approach. This is where data science plays a role, with analytics, IoT and Artificial Intelligence using existing data and transforming it into operational and business decisions. PR19 methodology focuses on four key themes: Customer Service, Resilience, Affordability and Innovation. Innovation is also part of how Ofwat will assess the water companies’ business plans, which in turn will award companies with an “exceptional or fast-track status” for those that are ambitious and innovative with high quality business plans that benefit customers. These companies can not only expect higher financial returns, but they will have their reputation recognised for being the best. One way that water companies can innovate is using their existing data by leveraging new technologies and advances in IoT analytics to improve the reliability of their clean and wastewater networks. Several cases already in place show that Artificial Intelligence-driven predictive maintenance of assets leads to fewer failures, fewer pollutions or outages and lower overall maintenance costs. As such, it falls squarely within the resilience theme, with potential longer-term effects on affordability. Additionally, the Artificial Intelligence platform itself supports multiple objectives such as proactive communication to customers of network problems, understanding and dealing with customer contacts efficiently (customer service theme) and transformation of a water corporation into a digital enterprise (Innovation theme). Sensus honoured for rural smart technology innovation For the second year in a row, rural cooperative utility leaders honoured the Sensus Advanced Metering Infrastructure (AMI) solution from Sensus, a Xylem brand, as the “Best Smart Utility Solution” during the Rural Smart Grid Summit (RSGS). Powered by the FlexNet® communication network, the Sensus AMI solution helps utilities and co-ops build a smarter infrastructure that can support multiple applications. The solution consists of advanced metering for water, electricity, gas and lighting applications, all connected by the FlexNet system. The network securely transmits and receives data to help utilities and co-ops make better decisions now and in the future. What often begins as smart metering can develop into a more robust grid modernization effort that supports wide-ranging system measurement and control. SUEZ Announces Upgrades And Enhancements To Its InSight Asset Performance Management System Seeking to bring the next generation of its advanced digital solutions to water treatment professionals around the globe, SUEZ Water Technologies & Solutions recently announced upgrades to its InSight asset performance management (APM) system. InSight’s secure, cloud-based interface uses data and analytics to ensure assets operate at higher levels of reliability, efficiency and output. Incorporating modern digital design trends and best practices, the latest InSight release from SUEZ offers users greater visibility and transparency into the operations they manage—whether at an enterprise, plant or even asset level. Improved visualizations—including a new geomap feature—and simplified navigations aim to make InSight easier to use, while expanded reporting and file management features enable sharing and analysis of key data points at all levels of an organization. “As one of our core digital solutions, it’s crucial that InSight continues to evolve to meet the dynamic needs of our customers and the water industry as a whole. Offering faster and more comprehensive access to data and reporting, the latest InSight upgrade helps users to make better business decisions, eliminate unplanned downtime and lower operating costs,” said Ralph Exton, chief marketing officer, SUEZ—Water Technologies & Solutions. The new enhancements to InSight include four main capabilities: • Geomap and asset fleet view—new dashboards provide enhanced views of all the assets managed and key performance indicators across multiple plants. • Modernized user interface and navigation—new data-oriented views provide easy access to the information used on a daily basis. • Multi-site reporting—InSight’s expanded multi-site reporting capability provides a new level of visibility and transparency to an organization. • Enhanced file management—users are offered additional structure and flexibility within the file management feature of InSight. Page 8 Page 9
  • 6. What will the pump of the future look like? Few components in plant and equipment engineering are as steeped in tradition as the pump. But how does this fit in with the age of digitalisation? And is it even possible to design a hydraulic element that is fit for Industry 4.0? German manufacturer KSB is one firm which has been reconciling these two worlds successfully for some time now. The company is primarily focused on the optimisation of pumps – knowing the exact load profile and tuning the pump to the ideal operating point. This is borne out by the sheer number of different pump casings and materials used and the impeller adjustment options available. However, conditions can change during the life of a pump, and it often happens that a pump no longer runs at the optimum operating point. This also applies to newly installed pumps. For years now, KSB experts have therefore been investigating how to optimise pumps more easily without using complex analytics or even having to replace the pump. Digitalisation offers tremendous potential for this. However, it takes time to develop new approaches and put them into practice. “It’s a matter of transferring decades of experience and expertise into an algorithm and a software solution,” explains Dr Thomas Paulus, Head of Programme Office Digitalisation & Startup Projects at KSB. “This cannot be done in a single step: It involves many different components and aspects. By bringing together these component parts, however, you end up with an intelligent and practical concept that provides real added value for the pump operator.” Step 1: Digital Monitoring Unit The first step in this direction is a monitoring unit which shows in plain language what goes on inside a pump. KSB’s ‘PumpMeter’ monitoring unit, which fulfils this function, comprises pressure sensors as well as an analysing and display unit fitted to the pump. Two sensors in the pump measure the suction and discharge pressures around the clock. The PumpMeter uses this data to calculate the differential pressure and determines the current operating point, which is updated continuously in real time. A typical four-quadrant pump characteristic curve shows the range in which the pump is operating at a point in time. A flashing outer segment on the left or right of the display indicates that action is required – because the flow rate is either extremely low or too high. A flashing third quadrant in the pump curve indicates the optimum operating range. If the segment on the left (the second segment) is flashing, this indicates a long-term need for optimisation. This display allows the operator to evaluate the operating point immediately upon start-up and adjust the pump accordingly. Operators can see at a glance whether the availability of their pumps is at risk and whether they are operating economically. A flashing EFF (energy efficiency) symbol also indicates potential for significant energy savings. Step 2: Cloud analysis, including vibration characteristics This analysis now needs to be simplified further. In the future, instead of using wetted sensors, it will be possible to record vibrations and transfer this operating data to the cloud using mobile communication. This has two advantages: First, conventional measurements using wetted sensors are not always straightforward, particularly when the medium being pumped is a chemical product. Second, cloud access means that technicians can obtain information about the status of a pump from anywhere in the world without having to be on site. This application is currently being piloted very successfully with 100 selected project partners. “Those involved include some automotive suppliers, who are very open to the project.” Measurements taken in parallel using the PumpMeter are being used to verify the values obtained using the vibration sensor. At the same time, the KSB team is continuing to optimise the underlying algorithms. According to Dr Paulus: “Based on these results, it is already easy to see whether it makes sense to switch to closed-loop control, whether the settings or modes of operation need to be changed, or whether it would be better to buy a new pump.” The operating data is transferred to the cloud via a portal. KSB processes the data and the user receives an automatically generated PDF with clear recommendations and, where applicable, improvement suggestions for the pump. Step 3: Operating Point Optimisation How can these improvement suggestions be put into action? The traditional approach would be to call a service technician. But what if it were possible, based on the information obtained, to adjust the pump using software instead of having to adjust the impeller manually? “This is actually possible with our MyFlow Technology,” says Daniel Gontermann, Head of Product Management - Drives and Mechatronic Solutions at KSB. This is a combination of the KSB SuPremE IE5 motor and the MyFlow Drive, which is based on the proven PumpDrive speed-control system. The conventional approach for fixed speed pumps is to match the flow rate and head to the calculated operating point by trimming the impeller. Now, the pump can be adjusted by changing the speed. MyFlow Technology already offers many advantages in day-to-day work. Because the operating voltage of the IE5 synchronous reluctance motor is modulated by the minimum frequency inverter mounted on the motor, it can be used in almost any power grid around the world. This is also a huge advantage for global engineering contractors because they no longer need to consider the local mains voltage when selecting pumps. The direction of rotation is now defined at the factory, saving the time and costs usually incurred by conventional direction-of-rotation checks. Step 4: Software-controlled pump adjustment “Although these advantages make the pump operator’s job much easier, they are not enough to make a pump fit for Industry 4.0,” acknowledges Daniel Gontermann. “Nevertheless, they form the basis for the next crucial step: pump optimisation using virtual impeller trimming.” In the further course of the product life cycle, the pump speed can simply be adjusted to individual requirements by smart-phone – pump optimisation with virtual impeller trimming. “A software application can be used to bring the pump closer to its optimum operating point,” says the pump specialist. Unlike with mechanical impeller trimming, the operating process does not need to be interrupted. This is how you can quickly and economically optimise energy efficiency if the actual Q/H point deviates from the design values, or respond to a system-induced change in the operating point. “Because a change in speed is always associated with a change in power, substantial savings can also be made,” says Daniel Gontermann. Pump optimisation through virtual impeller trimming is fast and convenient by smart-phone or tablet via a Bluetooth gateway. “During development, special attention was paid to security. The KSB FlowManager app establishes a point-to-point connection, which ensures that the correct pump is being addressed, and only by the person entitled to do so,” says Daniel Gontermann. “The great thing is that you can now defer the individualisation of the pump to a much later point in the supply chain, which of course means that fewer variants are required.” This is another aspect that is likely to play a major role in pump selection in the future. With individual fixed speed adjustment, fewer pump sizes now cover the entire selection chart – with efficiency and NPSH values remaining practically constant. The variant complexity for hydraulics is reduced by more than 50%, saving time and money on design and administration. “Simply reducing the complexity by having fewer variants will promote the topic of virtual im- peller trimming,” says Daniel Gontermann. Conclusion Original equipment manufacturers (OEMs) will be the first to benefit from the new opportunities presented by digitalisation, by being able to drastically reduce their stock, for example. Nevertheless, this shows the direction in which pump technology will move. “Digitalisation is not an end in itself,” emphasises Dr Paulus. “Our users will only accept the new technologies if they bring added value to their day-to-day work and, above all, are workable.” This last point is certainly one of the greatest challenges. “In the same way that we have been getting the most out of pumps in terms of performance and efficiency for decades, we are now also making progress in developing the algorithms and software,” concludes. “Without our many years of pump expertise, it would be simply impossible to make a pump fit for the Industry 4.0 era.” Xylem To Acquire Pure Technologies Xylem Inc., a leading global water technology company, recently announced that it has entered into a definitive agreement to acquire all the issued and outstanding shares of Pure Technologies Ltd. (Pure) for CAD $9.00 per share in cash, representing an enterprise value of CAD$509M, or USD$397M. Pure’s Board of Directors has unanimously approved the transaction and recommends that Pure shareholders vote in favor of the transaction. Pure provides unique diagnostic and analytics solutions and services based on proprietary technologies to address key water and wastewater infrastructure challenges. It is a leader in intelligent leak detection and condition assessment solutions for water distribution networks, a rapidly growing market driven by the increasing adoption of digital solutions to improve utilities’ capital and operating efficiency. “The addition of Pure will strengthen Xylem’s position as a leading provider of intelligent solutions that address the water industry’s most persistent problems,” said Patrick Decker, Xylem President and Chief Executive Officer. “Aging infrastructure is a top concern of water utilities around the world, and infrastructure assessment is an attractive, growing market that directly addresses this challenge in a cost-effective way. Pure’s solutions strongly complement the broader Xylem portfolio, particularly our recently acquired Visenti and Sensus solutions, creating a unique and disruptive platform of diagnostic, analytics and optimiza- tion solutions for clean and wastewater networks. Pure will also bring greater scale to our growing data analytics and software-as-a-service capabilities. As one company, we will provide customers with even more powerful and innovative solutions enabled by cutting-edge technologies.” Earlier this year, Xylem and Pure entered into an exclusive commercial partnership in which Xylem represents Pure’s products and services in parts of the Middle East, India and Southeast Asia. Mr. Decker continued, “We have already begun executing on significant international growth opportunities through our existing commercial collaboration. Upon closing this transaction, those efforts will accelerate and expand globally. We are excited to be adding a tremendously talented team to Xylem that shares our commitment to bringing innovative solutions to the water industry. We look forward to continuing that work together to create substantial value for our customers and shareholders.” Pure reported consolidated revenue of CAD$126M and CAD$21M in adjusted earnings before interest, taxes, depreciation and amortization (EBITDA) for the 12 months ending September 30, 2017. Xylem expects to achieve at least $12M in annual cost synergies within two years of closing, including elimination of redundant public company costs, and procurement and footprint consolidation opportunities. Xylem also expects to generate revenue synergies that include accelerated international growth and cross-selling of complementary customer solutions. The USD$397M valuation represents a multiple of approximately 17x 2018 estimated adjusted EBITDA for Pure, or approximately 11x including run-rate cost synergies. “Throughout Pure’s evolution, we have been committed to delivering innovative and value-added solutions for our infrastructure clients,” said Jack Elliott, President and CEO of Pure. “Following this transaction, as we become part of a larger, global enterprise, we will be even better positioned to make a meaning- ful impact in solving the world’s most pressing water and infrastructure challenges. The acquisition of our company by Xylem will be of substantial benefit to Pure, its clients and employees.” Head-quartered in Calgary, Alberta, Pure has approximately 500 employees globally. It has corporate offices in Mississauga, Ontario, and Columbia, MD, as well as regional offices across the U.S., Mexico, Colombia, Australia and China. Approximately 90 percent of its 2016 revenues were generated in North America. Xylem will finance the transaction with cash and low interest, short-term debt. The transaction is subject to various customary closing conditions, including receipt of Canadian Court, Pure shareholders’ and regulatory approval under the Hart-Scott-Rodino Act (United States). It is expected to close in the first quarter of 2018. Page 10 Page 11
  • 7. Opinion: 2017 - A Year in Review for the “Smart Water” Industry It is towards the end of each year and the beginning of the next that you see commentaries from various institutes asking themselves what they have done in the year gone by and what to expect in the future. In a brief article this month I will look back at how the use of instrumentation, control, automation & data has developed in 2017 and what to expect in the year ahead. In this article a retrospective look at what industry has done albeit it with what is bound to be with a bias to what has happened in the UK (although I will try to expand things beyond these shores my ears don’t always stretch so far as I’d like). The question of the article – what have we actually done as a Water Industry in 2017? On a positive note, certainly in the UK, steps have been taken to acting “Smarter,” the Water Companies are starting to take a step towards “Industry 4.0.” General trends include: • WITS-IOT are starting to develop and the Water Industry Telemetry Standard is starting to become almost “Business as Usual” within the industry. • A huge amount of meetings about how to deal with data with the Water Companies realising that within their supply chains there is an incredible amount of talent that with collaboration can solve some of the problems that the industry faces. Some of the Water Companies have hosted innovation days and Hackathons to collaboratively work on some of the key problems the industry faces. • There have been interesting developments in communications protocols with the HART protocol, that has been an industry standard for main years in other industries, is finally coming to the foreground in the Water Industry. • The use of Bluetooth to communicate with instruments and the use of applications to communicate and programme devices remotely rather than using the display panel. • The use of radar level becoming more widespread with a cheap entry level radar being released and the development of a narrow-beam 80 GHz radar • Improved use of data and actually converting it into information to promote informed decision making with a fantastic project demonstrating the uses by Severn Trent Water at their works in Spernal and also in the distribution network • It has also been the year where non-contact area velocity flow monitoring has come to the forefront and the applications of the technology stretching out into the sewer network where the pressures for increased monitoring are mounting so that better control of the collection network can be seen with organisations such as Unity Water • Industry trends have been highlighted through reports by Black & Veatch and OFWAT as well as case studies being developed and championed by forum’s such as the SWAN Form and the Future Water Association • The use of laboratory techniques on the Water Treatment Plant as demonstrated by Affinity Water & Anatune for the analysis and management of Metaldehyde. These are just a few of the great things that have happened in the past year (or two realistically) and its important to focus on a few of the events that have been mentioned above in greater detail. The first aspect of 2017 to highlight is the work that has been done by organisations such as Severn Trent in the UK and by Unitywater in Australia which have shown how data should be operationally used by Water Companies in both the potable water and the wastewater side of the business. The SWAN forum conference that was hosted in London saw a huge amount of case studies of where data can and should be used and one of the simplest innovations that was discussed was that by George Theo, the CEO of Unitywater in Australia. Simply put the bills within Unitywater haven’t gone up for a number of years now because they have used the data that they collect everyday in a truly effective way. They have a handle on what water is leaking in their network and as soon as the cost of the leak is more than the cost of the repair a work order is automatically raised to affect the repair. In this way non-revenue water is kept to a level where it manageable. This sounds so sensible that it should just be something that is business as usual across the industry but if fact to actually do something this simple is incredibly difficult. Another case study of how the “Smart Water Industry” should work is the work that Severn Trent Water have done at their wastewater treatment works at Spernal as well as on the potable side too at their works at Trimpley. This in fact is a project that has been rumbling around in the background for several years and I’ve been hearing about the Spernal project for awhile. It is fair to say that 2017 saw its “grand reveal” to the industry at wide. A project that was collaboratively delivered by the company’s innovation & operational teams has seen the right instrumentation installed in the right place for operational needs to drive an informed decision making process and displaying it in the right way has empowered the operational teams on site so that they know what is going on at any particular time. The cost savings that this has gleaned have a return on the initial investment of around 30 months, a no-brainer for most water companies. . Typically this sort of advanced system has been limited to larger sites which have the economies of scale but at a population equivalent of around 50,000 this is not the case at Spernal making the project all the more impressive. Severn Trent Water are certainly the company to watch in this area as the questions from the company itself is…..we’ve done this….what next? The use of instrumentation on treatment works was also demonstrated by Affinity Water and Anatune to bring the “laboratory” analysis of Metaldehyde onto the treatment works and use the analysis to manage an industry-wide problem. Metaldehyde is notoriously difficult to analyse for and collaboration between Affinity Water and Anatune saw what is effectively a laboratory grade level of equipment turned into an online monitor that was installed on a potable water treatment works to allow the analysis of different water sources to manage the problem that the company has. This is a limited application to address a specific problem but one of the impressive things about the project apart from the actual instrument that was installed was the way that Affinity Water and Anatune shared the risk of the project and worked together to address the problems that were encountered. In the wider industry their does seem to be a move towards the “Digital Water Industry,” which is certainly a step forward. The Severn Trent projects at Spernal and Trimpley are an operational development in this regard and there are numerous ways in which this can improved upon. In fact we are starting to see this approach taken on a more holistic approach. This has been mirrored in the work that both the Environment Agency and OFWAT have been working on for PR19. There was always a psychological barrier in the Water Industry in the UK where the network (be it distribution or collection) was kept separate, you had infrastructure and non-infrastructure on both the potable water and wastewater sides of the business effectively creating four distinct parts and never the twain shall meet. Most recently, certainly on the wastewater side the barriers have started to erode. The Environment Agency with the event duration monitoring project and more recently the FFT control projects are bringing down the barriers so that network and treatment can work together pulling down the psychological design barrier that exists in the industry. This will certainly help with operational control. But where does the digital industry fit in? Is it a true Industry 4.0 or a nod to a concept that has the potential to change the way the industry works. OFWAT published their feeling on the subjects in their digital paper in 2017 however the most disappointing point of it was that it was limited to the customer only. This only fair as this is their area of responsibility but it was certainly a missed opportunity as it could have stretched so much further. However it was an idea of where they are coming from and I am sure they expect to see some aspect of the Industry’s future plans covering this area. If it isn’t looked at now then it is a big missed opportunity moving forward as can be seen by the work of Unitywater looking at the operational use of data and the digital industry can directly impact on the cost of the industry and thus on customer bills. The industry has been working hard in these areas with at least a few “hackathons” to look at using data and converting it to useable information and various water companies have promised the make the data that they can make “open.” Care has to be taken though as there are General Data Protection Regulations (GDPR) to take into account which includes customer privacy. 2017 has also been the year where Cyber-Security has come to the forefront of the industry. There was always teams within the companies protection the digital assets but they were always somewhat hidden. In 2017 their previous work and future challenges have certainly been highlighted all together with the challenges of the digital industry. This all wraps into a world that few people within the industry understand with communications protocols, the Internet of Things and WITS. It has tended to be something that has just happened and has been restricted to the few that fully understand what happens and how the data gets from one place to the other. Moving forward within the industry it is going to get more and more important. Everyone talks about the connected industry and one of the comments in the Black & Veatch industry trends report the number of connected devices is set to quadruple to 200 billion on a global basis and some of these “things” will be connected to the Water Industry be it a customer smart water meter connected to the Smart Home or a technicians table connected to an instrument. This is one of the last things to talk about in the Water Industry this year and that is the proliferation of things that can be connected to instruments. Bluetooth has been around from a domestic point of view that was originally invented in 1994. It has taken 23 years for it to be connected to instrumentation and use to diagnose and programme the instruments. This is relatively young when compared to the use of the HART Protocol (Highway Addressable Remote Transducer Protocol) that was invented by in the mid 1980’s by Rosemount and was made an open protocol in 1986. 31 years later it has started to be used in the Water Industry in earnest, between the use of Bluetooth and the HART protocol (which is already in most of the instruments that the industry have installed) there is a huge amount of data that can at least be used on a local basis to help keep the instrumentation operating correctly. It will be moving forward and education for the industry to understand what it already has in place. In the past there have always been the complaints that the “Smart Water” Industry has been something that has shows a huge amount of promise that has never been realised. I think it is fair to say that we, as an industry, are starting to realise it right now. Previous years have seen the development of Smart Water Networks and if you have any doubts about their delivery then speak to the Smart Water Networks (SWAN) Forum who will give you case study after case study of things that are in place now. The Wastewater Collection Network has seen developments within the past two to three years building on top of innovations seen around the world in cities like Barcelona, Cincinnati & Copenhagen amongst others and the networks are developing faster and faster. With the advent of Event Duration Monitoring in the UK and in 2017 some fines of an order of magnitude higher than most has given the impetus the industry needs to develop more intelligent solutions. So, 2017 has been a year where the industry has taken a step forward, albeit a baby one. There is a lot of potential that is going to be developed over the coming year and onwards into the future which will see the baby steps potentially turn into some giant leaps for the Water Industry not just in the UK but potentially across the glove. The “Smart Water” Industry has always shown plenty of promise as to how it can support the day to day operations and it is potentially now that we are seeing at least some of that promise being realised. Figure 1: The Spernal Effluent Factory Approach Figure 2: Affinity Water/Anatune Metaldehyde Project Page 12 Page 13
  • 8. Article: Smart Networks Organisation Design Water company organisation design is out of date. Four major issues need addressing: • Tactical orientation around regulatory targets needsto be replaced by a more strategic approach • The long view has been neglected because of thecompelling demands of the short-term • Technology is changing how the network ismonitored and operated from a largely manual to a remote and automated paradigm • Large amounts of data are becoming available and this has to be used to the greatest effect Tactical vs strategic The UK has had a fairly effective regulatory regime in place since the industry was privatised. The regulatory requirements have included a number of specific metrics, and organisation design has tended to orient around the achievement of regulatory targets. This is most obvious in the creation of the role of Leakage Manager. The downside of this approach is that targets become an end in themselves. Each department pursues its own separate agenda and there is no easy mechanism for reconciling conflicting aims or assessing opportunities for solutions which have wider benefits. Network monitoring and pressure management are good examples of solutions whose benefits cut across a range of regulatory targets. Figure 1 shows the wide range of sizeable benefits that advanced pressure management delivers. It appeals to the Leakage Manager and to the Energy Manager and to Customer Services and to the Finance Manager and to whoever is unfortunate enough to feel responsible for customer minutes lost. But only in the most enlightened water companies are these people likely to come together and spontaneously pool time and budget to specify and procure such a solution. Organisation design needs to take much more of a process view of water distribution, and a holistic view. Regulatory targets need to be shared responsibilities to which many people can contribute. Someone with a financial background who understands the network needs to assess the return on investment of projects for the whole network not just an individual department. The long view and the short view Because the water network consists of old and ageing infrastructure, and because it has consisted mostly of manual tasks, thinking is typically quite short- term. People have to spend the majority of their time dealing with the problems that present themselves: a burst, a leak, a new housing development. What needs to change is that more work needs to be put into planning, prediction, and prioritisation. The challenges that ageing infrastructure and growing urbanising population present are only going to get bigger. This requires the ring-fencing of time or people to do this work to get the organisation onto the front foot. Embracing technology Anyone who works in the water treatment area can observe a 50 year history of remote and automated operation. But in the network world, this is brand new. Since around 10 years ago, pervasive mobile communications, battery life, and low power electronics have been making remote and automated operation possible. Pump stations should no longer be the province of control but should belong to the network team. There was a time when the fact that pump stations were mains powered and could be remotely operated and monitored meant that they were unique in the network world and much more akin to the water treatment world. It was logical to include them in the domain of the Control team. But today battery power means that much of the network can be remotely operated and monitored. It is time for pump stations to return to their logical owners – the network team – so that their role in network performance can be fully assessed, and their contribution to delivering performance and resilience requirements can be optimised. Figure 1:Benefits of Advanced Pressure Management Data analytics The reducing cost and increasing availability of sensors, and their ability to return more data more often is creating a tsunami of data. Historically, network knowledge has often been the province of the longest serving employee. Technology is enabling data to be processed quickly, effectively and tirelessly at every time of the day and night. If this is to be harnessed with in-house capability then the right skills need to be acquired and housed in an organisation that is not used to the sort of people who can code in R. If this is to be harnessed from suppliers, then the skills to specify what is required are nonetheless necessary. Another aspect of this change is the requirement of the organisation to become more data driven in its decision making, and less reliant on opinion. This is a cultural change which will need to be championed at the top of the organisation. The organisation design in figure 3 offers a template for how to organise resources to take account of these 4 issues. Two important things need to be said about it. The first is that no organisation design is perfect. Every organisation design has its strengths and weaknesses, and its white spaces which need to be managed carefully. It is easy to pick holes in a proposed design. But the question you need to ask is whether, on balance, it offers a better way forward than your existing design. The second is that all organisation designs need to accommodate the specific capabilities of a particular company’s employees. It may make sense to combine areas and teams, or to split out a particular function, to reflect the skill-set of individuals. However, it would be unwise to go too far down this road because it becomes much more difficult to replace leavers if the organisation design is moulded uniquely to them. Whatever organisation design you choose, you should satisfy yourself that it enables you to deliver your business objectives, and address the challenges you face and the opportunities that you have. Figure 2: Data Analytics i2O provides a suite of smart network solutions to help water utilities respond to the challenges created by increasing and urbanising population, more extreme weather events, old and ageing infrastructure, an ageing workforce, more demanding and more vocal customers, and a lack of appetite for increasing bills. The business benefits achieved by i2O’s clients include 20-40% reductions in leakage, bursts, operational costs and energy bills, more than 5 years added to asset life, improved customer service, and a return on investment within 12 months. Page 14 Page 15
  • 9. Focus On: Analysing the Nitrogen Cycle Introduction Nitrogen in its many forms has a direct impact on the environment. Ammonia is toxic to fish, Nitrous Oxide is a major greenhouse gas and nitrate is a major source of nutrients and in the water environment along with phosphorus is a major cause of eutrophication. In the right place it is one of the essential nutrients for growing things but like a rose in a wheat field can be classed as a weed so can nitrogen in the aquatic environment. As such both ammonia and nitrate, the major forms of nitrogen in the aquatic environment are heavily regulated. Ammonia is a key regulated parameter in wastewater treatment under the Urban Wastewater Treatment Directive. At the low levels of ammonia in some consented discharges its treatment comes at relatively high cost but it is treatable to relatively low levels. Nitrate as a key source of eutrophication is also highly regulated under the Nitrates Directive which limits the application in vulnerable areas. In the UK these areas cover 58% of the UK. The processes for treating nitrogen in wastewater are relatively simple and common within the wastewater treatment process. Within the wastewater treatment process ammonia is converted to nitrate in the process of nitrification. This is a highly energy intensive process as it relies on the addition of significant quantities of air, so controlling it to at or just below a consented level comes with significant financial incentives. Of course to control ammonia removal you of course have to measure it. To go a step further to removal the nitrate by the de-nitrification process is also a particularly expensive process necessitating the measurement of nitrate to in some cases. 2NH4 + 3O2 2NO2 + 2H2 O 2NO2 + O2 2NO3 To denitrify the nitrate is taken to nitrogen gas by reduction from Nitrate to Nitrite to Nitrogen oxide and eventually it is completely reduced to nitrogen gas. The overall reaction for this is 2NO3 + 10e- +12H+ N2 +6H2 O So what are we analysing for? So within the wastewater treatment process what aspects of the nitrogen cycle are we actually analysing for. What instruments do we have to put in the ground and why? The answer to this is of course what are you actually looking to do and this depends upon what concentrations of what are you regulated to and what are you hoping to achieve. For this we go back to the consent and see what are the key parameters. The most common consented parameter is ammonia. At best there won’t be a consented discharge concentration for ammonia. A lot of treatment works are either on the coast where discharge of ammonia isn’t a problem or a works is too small to warrant an ammonia consent. Basically ammonia isn’t a problem that has to be dealt with. At the next best the ammonia consent will be relatively high where, although it would be good practice to measure it online, the actual consented concentration is relatively high the process that has to be used to treat it is relatively low intensity (think a trickling filter) that there is no actual point in measuring for ammonia. The worst case is where an ammonia consent is relatively tight and this starts to necessitate measuring ammonia online for two reasons. Firstly it becomes necessary to either or actively monitor and/or actively control the levels of ammonia within the wastewater treatment system to ensure compliance and secondly the cost. To treat ammonia to low levels by nitrifying it becomes very costly at the lower levels as the nitrification process intensifies. We will come on how we analyse ammonia in both the laboratory and online later on in the article. So, what else in the many forms of nitrogen can we analyse for? The next most obvious parameter is nitrate. If you take the nitrification process you can check its performance by analysing for the end result, i.e. nitrate. It is great indication on the health of the nitrification process to check the levels of nitrate. If they are relatively high it is safe enough to check that the bacteria within the process are healthy and working. If a plant has a total nitrogen consent then it is also a good indication as to what concentrations the de-nitrification process is starting and theoretically at least be used as an input concentration to a feed-forward control process especially considering the end point of the de-nitrification process is a gas and so isn’t actually in the liquid phase. However the regulation on some plants is for total nitrogen….what is this? When within a consent it states total nitrogen it is literally the Total Nitrogen, i.e. the sum of the nitrate, nitrite and Kjeldahl Nitrogen (which is organic nitrogen plus ammonia). However, the Kjeldahl Nitrogen is often ignored as its normally a relatively low level when compared to the other analytes and the testing in the lab is relatively difficult to do and so often the Total Nitrogen is classed as the sum of ammonia, nitrate & nitrite. The problem comes as to how do you analyse for total nitrogen online without analysing for ammonia, nitrate, nitrite and potentially organic nitrogen. The plain answer? You don’t. Figure 1: Nitrate Vulnerable Zones in the UK Anything else? The only other analyte often analysed for within wastewater is nitrous oxide or N2O. Most people’s first thoughts are why are we analysing for laughing gas. Well it is one of the stages within the nitrification process and can be used as an indicator of the health of an activated sludge system. The theory being that an activated sludge system that is under undue stress gives off higher concentrations of nitrous oxide. As it is a greenhouse gas and a very potent one it is obvious as to why it needs to be analysed for and operational strategies put in place to minimise nitrous oxide emissions from the activated sludge process. To summarise, within wastewater we analyse for: • Ammonia • Nitrate • Nitrous Oxide (less common) But how is it done, in both the laboratory and online field base environments? Analysing for Ammonia The methods for analysing for ammonia within the laboratory environment are relatively simple colourimetric methods that are often used in field test kits that manually measure ammonia within the field. The concentration level of ammonia that is analysed for is important as there is a difference between the sensitivity of the field tests whether the ammonia is within a low or a medium range concentration. The low range test is the sodium salicylate method and this method is often used within potable waters. This colourimetric test produces a yellow colour at the lower ranges of the test to a green colour at the higher ranges. The salicylate method is a variation of the Berthelot-Phenate method but does not require the use and disposal of toxic phenol. The salicylate method involves a three- step reaction sequence. The first reaction step involves the conversion of ammonia to monochloroamine by the addition of chlorine. The monochloroamine then reacts with salicylate to form 5-aminosalicylate. Finally, the 5-aminosalicylate is oxidized in the presence of sodium nitroferricyanide (a catalyst) to form a blue-green coloured dye that absorbs light at 650nm. The blue colour is actually masked by the yellow colour of the excess reagent to give a final green coloured solution (at higher levels). At higher concentrations, that are more common in wastewater the Nessler test is used. Where this test is less sensitive that the salicylate test it is used in preference as it is more applicable to wastewater analysis as the concentrations in wastewater are often above the range of the salicylate test (especially when considering crude sewage). Ammonia reacts with the Nessler reagent (K2HgI4) to form a yellow coloured complex which can be detected spectrophotometrically at 430 nm and is directly proportional to the ammonia concentration. Stabilizer solution (potassium sodium tartrate) is added to prevent cloudiness of the Nessler reagent which may occur in some waters due to calcium and magnesium concentrations. However both of these methods are colourimetrically based and so would require flow cells and visible spectrophotometers to be place within a cabinet to work and so the online methodology for the analysis of ammonia in wastewater uses a couple of different methods of analysis. The first method of online analysis is using a liquid immersed ion-selective electrode (ISE). In this particular method the ion selective electrode is immersed in the wastewater directly. The basic principle of ISEs is that, on immersing the electrode in a test solution, the selected ions in solution pass through the ion- selective membrane until an equilibrium is reached between the concentration inside and outside the membrane. This causes an electrical potential to be developed which is proportional to the concentration of the ions in the external solution. This is measured in millivolts (mV) as the difference in potential between the ISE membrane and a stable constant reference voltage produced by a reference electrode which is also immersed in the same solution. The method does have interferences like most ion-selective membranes which are not entirely specific for the designated ion but also allow the passage of some other ions to a greater or lesser extent. This increases the charge on the membrane above that which is due solely to the detected ion and causes a spuriously high measurement. This phenomenon is known as Interference and the extent of this interference is expressed as the Selectivity Coefficient. The selectivity coefficient is the ratio of the apparent concentration calculated for the interfering ion to that calculated for an equal amount of the detected ion. NB: this is not the same as the ratio of the mV signals developed by the electrodes in response to these ions, because the voltage is only directly proportional to the logarithm of the concentration. The selectivity coefficient can be determined experimentally to give some idea of the order of magnitude but it is not a constant factor since it depends on several parameters including the concentration of both ions, the presence of other ions in solution, and the temperature. In the past this phenomenon has limited the use of ion-selective electrodes to only those applications where the interfering ion is known to be absent or only in a relatively small concentration compared to the detected ion. In the case of ammonium analysis, the most significant interference is from the potassium (K+) ion. Potassium is a very common element and occurs in relatively high concentrations in most natural waters. The selectivity coefficient for the NH4 electrode for K is about 0.1. This means that if there are equal concentrations of both elements then the K interference will increase the NH4 measurement by about 10%. To put it another way, if the K content is ten times more than NH4 then the measured concentration will be about twice what it should be. A further complication is that the K electrode is also interfered with by the NH4 ion. However, in this case the selectivity coefficient is only about 0.01 so this has a much smaller effect Figure 2: The theory of the Salicylate method Figure 3: An Ammonia ISE in an ASP Page 16 Page 17
  • 10. on the analysis. Practically this means that any online Ion Selective Electrode need potassium correction and also needs to be calibrated relatively frequently for online measurements. The second method of analysis for ammonia is using a gas-sensing ion-selective electrode in preference to the immersed electrode. This is much a more sensitive method as only the ammonia is presented to the electrode by raising the pH of the sample solution. Sodium Hydroxide (NaOH) is added to the wastewater and as the pH increases the dissolved a mmonia in water is converted to ammonium. As the pH increases further the ammonium in solution is converted to a gaseous form. The gas sensing electrode works in the same way as the ion-selective electrode by creating an electrical potential that can be measured in millivolts. The design of the ion- selective electrode and its components are shown in figure 5. Taking a gas sensing electrode system ammonia system apart the key features can be analysed. Apart from the gas sensing electrode one of the most important parts of an online gas sensing electrode monitor is the sampling and sample preparation system. The sampling of the wastewater is often done in one of two ways. The first way is by using a peristaltic pumping system which draws the sample into a sample chamber where the chemicals are added and the ammonia gas formed. The weakness of a peristaltic pumped system is two-fold as the diameter of the peristaltic pump tubing is subject to blockage and secondly over time the pump tubing will stretch creating problems with the pumping system. This is overcome by having pump tubing that is a wide enough diameter to minimise the risk of blockage and the tubing becomes a replaceable part. The second method of sampling is using a vacuum pump that literally sucks the sample to a sample chamber and wastes it after the sodium hydroxide is added. Depending upon the system this either puts the sample chamber in direct contact with the wastewater (in some systems) or uses a tubing structure that again has a risk of blockage (although this tends to be smaller as the tubing is of a wider bore). This sampling structure is very similar to that used in wastewater samplers. The last drawback of a gas sensing electrode system is that it does utilise chemicals that have to be replaced on a fairly regular basis. This usually consists of a sodium hydroxide solution and ammonia standard solution. The standard solution is used to calibrate the ammonia monitor on a daily basis. It can also be used to detect low level ammonia concentrations by using a standard addition methodology depending upon the mode of operation of the online analyser. As a result of this the gas sensing online methodology for ammonia is a highly reliable method of analysis that is able to achieve great accuracy. Analysing for Nitrate The analysis of nitrate in wastewater is limited to those treatment works that tend to have a total nitrogen consent and so the application of nitrate sensors is limited although they do exist. In the laboratory the analysis of nitrate has multiple different methods depending upon the accuracy required. The three main methods that are used are: 1. Cadmium Reduction Method 2. Ion Chromatography 3. UV detection method The cadmium reduction method uses Cadmium metal reduces nitrate in the sample to nitrite. The nitrite ion reacts in an acidic medium with sulfanilic acid to form an intermediate diazonium salt. The salt couples with gentisic acid to form an amber coloured solution which is then measured at 500nm using a spectrophotometer. The obvious disadvantage of this method is that the sample waste contains waste cadmium which is toxic. The Ion Chromatography method is one of the most utilised and accurate methods in the laboratory and utilises a chromatographic column which separates the anions (or cations depending upon the charge of the column) from each other and analyses their concentration against a standard solution and measures the concentration of the anion (for example nitrate) by using a detector that measures the conductivity of the solution with the concentration being directly proportional to the conductivity of the separated anion at a point in time. This is the one of the most accurate methods for the detection of nitrate with the only interference being other anions that are in solution. The last laboratory technique is not recommended for samples that have a high organic interference, such as wastewater, and uses the absorbance at an ultraviolet wavelength of 215nm with an organic correction factor at 275nm. In this method nitrate absorbs strongly at 215nm and interfering organics absorb strongly at 275nm. By measuring at both wavelengths the concentration of nitrate can be found by comparing against a calibration curve and deducting the Figure 4: Ammonia speciation at different pHs Figure 5 - Gas sensing electrode design Figure 6: Gas sensing ammonia monitor in an Activated Sludge Plant interfering substances that also have an influence at 215nm. In the laboratory this is used as a good indicator of nitrate concentration but is usually fully quantified by using the cadmium reduction or ion chromatography methodologies. Although the UV method is thought of as semi-quantative which is affected by the concentration of organics it is utilised as a fully quantitative method online in the wastewater industry with obvious disadvantages over the accuracy of the method. A typical UV analyser in the water industry utilises a broad-spectrum, high intensity xenon strobe lamp, housed in the emitter module which generates pulses of light that pass through the sample water in the flow-cell to a filtering and detection system, contained in the receiver module. The received light pulses are analysed at two wavelengths; the measurement wavelength of 215nm and the reference wavelength of 275nm (at which the sample constituents of interest do not absorb). This dual light path system provides information that enables the measured value to be corrected for any turbidity due to suspended matter in the sample. The monitor is calibrated with a pure solution of a known nitrate content. Using the pulsed UV light eliminates some of the uncertainties associated with the laboratory method which normally uses a tungsten lamp array and the fact that the organic interference in wastewater should be stable allows for any interferences to be compensated for. The second method of online nitrate analysis is to use an ion-selective electrode method in a similar methodology to that of the ammonia ion-selective electrode. The ion selective electrode method is not completely selective for nitrate with major interferences from chloride and bicarbonate ions when their weight ratios to nitrate-N are > 10 or > 5 respectively. There are also interferences where the pH is changeable. To overcome these interferences monitoring of any sample by ion-selective electrodes usually requires certain conditioning to be performed on the sample to allow accurate, trouble-free measurement. Such conditioning involves regulating flow, controlling temperature and adjusting chemical composition prior to presentation of the sample to the point of measurement. A typical monitor carries out these adjustments for each parameter in simple and easily understood steps. The sample is presented from the user’s pipework to a constant head unit and any excess is allowed to overflow. This allows sample, under controlled pressure conditions, to be presented to a multi-channel peristaltic pump which proportions sample and reagent solutions through the monitor to the mixing point. The resulting combined solution is then temperature controlled to remove the effects of sample and ambient temperature variations. The conditioned solution is then delivered to the flow-cell, under constantly flowing conditions, where the ion measurement takes place. This measurement is carried out using an ion-selective sensing electrode. The sensor generates a millivolt output which is proportional to the ion concentration. This output is processed by the microprocessor-based electronics section to calculate the actual sample concentration. To maintain optimum measurement accuracy it is necessary to introduce standard solutions of known concentration for calibration purposes. Analysing for Nitrous Oxide The measurement of nitrous oxide has become popular in the last few years when it was realised that activated sludge plants were a source of the greenhouse gas. A vast amount of research has been done in nitrous oxide emissions from the secondary process and mostly this has involved some sort of gas collection system and then using traditional laboratory techniques involving gas chromatography. This is impractical to measure on the plant level although it must be noted that a similar sort of technology has been employed on a plant level for metaldehyde in potable water. However the benefits of doing this for nitrous oxide simply do not exist. The benefits of measuring nitrous oxide are thought to be based around indications of Activated Sludge Plant health with a plant that is starting to decay in performance emitting more Nitrous Oxide that a plant that is operating in a stable fashion. The cause of plant stress normally being dissolved oxygen or potentially sludge age related. In the online environment there are few sensors available, but they do exist and are commercially available. They are basically a miniaturized Clark-type sensor with an internal reference and a guard cathode. The sensor is equipped with an oxygen front guard, which prevents oxygen from interfering with the nitrous oxide measurements. The sensor is connected to a high-sensitivity picoammeter and the cathode is polarized against the internal reference. Driven by the external partial pressure, nitrous oxide from the environment will penetrate through the sensor tip membrane and be reduced at the metal cathode surface. The picoammeter converts the resulting reduction current to a signal . The internal guard cathode is also polarized and scavenges oxygen in the electrolyte, thus minimizing zero-current and polarization time. Nitric Oxide (NO) and high concentrations of sulphide are known to interfere with the measurement of Nitrous Oxide. Figure 7: Typical ion chromatograph for nitrate Figure 8: Typical Ion selective electrode setup for analysing nitrate Page 18 Page 19