Good Times or Bad Times for Globalization? Highlights from the Depth Index of Globalization 2013
•
21 recomendaciones•3,477 vistas

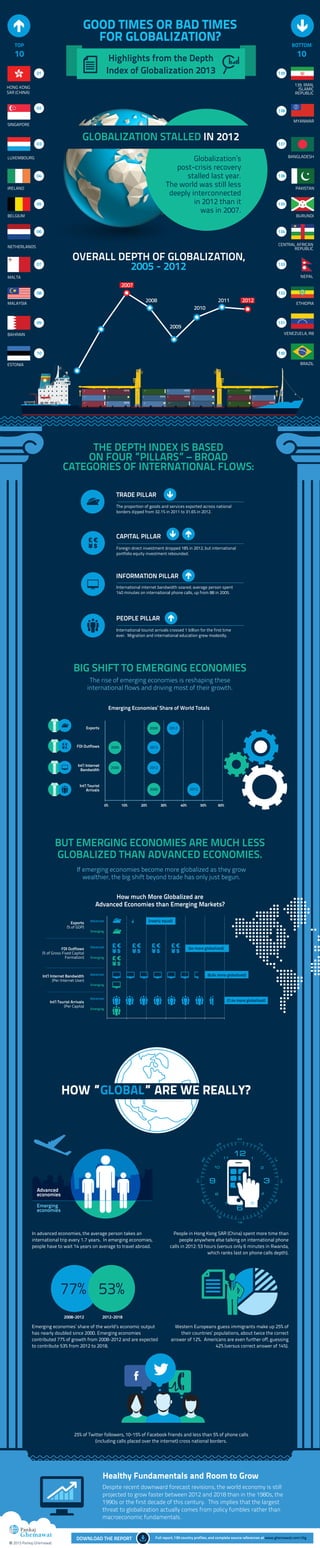
Is it the best of times or the worst of times for globalization? The 2013 Depth Index of Globalization (DIG) reveals that overall, globalization’s post-crisis recovery stalled in 2012. The DIG uses hard data to rank 139 countries on the depth of international trade, capital, information and people flows, and it provides insights into the future course of globalization. Visit http://www.ghemawat.com/dig for the full 2013 DIG report and other resources.
Recomendados

Recomendados
Más contenido relacionado
Destacado
Destacado (20)
Similar a Good Times or Bad Times for Globalization? Highlights from the Depth Index of Globalization 2013
Similar a Good Times or Bad Times for Globalization? Highlights from the Depth Index of Globalization 2013 (20)
Último
Último (20)
Good Times or Bad Times for Globalization? Highlights from the Depth Index of Globalization 2013
- 1. GOOD TIMES OR BAD TIMES FOR GLOBALIZATION? TOP 10 10 Highlights from the Depth Index of Globalization 2013 01 BOTTOM 139 139. IRAN, ISLAMIC REPUBLIC HONG KONG SAR (CHINA) 02 138 MYANMAR SINGAPORE GLOBALIZATION STALLED IN 2012 03 Globalization’s post-crisis recovery stalled last year. The world was still less deeply interconnected in 2012 than it was in 2007. LUXEMBOURG 04 IRELAND 05 BELGIUM 06 137 BANGLADESH 136 PAKISTAN 135 BURUNDI 134 NETHERLANDS OVERALL DEPTH OF GLOBALIZATION, 2005 - 2012 07 CENTRAL AFRICAN REPUBLIC 133 NEPAL MALTA 08 132 MALAYSIA ETHIOPIA 09 131 VENEZUELA, RB BAHRAIN 10 130 BRAZIL ESTONIA THE DEPTH INDEX IS BASED ON FOUR ”PILLARS” – BROAD CATEGORIES OF INTERNATIONAL FLOWS: TRADE PILLAR The proportion of goods and services exported across national borders dipped from 32.1% in 2011 to 31.6% in 2012. CAPITAL PILLAR Foreign direct investment dropped 18% in 2012, but international portfolio equity investment rebounded. INFORMATION PILLAR International internet bandwidth soared; average person spent 140 minutes on international phone calls, up from 88 in 2005. PEOPLE PILLAR International tourist arrivals crossed 1 billion for the first time ever. Migration and international education grew modestly. BIG SHIFT TO EMERGING ECONOMIES The rise of emerging economies is reshaping these international flows and driving most of their growth. Emerging Economies’ Share of World Totals Exports 2000 FDI Outflows 2000 2012 Int’l Internet Bandwidth 2000 2012 2012 Int’l Tourist Arrivals 2000 0% 10% 20% 2012 30% 40% 50% 60% BUT EMERGING ECONOMIES ARE MUCH LESS GLOBALIZED THAN ADVANCED ECONOMIES. If emerging economies become more globalized as they grow wealthier, the big shift beyond trade has only just begun. How much More Globalized are Advanced Economies than Emerging Markets? Exports (% of GDP) Advanced FDI Outflows (% of Gross Fixed Capital Formation) Advanced Int’l Internet Bandwidth (Per Internet User) (nearly equal) Advanced Int’l Tourist Arrivals (Per Capita) Emerging (4x more globalized) Emerging (6.6x more globalized) Emerging Advanced (7.4x more globalized) Emerging HOW “GLOBAL” ARE WE REALLY? Advanced economies Emerging economies People in Hong Kong SAR (China) spent more time than people anywhere else talking on international phone calls in 2012: 53 hours (versus only 6 minutes in Rwanda, which ranks last on phone calls depth). In advanced economies, the average person takes an international trip every 1.7 years. In emerging economies, people have to wait 14 years on average to travel abroad. 77% 53% 2008-2012 2012-2018 Emerging economies’ share of the world’s economic output has nearly doubled since 2000. Emerging economies contributed 77% of growth from 2008-2012 and are expected to contribute 53% from 2012 to 2018. Western Europeans guess immigrants make up 25% of their countries’ populations, about twice the correct answer of 12%. Americans are even further off, guessing 42% (versus correct answer of 14%). 25% of Twitter followers, 10-15% of Facebook friends and less than 5% of phone calls (including calls placed over the internet) cross national borders. Healthy Fundamentals and Room to Grow Despite recent downward forecast revisions, the world economy is still projected to grow faster between 2012 and 2018 than in the 1980s, the 1990s or the first decade of this century. This implies that the largest threat to globalization actually comes from policy fumbles rather than macroeconomic fundamentals. © 2013 Pankaj Ghemawat DOWNLOAD THE REPORT Full report, 139 country profiles, and complete source references at www.ghemawat.com/dig