![Implementation of the Wild Salmon Policy ,[object Object],See Shuter et al. (1997),“ Reply:Toward a definition of conservation principles for fisheries management;” Grumbine (1994) , “ What is ecosystem management?” Mangel et al. (1996) ,“Conservation of wild living resources;” and Olver et al. (1995)“Toward a definition of conservation principles for fisheries management.”](data:image/gif;base64,R0lGODlhAQABAIAAAAAAAP///yH5BAEAAAAALAAAAAABAAEAAAIBRAA7)
Recomendados
Recomendados
Más contenido relacionado
La actualidad más candente
La actualidad más candente (20)
Similar a Wild Salmon Policy Primer
Similar a Wild Salmon Policy Primer (20)
Más de PatM56
Más de PatM56 (9)
Último
Último (20)
Wild Salmon Policy Primer
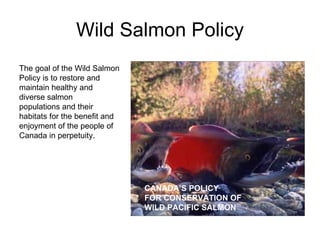
- 1. Wild Salmon Policy CANADA’S POLICY FOR CONSERVATION OF WILD PACIFIC SALMON The goal of the Wild Salmon Policy is to restore and maintain healthy and diverse salmon populations and their habitats for the benefit and enjoyment of the people of Canada in perpetuity.
- 4. Implementation of the Wild Salmon Policy The map shows the watersheds (coloured areas on map) associated with the 13 Ocean Zones in BC. Note that the Puget Sound zone, which is comprised of the headwaters of the Skagit River in Canada, does not support migratory (anadromous) Pacific salmon.
- 5. Implementation of the Wild Salmon Policy The map shows the 26 Freshwater Zones within BC with anadromous salmon.
- 6. Implementation of the Wild Salmon Policy This map shows the 33 Joint Adaptive Zones within BC that have anadromous salmon. Each zone is a unique pairing of the Freshwater and Ocean Zones.
- 11. Wild Salmon Policy (WSP 2005, p.18)
- 12. Abundance Fishing mortality Distribution Trends in abundance Assessing status Uncertainties
- 13. Spawner abundance Trends in abundance over time Fishing mortality Distribution Class of indicator Quantifiable metrics Benchmarks Status Uncertainties Assessing status
Notas del editor
- To meet the conditions for benchmarks described above, we suggest four classes of indicators, the first of which, abundances (production), is clearly described in the WSP as one approach for assessing status (p. 17). To minimize COSEWIC listings (the second condition), we suggest two additional classes of indicators: time trends in spawner abundances and distribution (the later is also being suggested in the WSP as an indicator of status). Although COSEWIC criteria do not explicitly include fishing pressure relative to sustainable levels (i.e., relative to intrinsic productivity of the stock), we include that as a fourth class of indicator to assess likelihood of continued trends in abundances (declines or increases) given current fishing effort That fourth class differs from the first three in that it reflects an external stressor instead of an intrinsic property of the population.
- This figure illustrates the hierarchical framework that relates indicators, quantifiable metrics within classes of indicators and benchmarks on each metric. We identified candidate metrics and benchmarks drawn from the scientific and management literature